Category Archives: hand-on activity (difficult)

Rogue waves in a bath tub

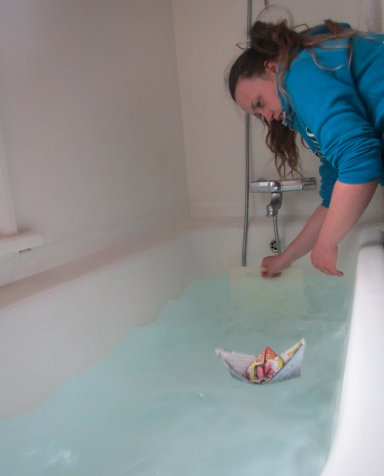
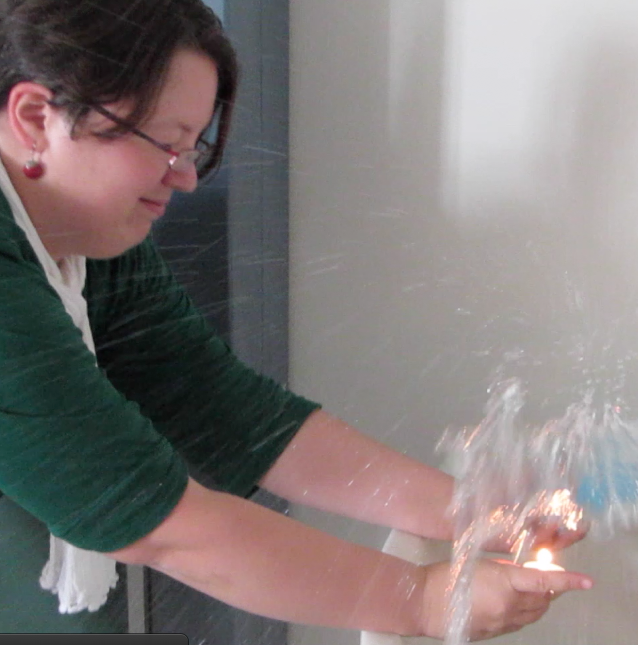
Trying to create rogue waves in the bath tub of the infamous “red house”.

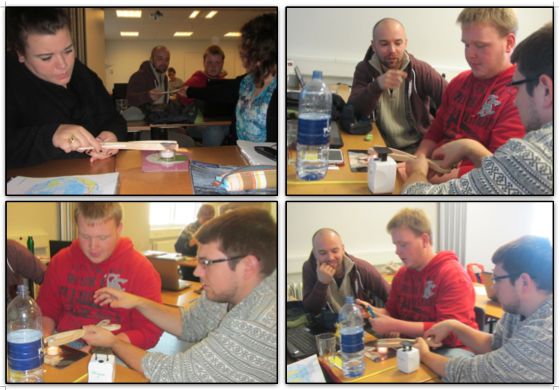
As a part of their projects, students in the CMM31 in Isafjördur course had to conduct an experiment, document and interpret it. One of the students, Silvia, chose to create rogue waves in the bath tub of the “red house”, one of the student houses, and I was invited to participate and eat delicious cupcakes.

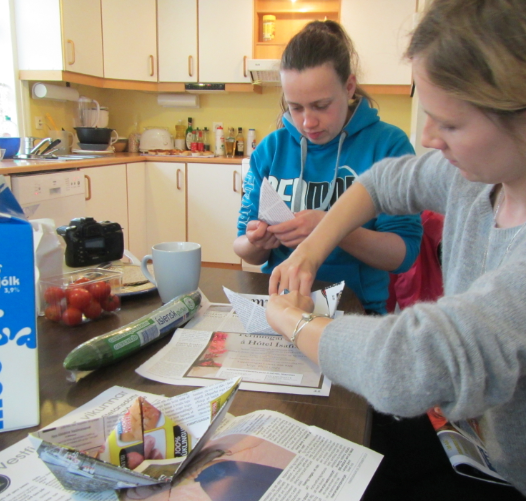
Since rogue waves can have devastating effects on ships they encounter, clearly we had to have a ship. None were to be found, so we had to make our own.

Since most studies of rogue waves in wave tanks had a hard time actually producing the waves (and a bathtub might not be the most ideal setup) we did not have high hopes that our experiment would be successful. And we did not manage to produce rogue waves in the strict sense – but we managed to avoid major spillage of the tub and still sink a couple of the paper boats, so at least we were getting some results.

Great to see students do experiments on a Sunday afternoon!
Velocity of shallow water waves.

The experiment we run to discuss the velocity of shallow water waves.

In this post, I discussed how it took us several years to modify an experiment to make it both student and teacher-friendly. But what can you actually see in that experiment?

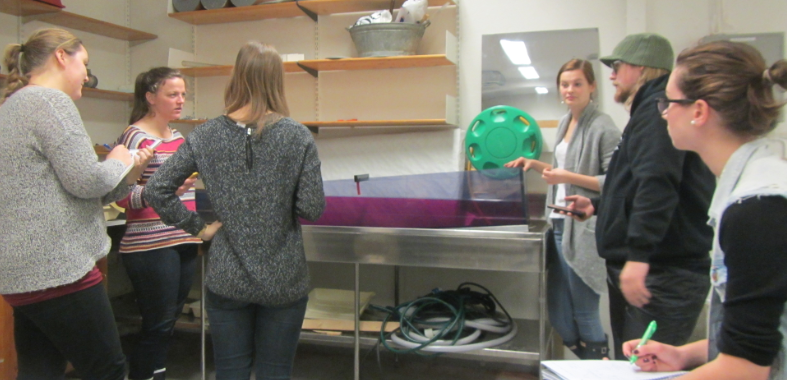
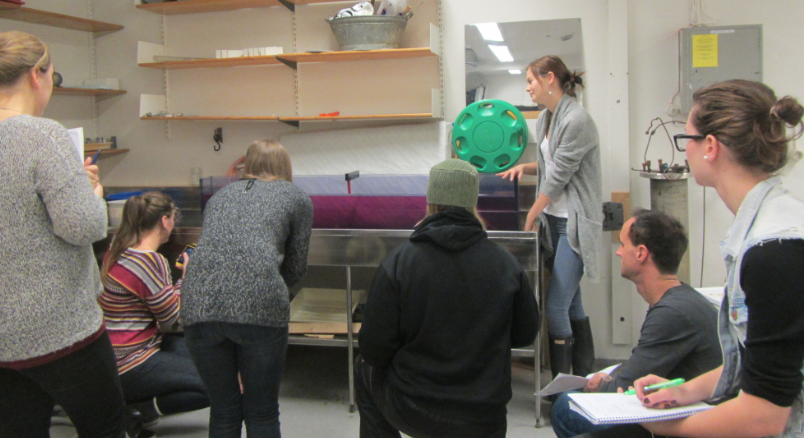
The movies below show the type of standing waves that are excited in the tank. This movie for 24 cm water depth (Ha – this is going to come back and haunt me! I’m not actually sure what the water depth in this experiment is. It looks like this is the case with the highest water level we have run. But if you want to know for sure go ahead, measure the period, calculate the phase velocity (the tank is 175 cm long) and then calculate the water depth. Good practice! ;-))

And then this movie shows the experiment with a lower water level (12 cm? 8? I don’t remember).

It’s interesting to see how much more difficult it is to excite a nice standing wave if you have less water in the tank. Intuitively that makes sense, but does anyone have a good, not-too-theoretical explanation?

Seesawing of standing waves.

Improving one of the experiments run in the GEOF130 lab.

One experiment that has been run in GEOF130 forever is the “standing wave”, where a wave is excited in a long and narrow tank and then, for different water depths, the period is measured and the velocity calculated in order to compare it to the one calculated from the shallow water wave equation.

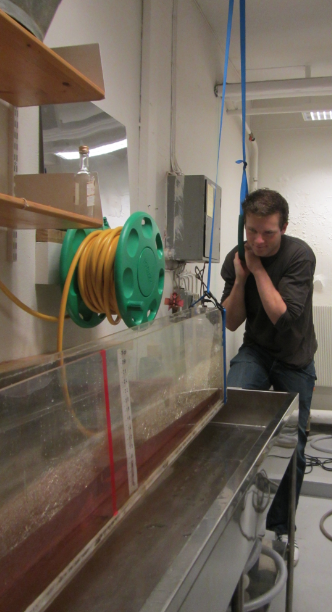
Traditionally, the standing wave is excited by lifting one end of the tank, letting the water settle down, and carefully putting the tank back down. This, however, means that someone has to lift a pretty heavy weight. So Pierre and I were quite proud of ourselves when we constructed a pulley system last year and now instead of lifting the weight up, someone could hang on a rope instead.

However, this was still hard work, and even though the picture shows a student doing the lifting, for most lab groups it was actually Pierre who did it.

But then this year, we came up with a much simpler solution and I don’t know how we didn’t see this before now. As Pierre remarked: We talk about seesawing standing waves ALL THE TIME. How did it not occur to us that the simplest setup would be a seesaw? So now we have two wooden blocks underneath the tank, one supporting it in the middle and one underneath the end where the operator is standing. So all that needs to happen now is a slight lift of the tank and then a slight downward push to bring it back in the horizontal.

So much easier!

Fjord circulation

Tank experiment on a typical circulation in a fjord.

Traditionally, a fjord circulation experiment has been done in GEOF130’s student practicals. Pierre and I recently met up to test-run the experiment before it will be run in this year’s course.

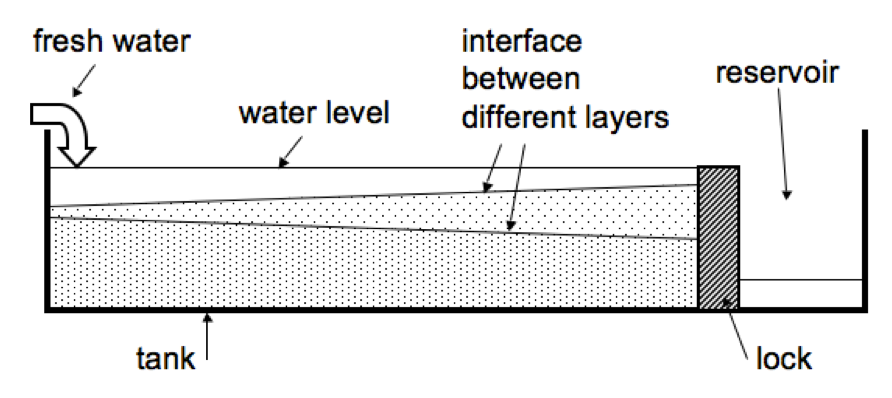
This is the setup of the experiment: A long and narrow tank, filled with salt water, a freshwater source at one end and an outlet at the other end. This sets up a circulation from the head towards the mouth of the fjord close to the surface, and a deep return flow.

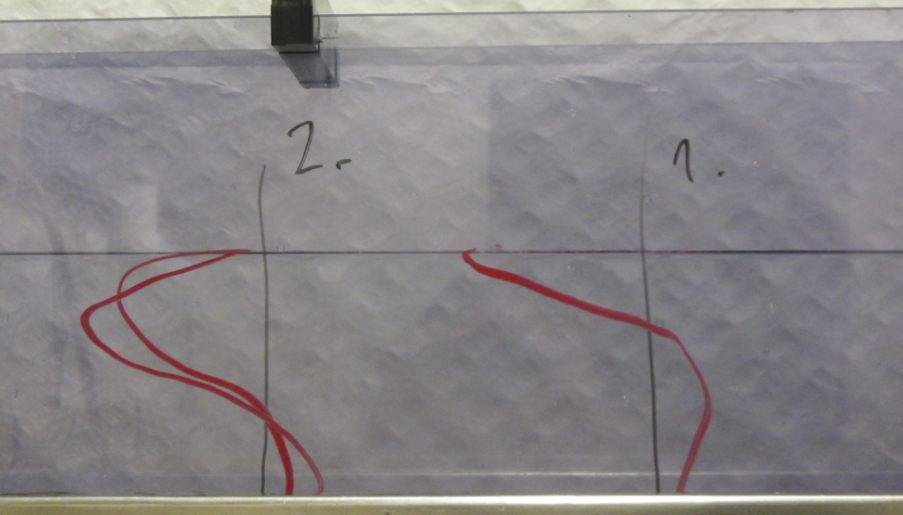
Watch the movie below to see how different circulations are set up depending on the depth of the freshwater source. As in the picture, velocity profile 1 is for the case where freshwater is being added close to the surface, and in case 2 the freshwater is being added deeper down.

Measuring salinity

Students evaporate water to measure the salinity of a water sample.

As described in this post, I like to have students build “instruments” to measure the most oceanographic properties (temperature, salinity and density). I find that they appreciate oceanographic data much more once they have first-hand experience with how difficult it is to design instruments and make sense of the readings. Today I’m presenting two groups that focused on salinity, while yesterday’s group was measuring density.

Students evaporate water to measure the salinity of a water sample.

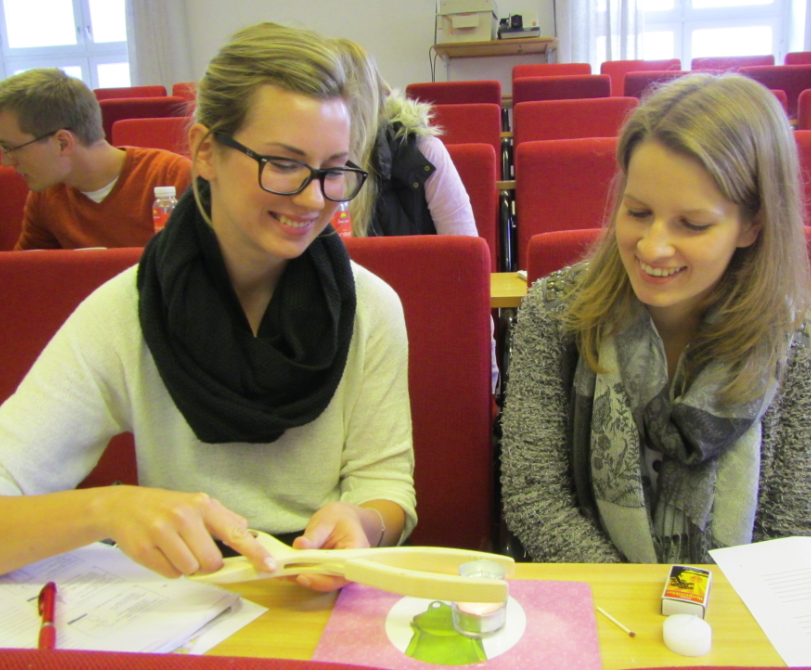
The students in the course I currently teach were determined to not only evaporate some water to qualitatively look at how much salt was dissolved in the sample, they wanted to do it right. So they set out to measure the vessel, the sample and the remaining salt. But since measuring salinity is really pretty difficult, they ran into a couple of problems. First – my scales were nowhere near good enough to measure the amount of water they could fit into the evaporation cup with any kind of precision. Second, even the amount of water that they could fit took a lot longer to evaporate (or even boil) than anticipated. Third, they realized that even though they could see salt residue in the end, this might not be all the salt that had been there in the beginning, plus there was grime accumulating at the base of the cup, so weighing the cup in the end might not be the best option. But they still learned a lot from that experiment: For example that once the (small quantity of) water was boiling, it became milky very quickly and then turned to crystallized salt almost instantly. Or that in order to use this method, a tea candle is not as suitable as a heat source as a lighter (and there might probably even be even better ones out there).

P.S.: In this course, none of the groups set the wooden tongs on fire! :-)

Heat capacity of air and water

Hands-on activity to better understand the concept and consequences of heat capacity. Also a great party trick.

Imagine you take a balloon. Any kind of normal balloon. You blow it up. You hold it over a candle flame. What do you think will happen?

Yes – it will burst pretty instantly.

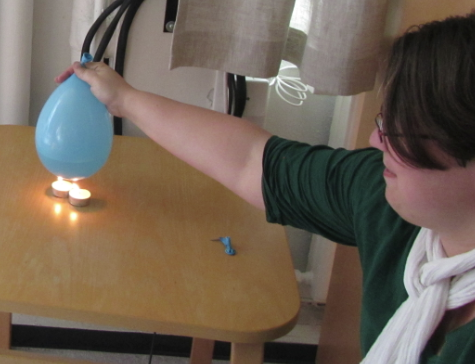
Now imagine you are taking a new balloon. You fill it with water (or, in our case, you fill it about half with water and half with air). You hold it over the flame. What will happen now?

You wait.

And wait.

And wait.

IMG_4469

Balloon, filled with water, being heated above a candle. Note the remnants of the previous balloon (the one that was just filled with air) on the table.

You even take a second candle.

You wait some more.

What happens? Nothing.

And why not? Because water has a much higher heat capacity than air. Meaning you have to put a lot of energy into a small volume of water to warm it up, about 4 times more than you would have to add to a similar volume of air. So the balloon does not get hot quickly, hence the plastic doesn’t get weakened enough for the balloon to burst. In fact, it did not only not get hot quickly, it did not get hot enough at all within the attention span of a typical student or instructor. So, because my students asked nicely, I decided to demonstrate what happens when the balloon is half filled with water, but the flame is directed to an area of the balloon that is not in direct contact with the water. If you can’t imagine what happens, check it out here (if you CAN imagine what happens, I’m sure you will check it out, too…).

MVI_4473

How to measure temperature, salinity and density

Three in-class experiments run in parallel. Great if you want to discuss how properties are measured and what kind of difficulties you might encounter.

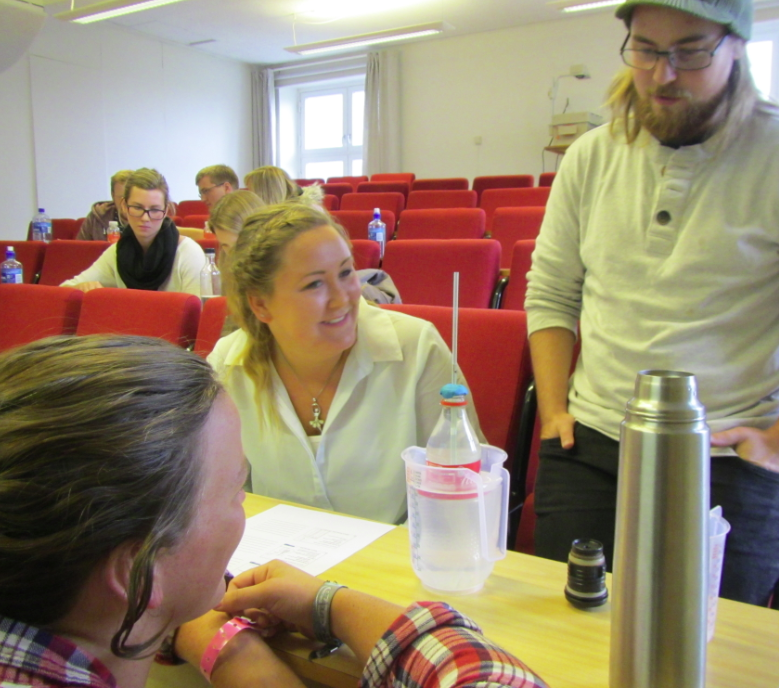
Temperature, salinity and density are the most important properties in physical oceanography. Measuring them with a CTD is easy. But can you, using basic household items, build instruments to measure those properties? My students can! And it’s also a great opportunity to discuss all kinds of issues with measuring in general, and these properties in particular.

Temperature? Easy! Use the thermal expansion of water! But then wait, does our half liter of water change the temperature of the sample while “measuring” its temperature? Also, how do we know the temperature of the sample if we don’t have a thermometer to begin with?

IMG_4456

A home-made thermometer

Salinity? Really easy! Just evaporate the water and weigh the remaining salt! But what if some of the salt evaporates with the water? What kind of constituents do we have in sea water?

IMG_4458

Sea water is being evaporated in order to investigate the remaining salt.

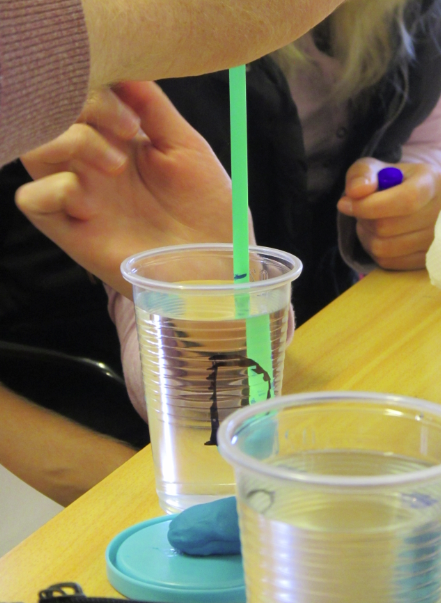
Density? Since we had our water samples from yesterday’s sea water tasting, all we had to do is find something that floats in sea water without submerging completely, and mark how deep it sinks in the different water samples! But then again, how do we know the density of our samples if we don’t know their temperatures and salinities because the other groups haven’t built those instruments yet? And even if they had, how would we be able to calculate density from it if we didn’t know the equation yet because it had not been established yet?

IMG_4465

Density probe being lifted from a sample.

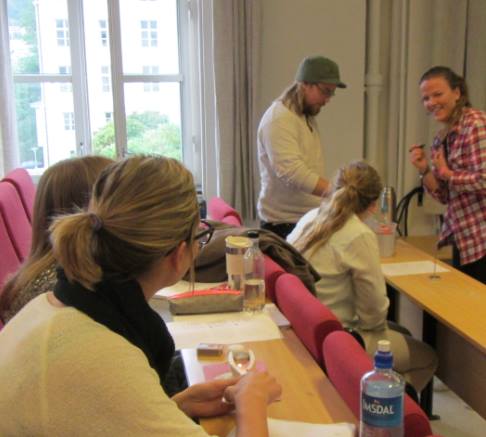
And what was the most difficult part? To stay focussed on your own experiment while there was cool stuff going on everywhere around you in the lecture theatre. As my office mate predicted: Someone will set the wooden tongs on fire!

messgeraete_bauen

Cool experiments going on everywhere you look!