Yep, I’ve been playing this weekend :-) After seeing this on Facebook a while back I just couldn’t resist… Enjoy! :-)
Category Archives: demonstration (easy)
Newton’s balls
Those are always fun! :-)
Again seen at Phaenomenta Flensburg.
Fictitious forces (2/5): Experiencing frames of reference on a playground
How can you be moving in one frame of reference, yet not moving in another?
We talked about the difficulty of different frames of reference recently, so today I want to show you a quick movie on how the seemingly paradox situation of moving in one frame of reference, yet not moving in another, can be experienced on a playground.
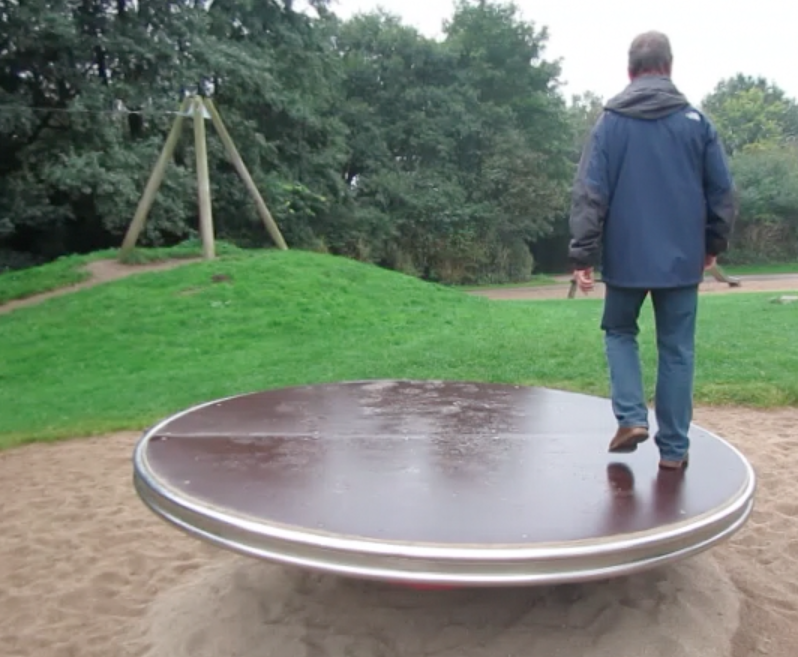
My dad on a playground rotator. Moving relative to the rotating disk, yet staying in the same spot relative to the playground.
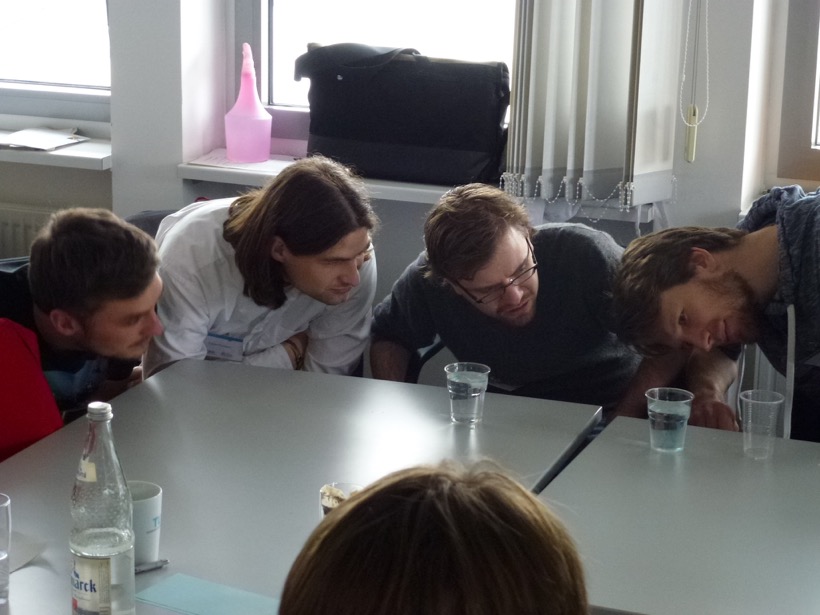
This is maybe not what you would do with a bunch of university students, but on the other hand – why not?
Fictitious forces (1/5): Record players and Coriolis deflection
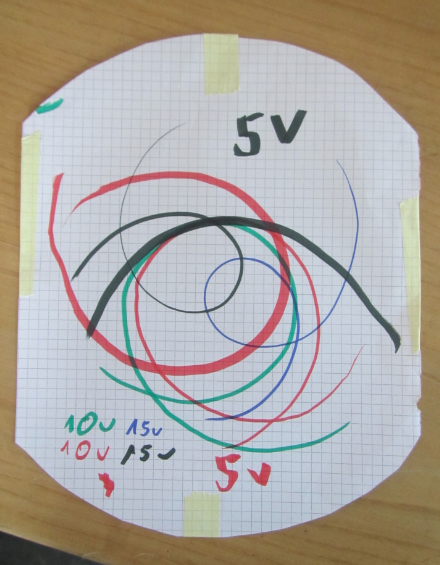
An experiment showing how seemingly straight trajectories can be transformed into curly ones.
One of the phenomena that are really not intuitive to understand are fictitious forces. Especially relevant in oceanography: The Coriolis force. The most difficult step in understanding the Coriolis force is accepting that whether or not a trajectory appears straight or curved can depend on the frame of reference it is observed from.
Or to say it with John Knauss in his Introduction to Physical Oceanography: “Even for those with considerable sophistication in physical concepts, one’s first introduction to the consequences of the Coriolis force often produces something analogous to intellectual trauma”.
One way to show that the apparent change of shape is really due to different frames of reference, is to take a trajectory that is objectively AND subjectively straight and watch it being transformed into something curly.
We did this at JuniorAkademie by taping a piece of paper on a record player, putting it into motion and then, at as constant a speed as possible, drawing along a ruler’s edge straight across. (if you don’t have a record player or rotating table at your disposal, you could also use a Lazy Susan and turn it as uniformly as possible).
Of course, this approach has a lot of potential pitfalls. For example, if you change the speed while you draw, you get kinks in your curls (as the child drawing in the video below points out when it happens). Also, by drawing on a flat paper rather than a spherical Earth, this isn’t completely equivalent to the Coriolis force.
And, more importantly, I think this experiment is only helpful for an audience that doesn’t “know” about fictitious forces yet. A problem we have experienced with oceanography students is that they “know” that moving objects should be deflected, and that they “see” a deflection even when there is none (for example when they are watching, from a non-rotating frame of reference, an object move across a rotating table). In that case, sliding the pen along the ruler might be perceived as forcing an otherwise curly trajectory to become a straight line, hence cheating by preventing a deflection that should occur.
Evaporating sea water
How much salt is there in sea water? What concentration do you need before crystals start forming? What will those crystals look like? I am sure those are the kind of questions that keep you awake at night!
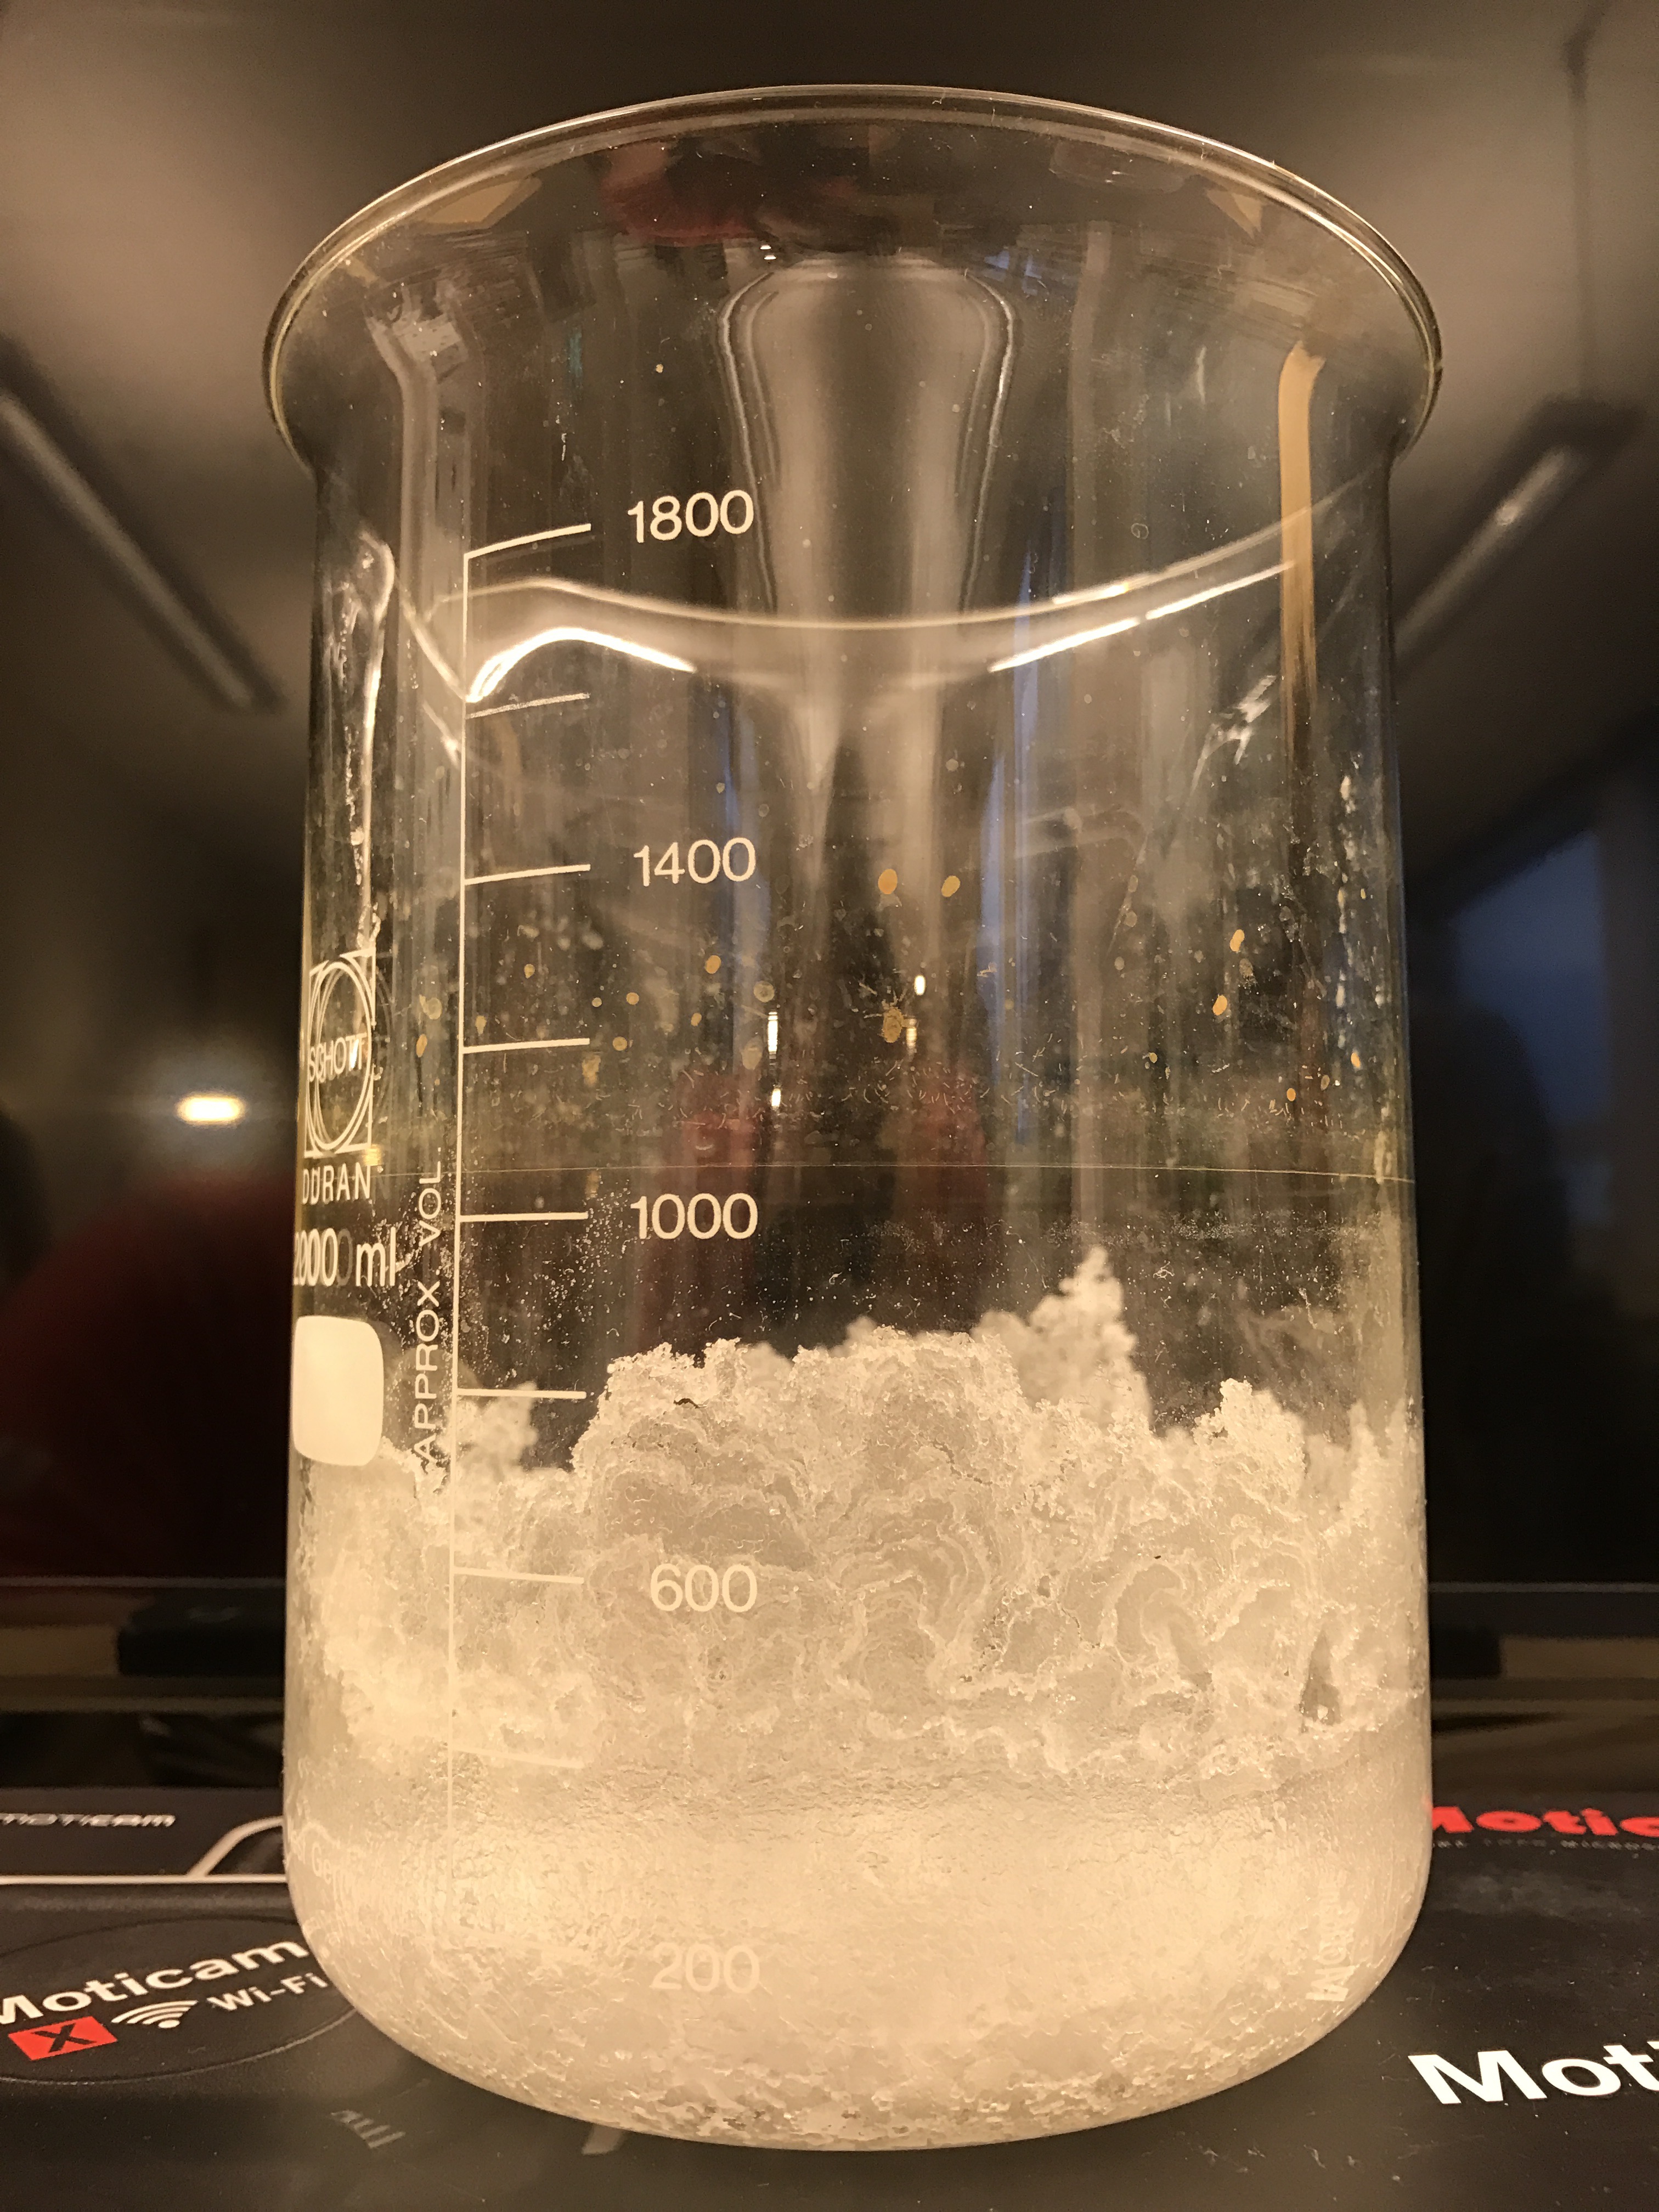
Of course this can easily assessed experimentally. On a visit to the University of Bergen’s Centre for Science Education just now, I was shown the result of such an experiment: A litre of water was mixed with 35 grams of salt to simulate sea water with its typical salinity. Below, you see what the beaker looked like after sitting out for three months.
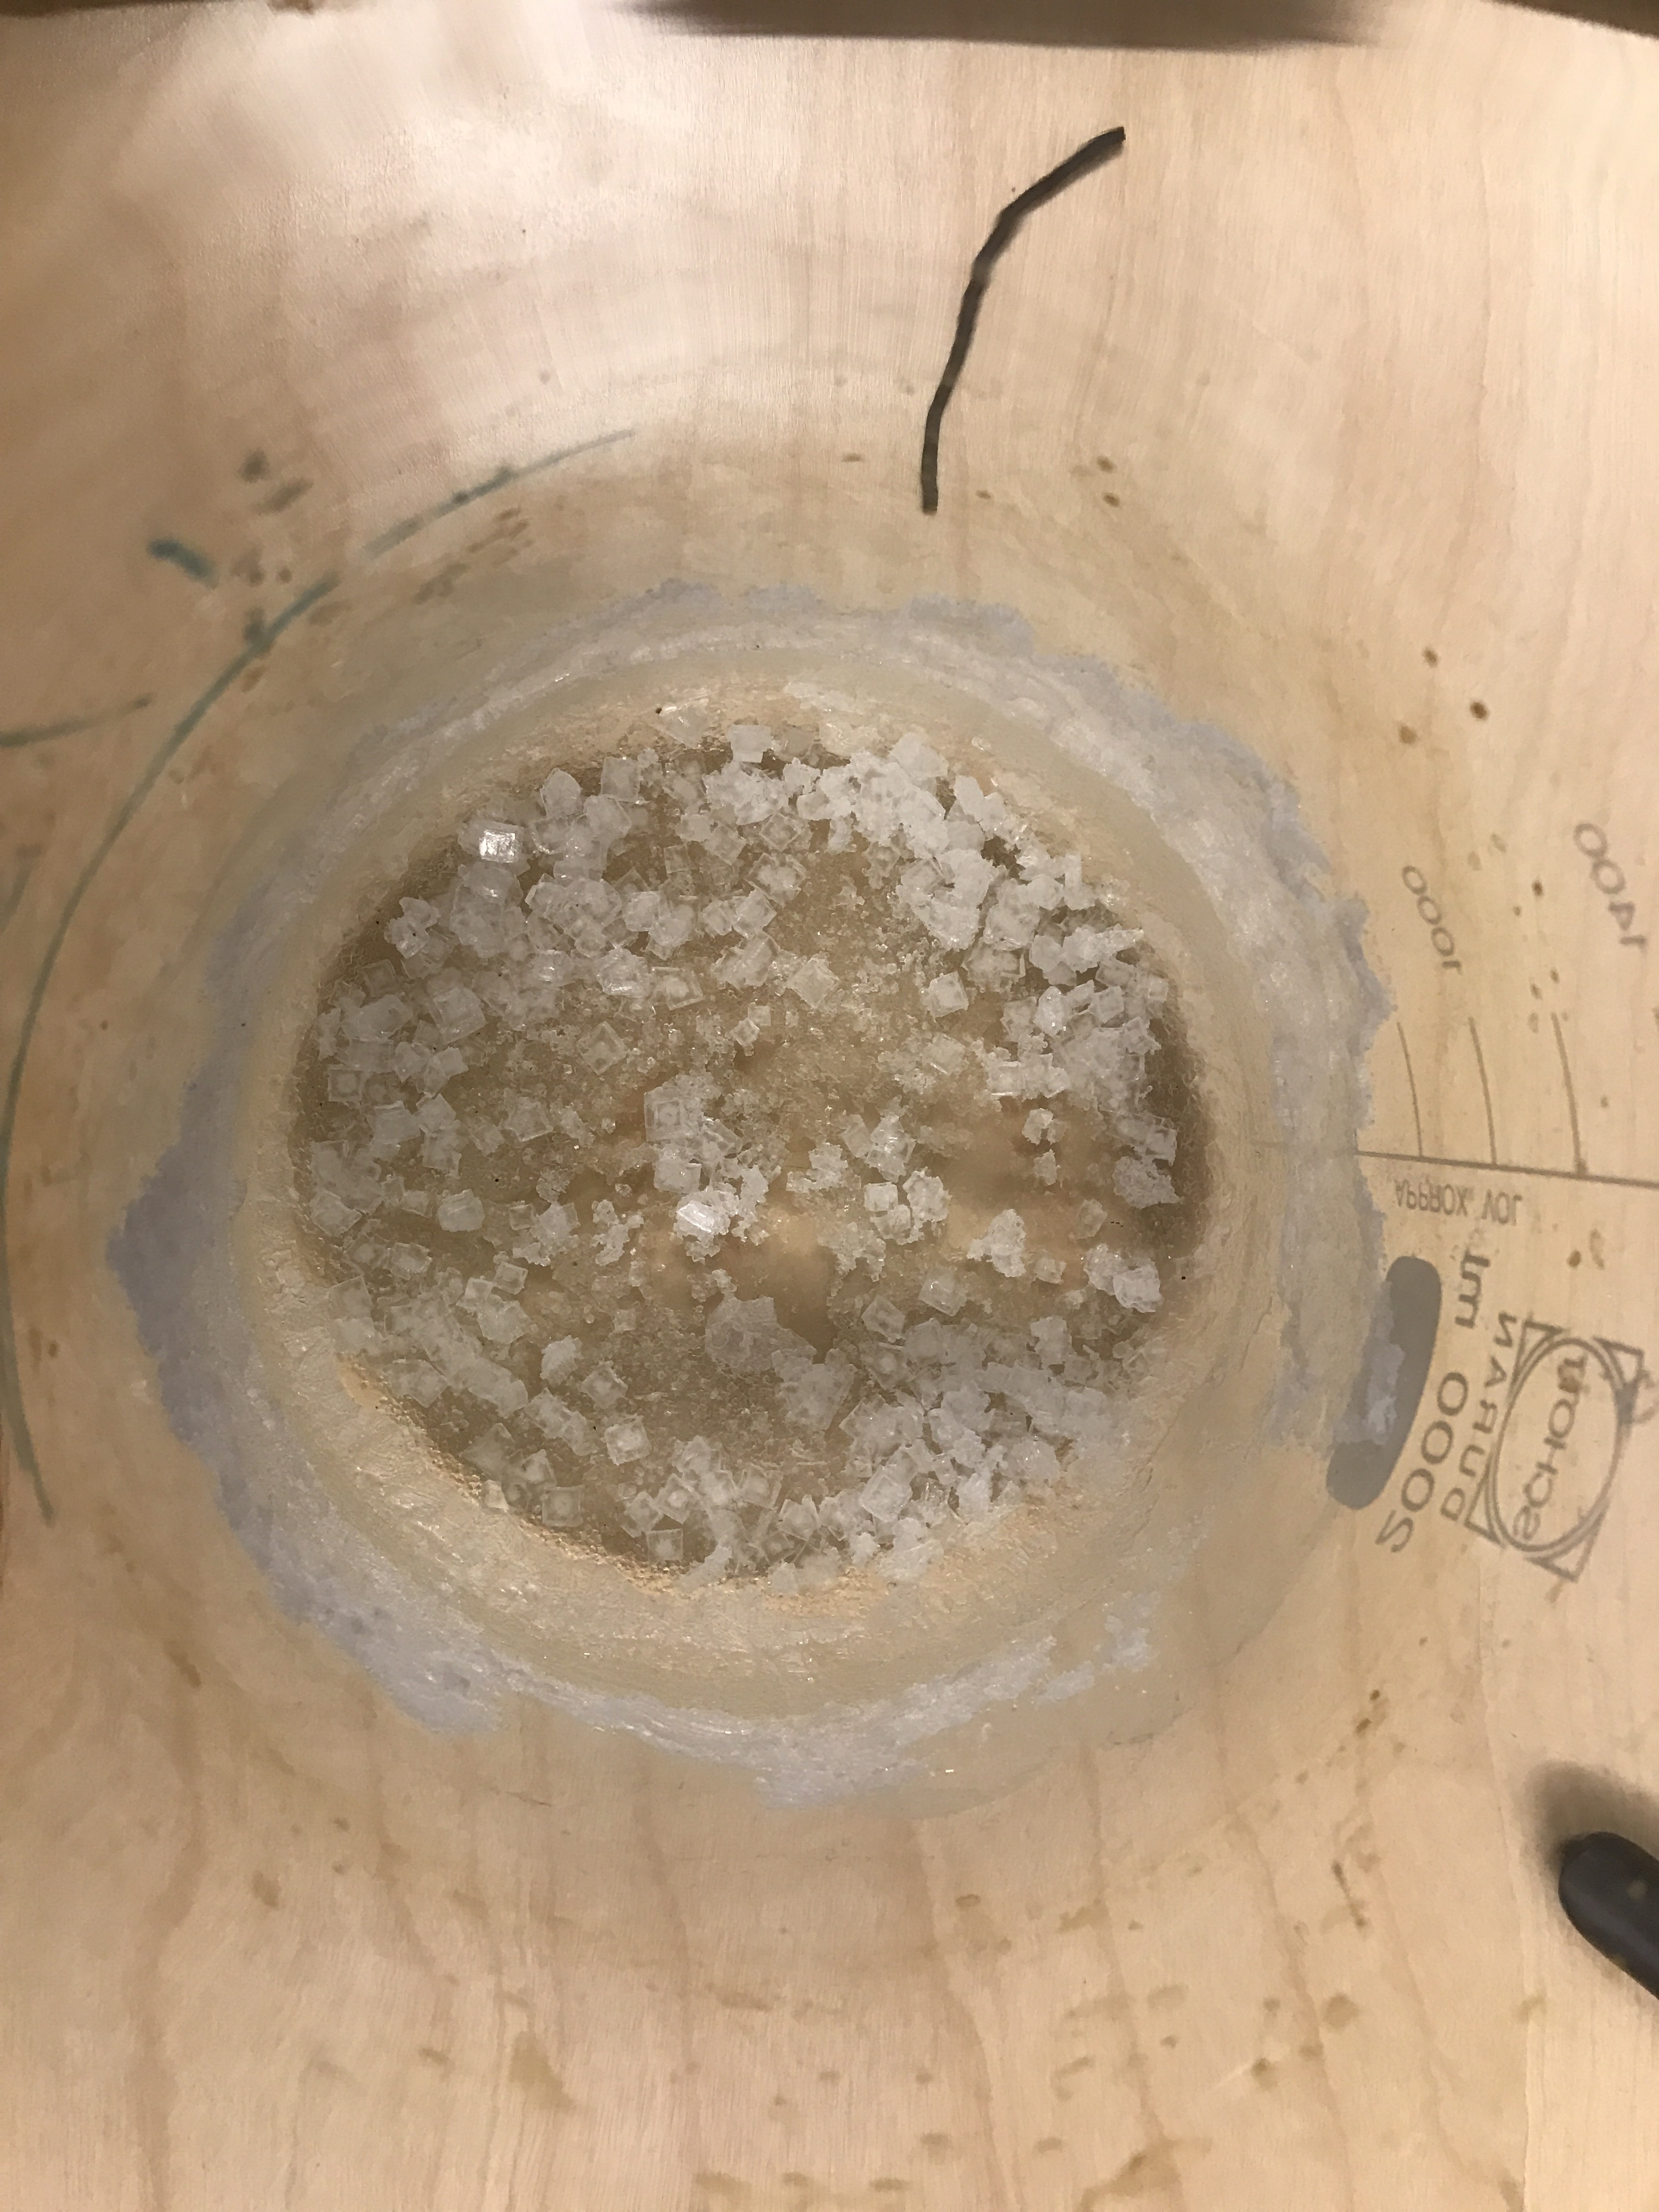
You can see that salt crystals are forming at the walls of the beaker, but that their structure depends on depth below the initial water level (see the 1000 ml mark on the beaker).
When there is still a lot of water in the beaker, crystals look like ornate flowers. Then, the less water is left in the beaker, the more square the crystals become. And at the bottom of the beaker, you see the typical salt crystals you would expect.
Actually, even though they look like the kind of salt crystals I would expect, apparently someone who knows about crystallography commented that there must be other stuff in there than just cooking salt since the crystals don’t look the way they should. I need to read up on this! :-)
Anyway, this is an experiment that I want to do myself, so maybe in three months time there will be more pictures of this!
Thanks for a very nice lunch, Olaug, Frede, Andreas, Morven and Elin! Looking forward to working with you a lot more in the future! :-)
P.S.: with this blog post I am testing to blog pretty much “real time” from my mobile phone, so if you notice anything odd, please let me know!
Taking the hydrostatic paradox to the next (water) level
How well do people understand hydrostatics? I am preparing a workshop for tomorrow night and I am getting very bored by the questions that I have been using to introduce clickers for quite a lot of workshops now. So I decided to use the hydrostatic paradox this time around.
The first question is the standard one: If you have a U-tube and water level is given on one side, then what is the water level like on the other side? We all know the typical student answer (that typically 25% of the students are convinced of!): On the wider side the water level has to be lower since a larger volume of water is heavier than the smaller volume on the other side.
Clearly, this is not the case:
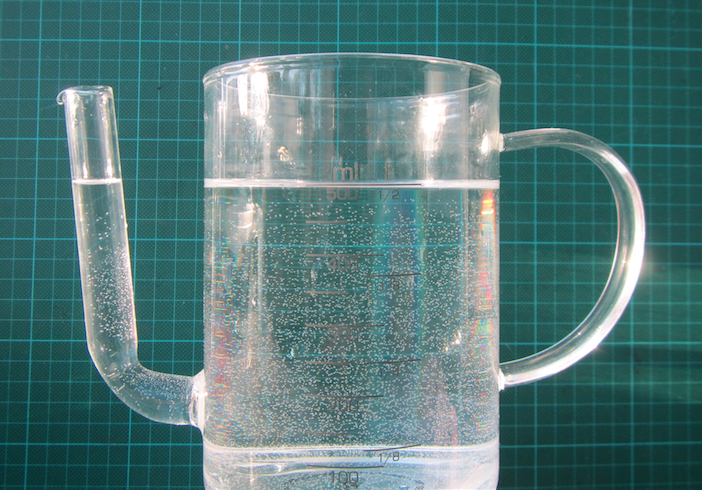
However, what happens if you use that fat separator jug the way it was intended to be used and fill it with two layers of different density (which is really what it is intended for: to separate fat from gravy! Your classical 2-layer system)?
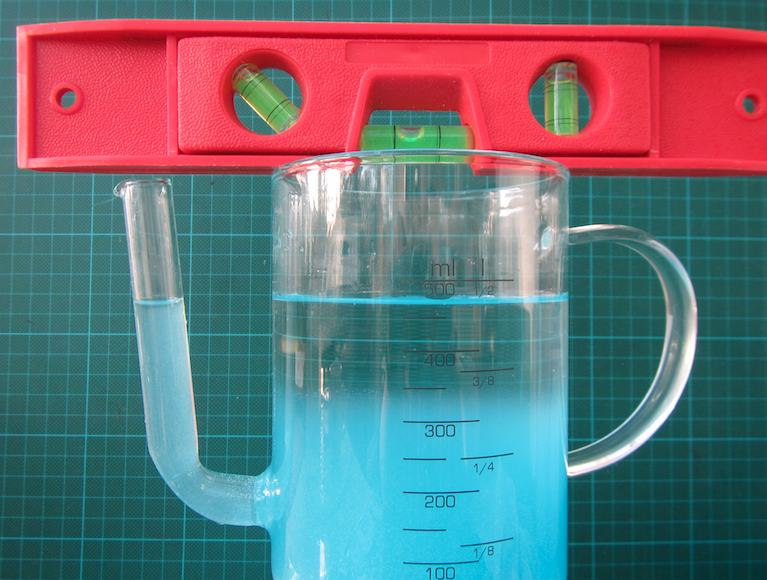
Turns out that now the two water levels in the main body of the jug and in the spout are not the same any more: Since we filled the dense water in through the spout, the spout is filled with dense water, as is the bottom part of the jug. Only the upper part of the jug now contains fresh water.
The difference in height is only maybe a millimetre, but it is there, and it is clearly visible:
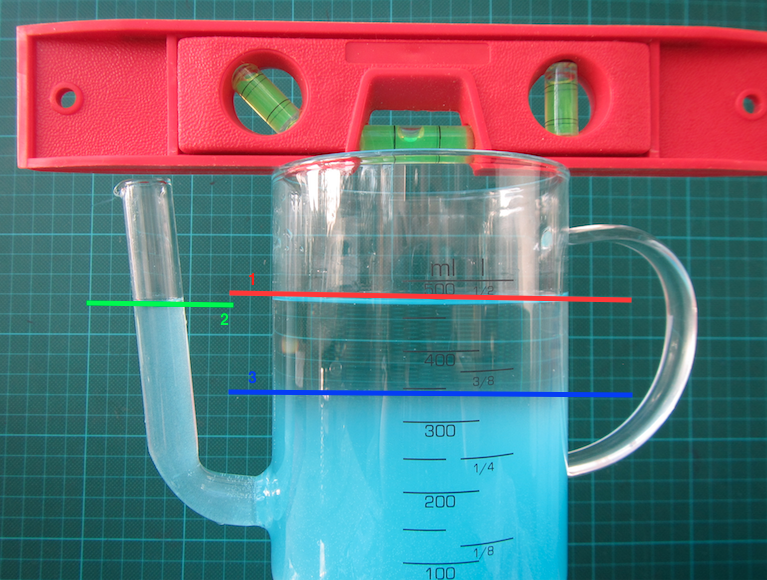
Water level 1 (red line) is the “main” water level, water level 2 (green line) is the water level in the spout and clearly different from 1, and water level 3 is the density interface.
We’ll see how well they’ll do tomorrow when I only give them levels 1 and 3, and ask them to put level 2 in. Obviously we are taking the hydrostatic paradox to the next (water) level here! :-)
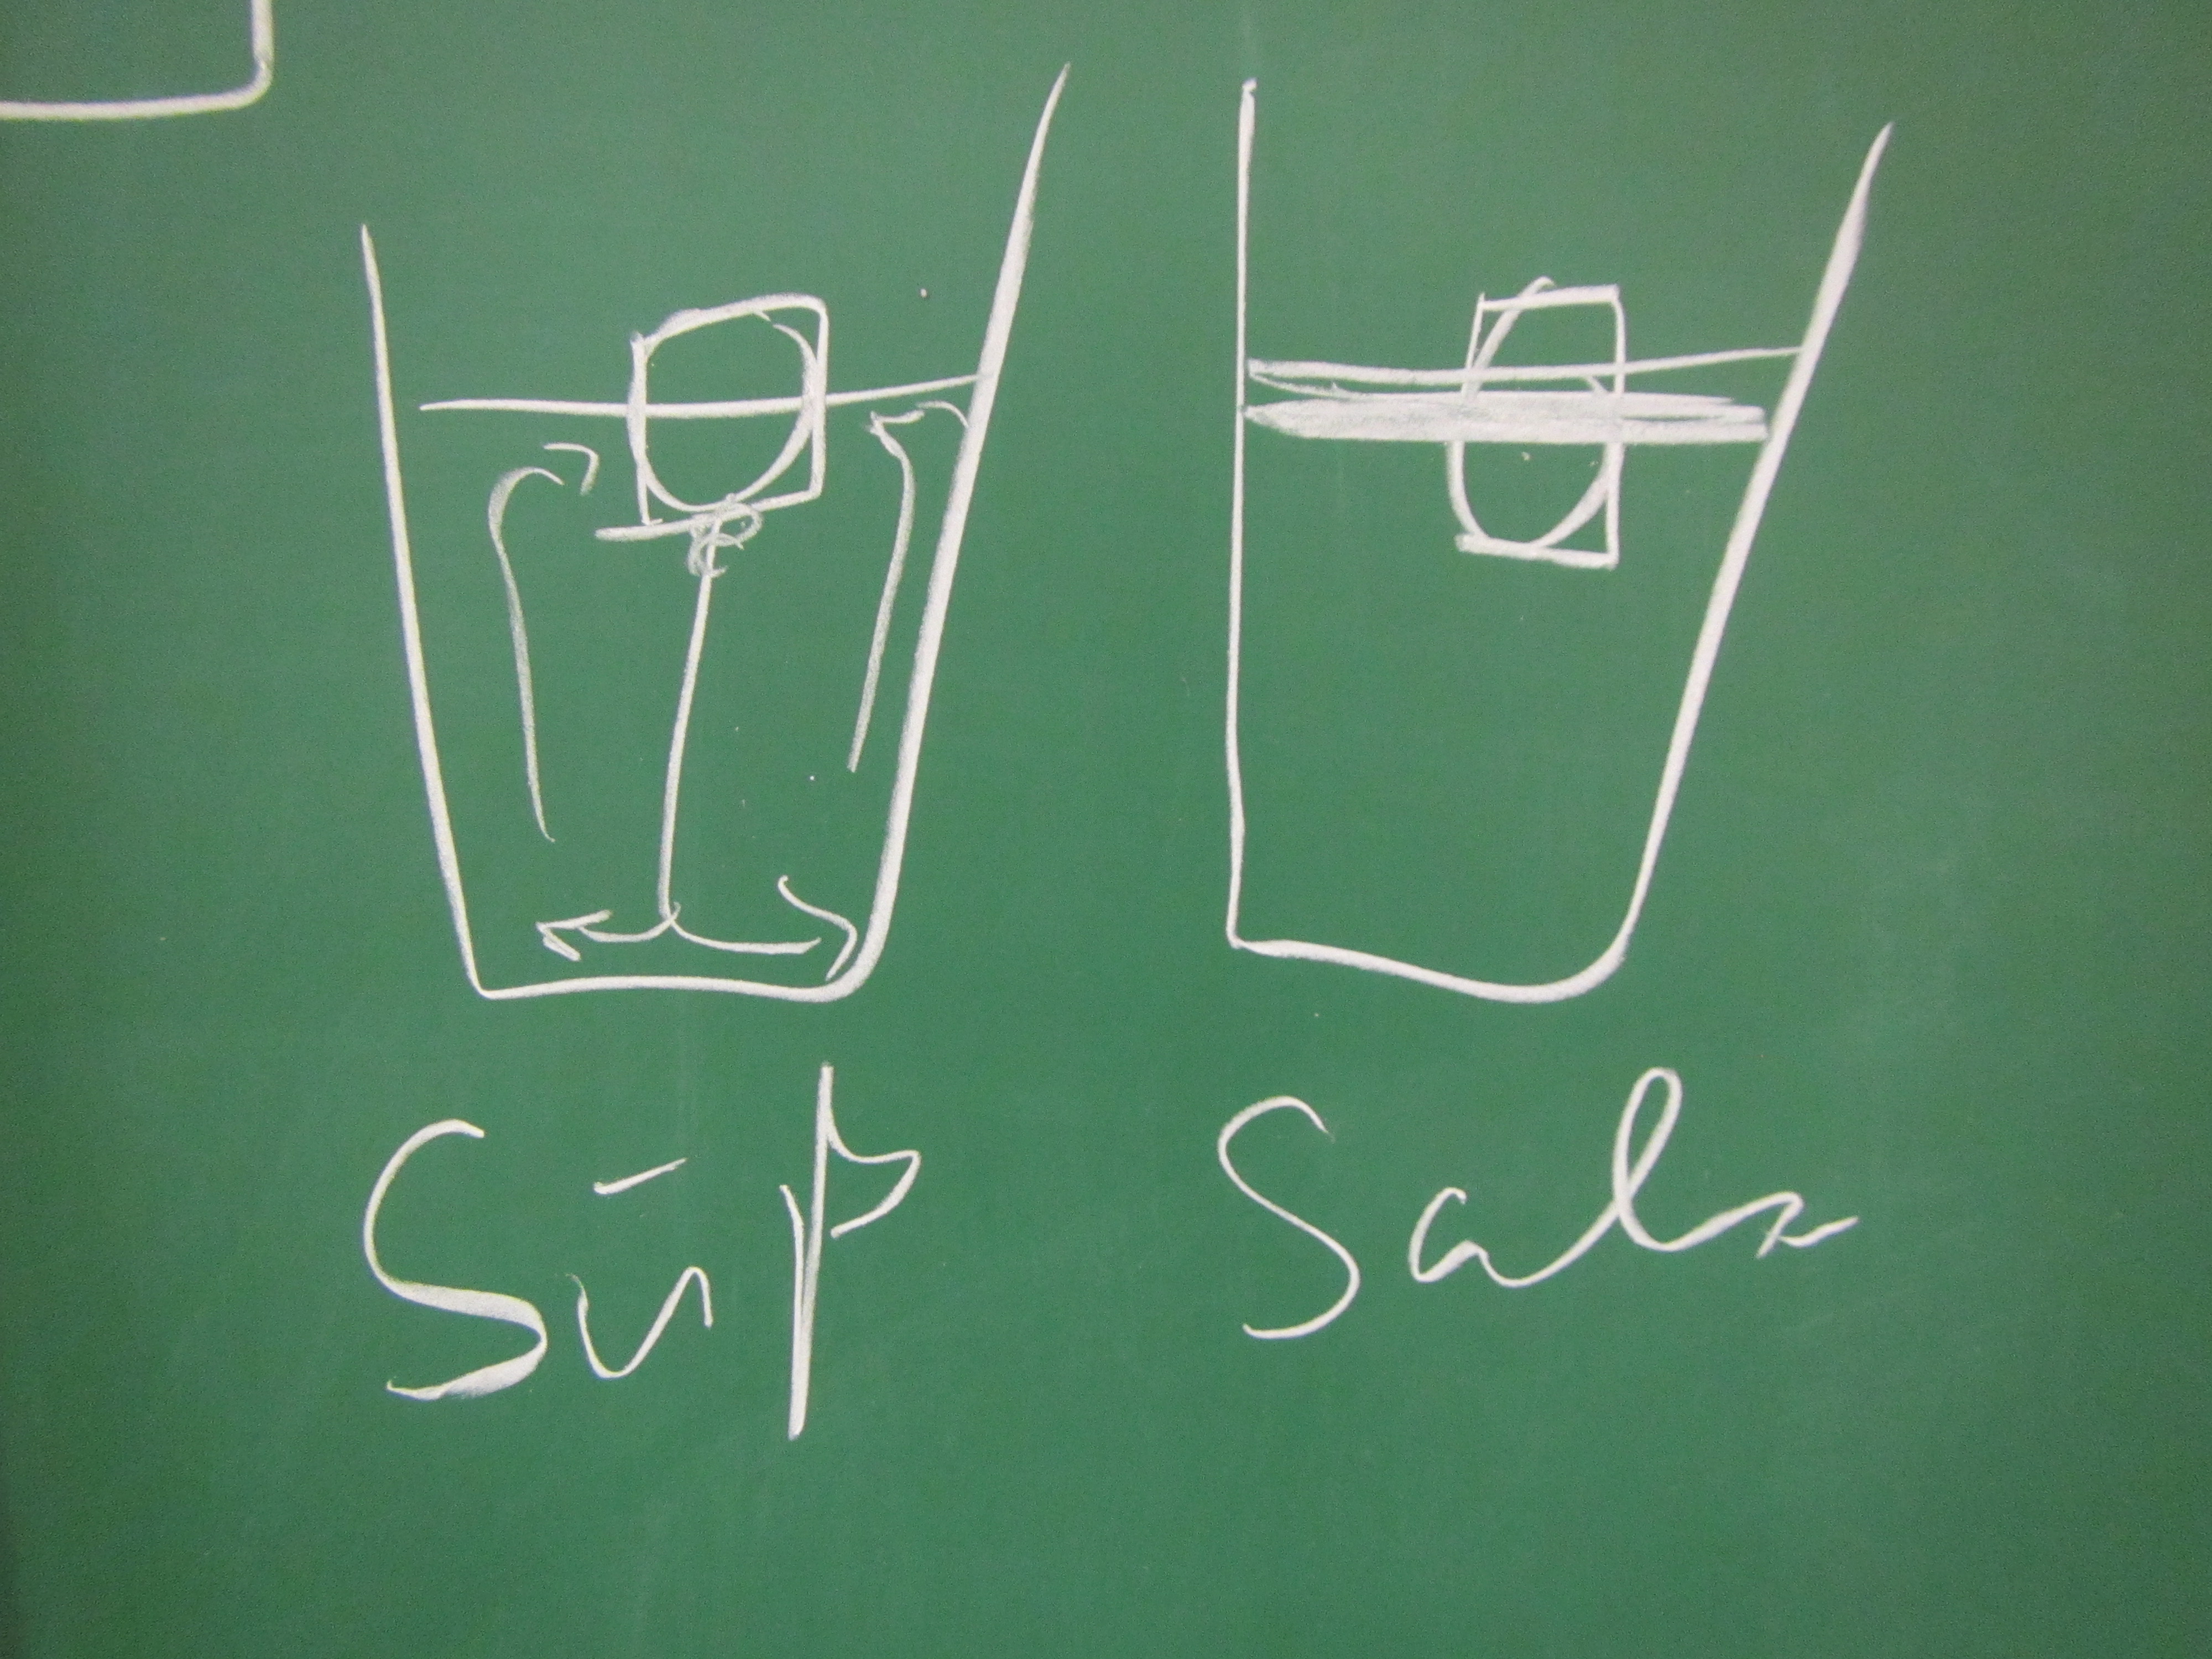
Using the “melting ice cube” experiment to let future instructors experience inquiry-based learning.
Using the “melting ice cube” experiment to let future instructors experience inquiry-based learning.
I recently (well, last year, but you know…) got the chance to fill in for a colleague and teach part of a workshop that prepares teaching staff for using inquiry-based learning in their own teaching. My part was to bring in an experiment and have the future instructors experience inquiry-based learning first hand.
So obviously I brought the ice cubes melting in fresh water and salt water experiment! (Check out that post to read my write-up of many different ways this experiment can be used, and what people can learn doing it). On that occasion the most interesting thing for me was that when we talked about why one could use this — or a similar — experiment in teaching, people mainly focussed on the group aspect of doing this experiment: How people had to work together in a team, agree to use the same language and notation (writing “density of water at temperature zero degree Celsius” in some short syntax is not easy when you are not an oceanographer!).
And this experiment never fails to deliver:
- you can be 100% sure that at least in one group, someone will say “oh wait, which was the salt water again?” which hands you on a plate the opportunity to say “see — this is a great experiment to use when talking about why we need to write good documentation already while we are doing the experiment!”
- you can also be 100% sure that in that group, someone will taste the water to make sure they know which cup contains the salt water. Which lets you say your “see — perfect experiment to talk about lab safety stuff! Never ever put things in your mouth in a lab!”
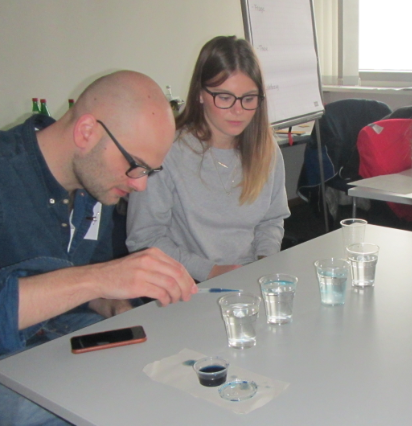
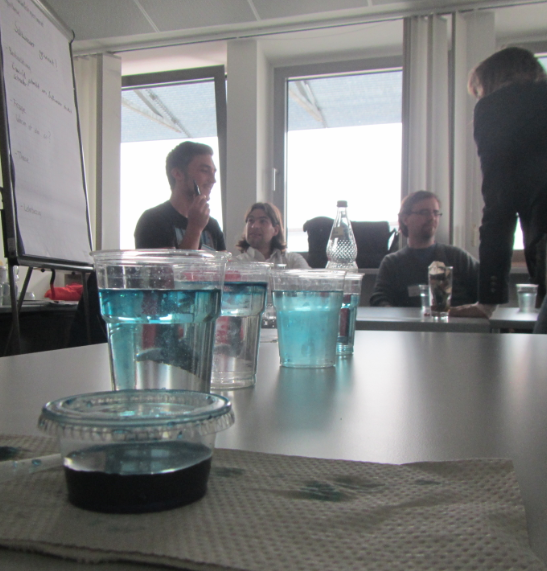
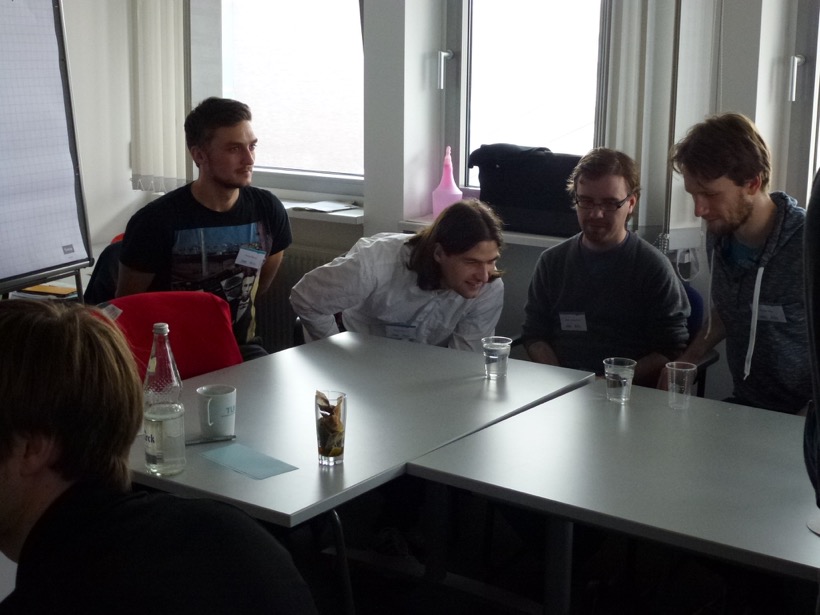
- you can also be sure, that people come up with new experiments they want to try. At EMSEA14, people asked what would happen if the ice cubes were at the bottom of the beaker. Today, people asked what the dye would do if there was no ice in the cups, just salt water and fresh water. Perfect opportunity to say “try! Then you’ll know! And btw — isn’t this experiment perfect to inspire the spirit of research (or however you would say that in English – “Forschergeist” is what I mean!). This is what you see in the pictures in this blog post.
So yeah. Still one of my favorite experiments, and I LOVE watching people discover the fascination of a little water, ice, salt and food dye :-)
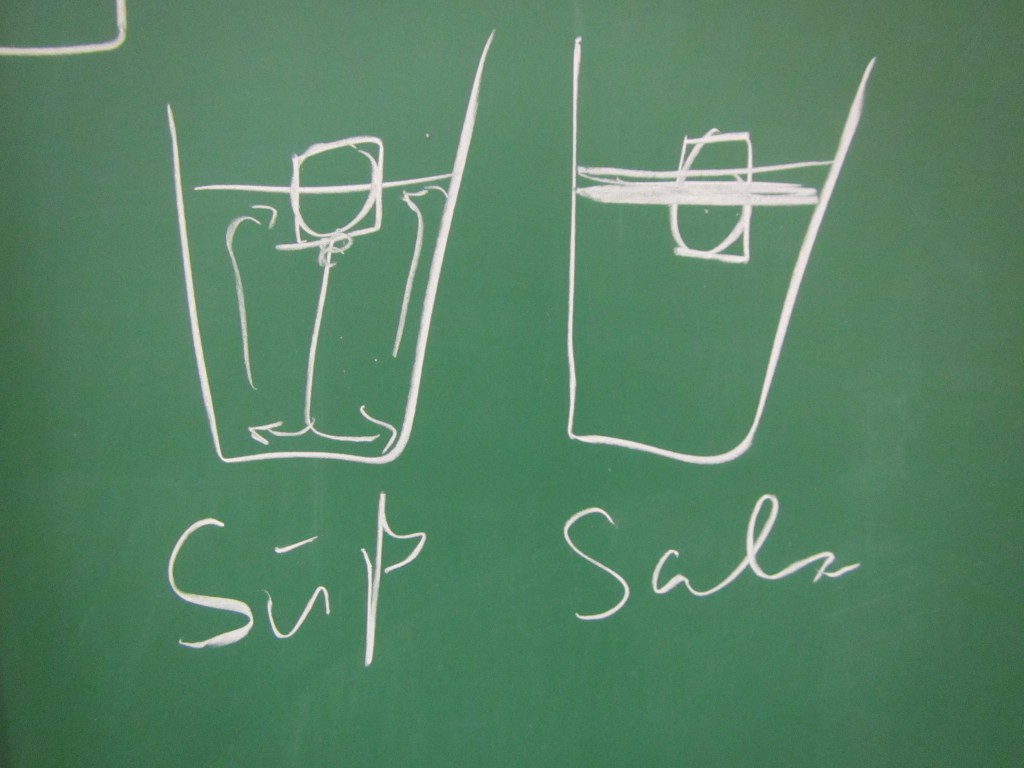
Btw, when I gave a workshop on active learning last week and mentioned this experiment, people got really really hooked, too, so I’ll leave you with a drawing that I liked:
Making a spinningtop from a metal paper clip
One of my favourite memories of my physics classes at university is of the day when the professor brought in metal paper clips for everybody — to make spinning tops!
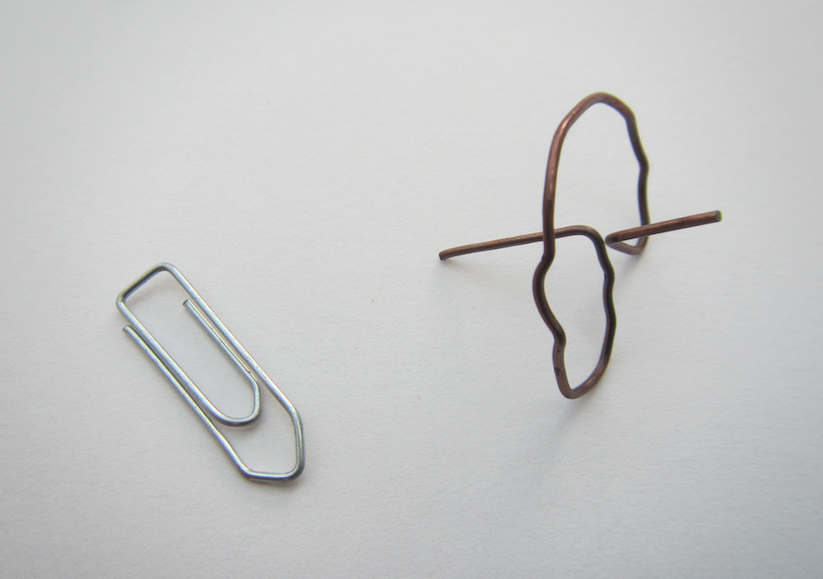
When we were playing with the drawing spinning top recently, my mom brought back the paper clip one that I had made some 15 years ago! How is that for a well-organized collection of experimental materials? :-)
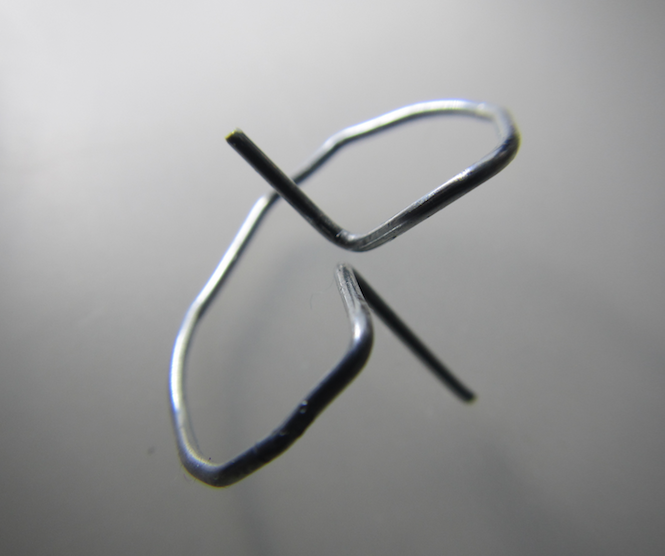
So here is what you do: You unfold the paper clip and turn it into a spinning top! Easy peasy. And if you are keen on all the physics, you can even calculate the angle between the spokes going out from the central axis! 53° or something close is what I remember (and it is confirmed by a quick google search, too). The trick is that the center of gravity has to lie on the rotating axis in the center of the wire that goes around.
If you want to do this with your students, be nice and hand out the plastic-coated paper clips, they are usually easier to bend. But even with a very imperfect circle and bends that aren’t very sharp or precise, these spinning tops run surprisingly well!
Spinningtop trajectories
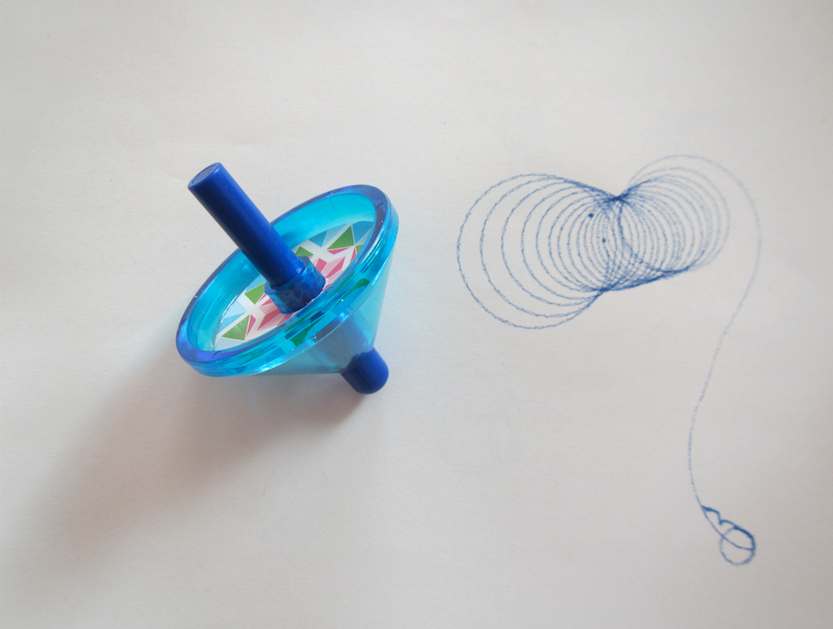
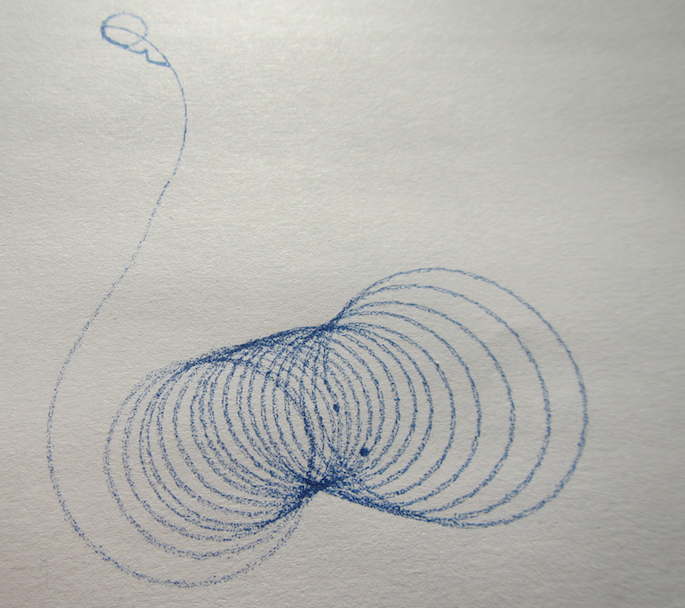
A new physics toy in my house: A spinning top that has a pen as its tip and leaves trajectories as it spins!
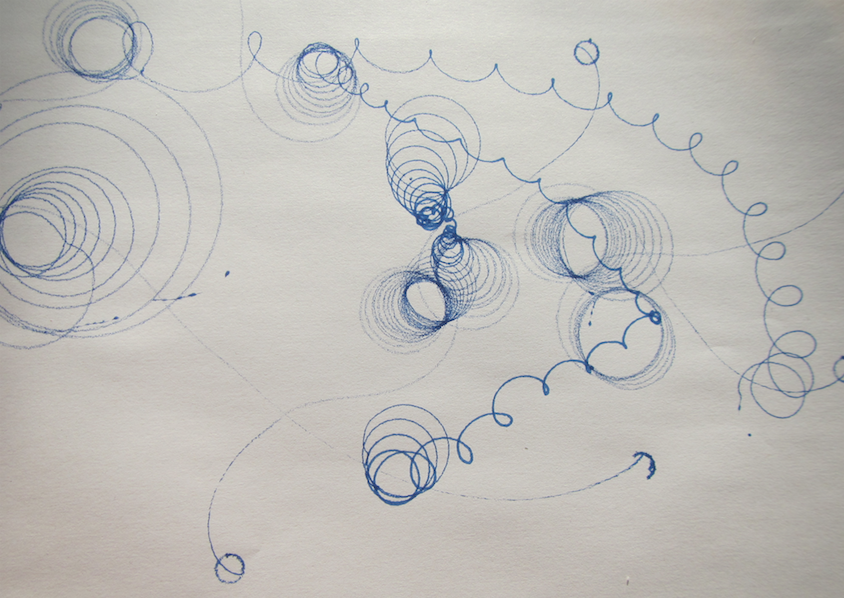
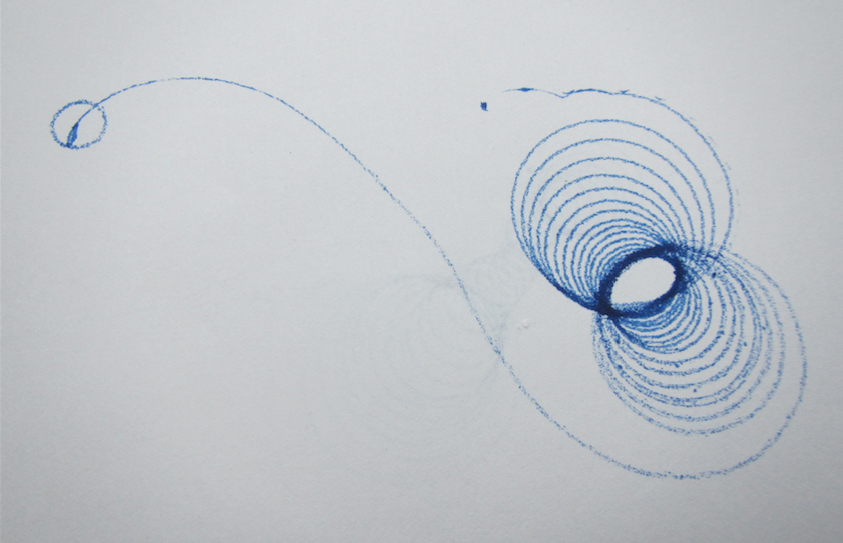
The trajectories are really cool. Depending on how you spin the spinning top, they look really different. But they all have a common feature: When the spinning top has slowed down, they end in a long swivel away from all the neat spirals, and in the very end they have the small circle as seen in the top left corner of the picture below.
See? The radius of that circle is given by the distance from the tip of the pen to the point on which the spinningtop rests, hence it is the same for all the trajectories. But the rest? The trajectories that are really drawn out were those where the tray on which we were drawing was slowly tilted, so they went away from their point of origin, trying to go downhill.
Now if you don’t have such a spinning top, don’t despair. Use the stub of an old pencil (or of one from your favourite Swedish furniture place), pierce it, tip down, through a circular piece of cardboard, and there you go: Your drawing spinning top is ready!
Watch the movie at the bottom of this post to see this trajectory forming:
When water doesn’t seek its level
Last week we talked about misconceptions related to hydrostatic pressure, and how water always seeks its level. Today I’m gonna show you circumstances in which this is actually not the case!
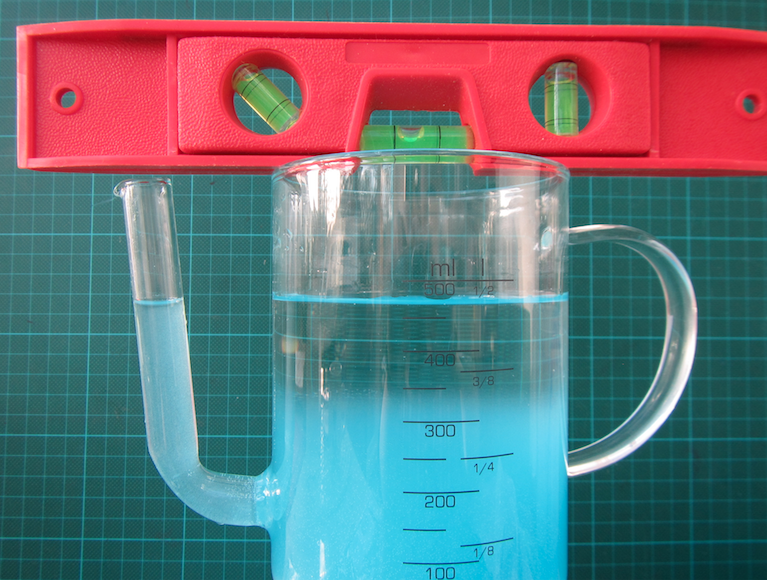
We take the fat separator jug we used last week. Today, it is filled with fresh water, to which we add very salty water through the jug’s spout. What is going to happen? Watch the movie and find out!
Turns out that now the two water levels in the main body of the jug and in the spout are not the same any more: Since we filled the dense water in through the spout, the spout is filled with dense water, as is the bottom part of the jug. Only the upper part of the jug now contains fresh water.
The difference in height is only maybe a millimetre, but it is there, and it is clearly visible.
Do you see the opportunities for discussions this experiment provides? If we knew the exact volumes of fresh water and salt water, and the exact salinity, we could measure the difference in height of the water levels and try to figure out how much mixing must have taken place when the fresh water was added to the jug. Or we could use the difference in height to try and calculate the density difference between fresh water and salt water and then from that calculate salinity. So many possibilities! :-)
