Tag Archives: overturning

Overturning experiment. By Mirjam S. Glessmer

A very simple overturning experiment for outreach and teaching

For one of my side-projects I needed higher-resolution photos of the overturning experiment, so I had to redo it. Figured I’d share them with you, too.

You know the experiment: gel pads for sports injuries, one hot (here on the left), one cold (here on the right). Blue dye on the cold pad to mark the cold water, red dye on the warm pad as a tracer for warm water.

overturning

Thermally-driven overturning circulation: Warm water flowing near the surface from the warm pad on the left towards the right, cold flow from the cool pad at the bottom right to left.

A circulation develops. If you drop dye crystals in the tank, the ribbon that formed gets deformed by the currents for yet another visualization of the flow field.

overturning2

Thermally-driven overturning circulation. In the middle of the tank you see a ribbon of dye, caused by falling dye crystals, being transformed by the currents in the tank.

Lighting is a problem this time of year. I chose natural light over artificial, and it came out ok, I think.

And here is the video:

Thermally-driven overturning circulation

Cooling on one end of the tank, heating on the other: A temperature-driven overturning. [deutscher Text unten]

Always one of my favorite experiments – the overturning experiment (and more, and more).

IMG_8467

Final preparations. – Letzte Vorbereitungen

Unsere “Klima und Strömungen”-Gruppe hat heute ausprobiert, wie man in einem Tank eine Umwälzströmung erzeugen kann, indem man an einem Ende wärmt und am anderen Ende kühlt. Einige Versuche waren nötig, bis das Experiment perfektioniert war: Am Anfang fehlte die Wärmequelle am einen Ende, was aber erst auffiel als das kalte Wasser am Boden schon das Ende erreicht hatte. Dann war die Wärmequelle zwar vorhanden, aber von außen am Plexiglastank angebracht.

IMG_8482

Warm red surface current, cold blue deep current. – Warme rote Oberflächenströmung, kalte blaue Tiefenströmung.

Letztendlich wurden ein rotes Wärmepack erhitzt und ein blaues Kühlpack eingefroren, und beide in den Tank gesteckt. Und voila! Eine tolle Zirkulation!

Ganz gegen Ende des Experiments haben wir dann noch Farbkristalle in den Tank fallen lassen, und wie man im Bild unten sehen kann, sind die super, um die Zirkulation zu visualisieren. Aus den anfangs senkrechten Streifen formt sich schnell ein Strömungsprofil: Am Boden von kalt nach warm (links nach rechts) und an der Oberfläche in die entgegengesetzte Richtung.

IMG_8499

Dye streaks as circulation tracers. – Blaue Farbstreifen, um die Zirkulation zu verdeutlichen.

Und wenn man ganz genau hinschaut: Salzfinger! :-)

An overturning experiment (part 3)

By popular demand: A step-by-step description of the overturning experiment discussed here and here.

I wrote this description a while ago and can’t be bothered to transfer it into the blog format, so please go and find a .pdf here. This .pdf addresses young children in the first part, and grown-ups in the second part.

Have fun and if you use this in school or with your own kid, please let me know how it went! I love to hear from my readers! :-)


An overturning experiment (part 2)

How to adapt the same experiment to different levels of prior knowledge.

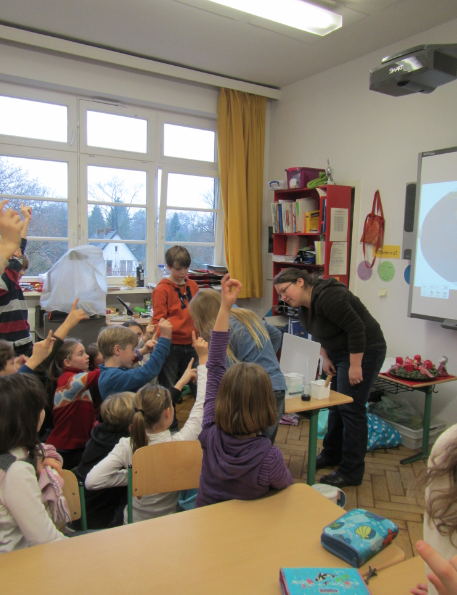
In this post, I presented an experiment that I have run in a primary school, with high-school pupils, in a Bachelor-level course and in a Master-level course. The experiment itself was run identically in all cases. However, the introductions, explanations and discussions about it obviously differed.

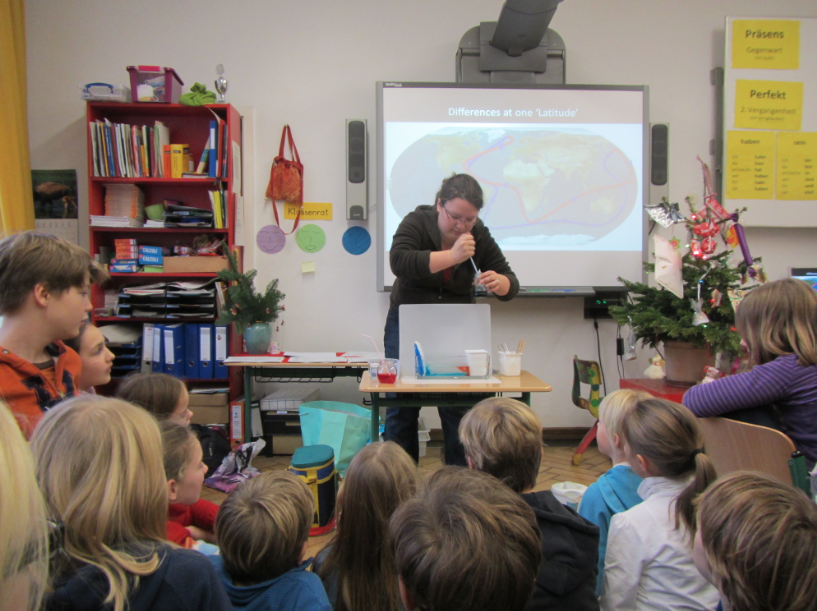
For example, in the primary school, I introduced this experiment by showing pictures of lions and penguins and other animals that the pupils knew live in warm or cold climates, and we talked about where those animals live. In the end this aimed at how temperatures are a lot colder at the poles than at the equator. This is the differential heating we need for this experiment to work. While this is something that I felt the need to talk about with the primary school kids, this can be assumed as a given with older students (or at least that is the assumption that I made).

With the university-level courses, one of the points that I made sure came up during the discussion are the limitations of this model. For example that we apply both heating and cooling over the full depth of the water column. How realistic is that? Or the fact that we heat at one end and cool at the other, rather than cooling on either end and heating in the middle?

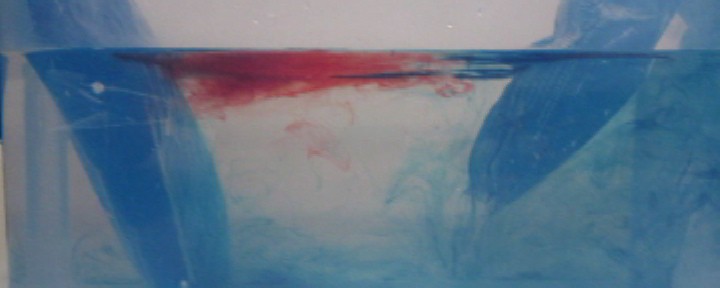
With the university-level courses, we could also discuss other features that we could see during the experiment. Remember this image, for example?

IMG_3214

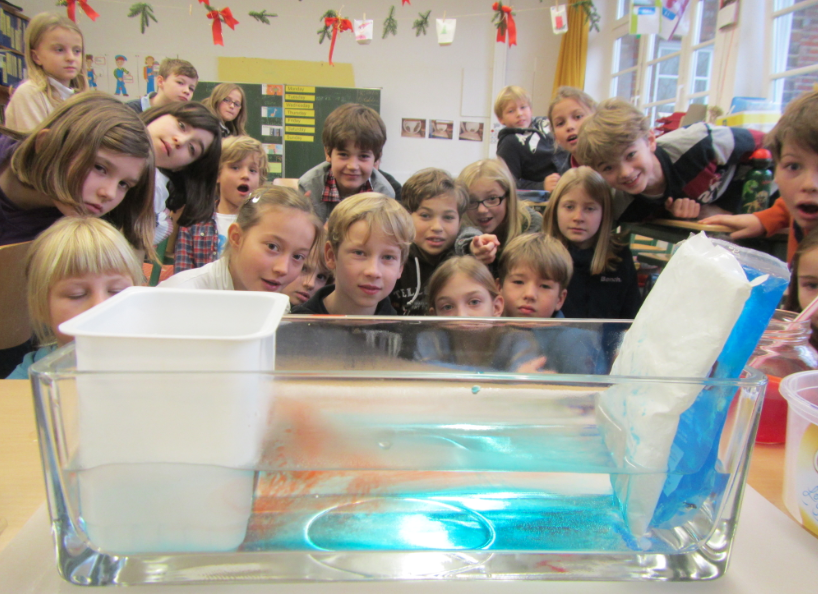
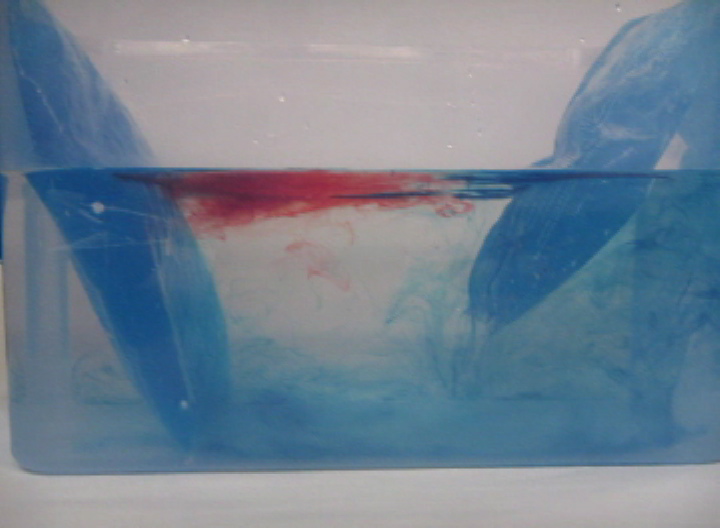
The thermal conveyor belt experiment.

Let me zoom in on something.

IMG_3214_2

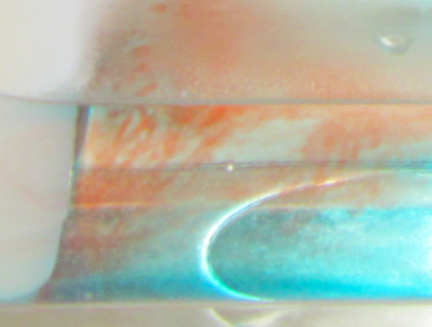
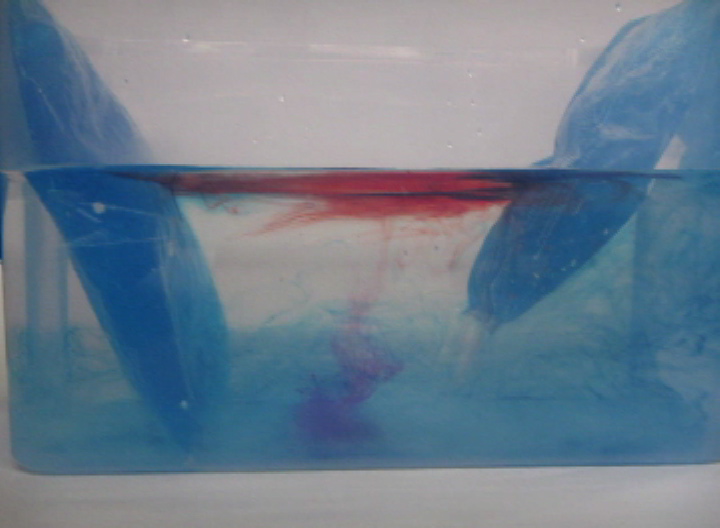
Curious features in the thermal conveyor experiment. Do you know what this is about?

Do you see these weird red filaments? Do you think they are a realistic part of the thermal circulation if it was scaled up to a global scale?

Of course not. What we see here is salt fingering (oh, and did you guys notice that a diagram of how salt fingering works is displayed at the very top left of my header? I wasn’t exaggerating when I said that it was my favorite process ever!). So basically, this is a process that is caused by the different diffusivities of heat and of the red dye. And while it is pretty large scale in our small tank, you cannot scale it up just like that when talking about the real ocean. And it is also really difficult to get rid of salt fingers for this experiment, in fact I haven’t yet managed. But I am open to suggestions! :-)

Another point that I would talk about with university-level students that I would probably not bring up with primary school kids (- although, why not if I had more time than just those 45 minutes per class?) is that ocean circulation is driven by more than just differential heating. Even when just considering the density-driven circulation, that is additionally influenced by changes in salinity. Put that together with wind-driven circulation and we are starting to talk about a whole new level of complicated…

But anyway. My point is that even primary school kids can benefit from doing this kind of experiments, even if what they take away from the experiments is not exactly the same as what older students would take away.

One of the main messages the primary school kids got seems to have been that you need to take curd cheese beakers for your warming element (look here for some reports (in german)). Not exactly my main message, but at least they were very observant of how the experimental setup was designed ;-)

An overturning experiment

A simple experiment that shows how the large-scale thermally-driven ocean circulation works.

Someone recently asked me whether I had ideas for experiments for her course in ocean sciences for non-majors. Since most of the experiments I’ve been showing on this blog were run in the context of Bachelor or Master oceanography-major courses, she didn’t think that the experiments were as easily transferable to other settings as I had claimed.

So here is proof: You can do pretty complex experiments with non-university level students. To prove my point, let’s go to a primary school.

IMG_3219

Experimenting with a primary school class.

The experiment we are running here is the global (thermal) conveyor belt. In a long and narrow tank filled with water, a heating and a cooling element are inserted at either end. Dye is added onto the elements to visualize the flow of water.

IMG_3212

Adding dye to visualize the thermally driven flow in the tank.

In the image above you see that there is something blue near the bottom of the tank, and I am adding red dye to the other side. Blue is used to track the cold water and red to track the warm water (intuitive color-coding goes a long way, no matter how old your students are!)

IMG_3214

The experiment as seen by the teacher.

What you see here is the cold blue water sinking to the bottom of the tank and spreading, and the warm red water rising to the water’s surface and spreading there. As the warm water reaches the cooling pads, it gets cooled, becomes denser and sinks. Similarly, the cold water reaching the warming pads becomes less dense and rises, closing the loop.