Tag Archives: literature

The structural complexity of learning outcomes

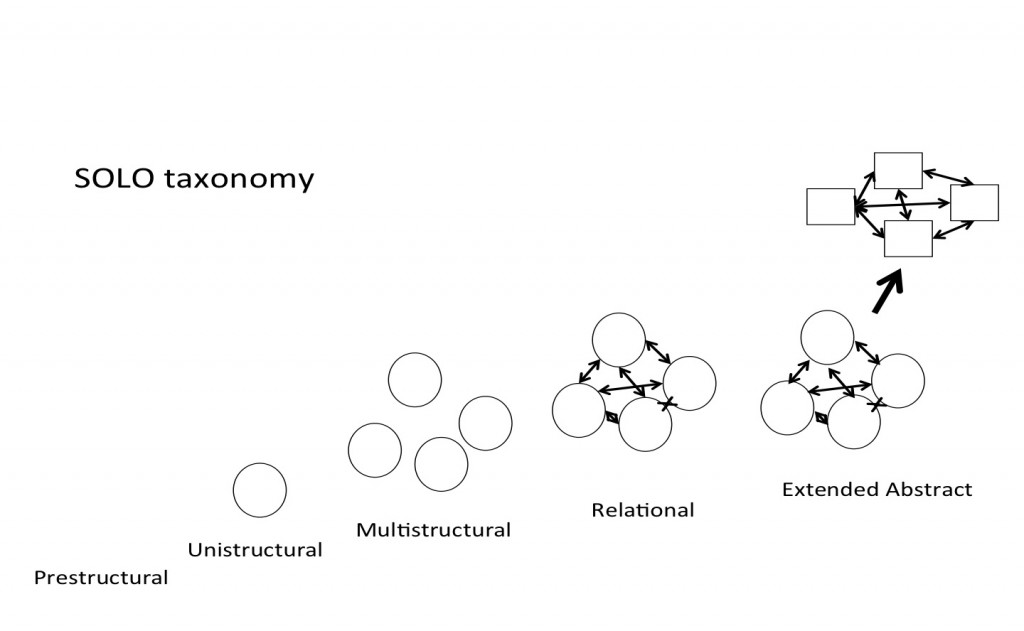
The Structure of the Observed Learning Outcome taxonomy.

I talked about the classification of learning outcomes according to Blooms’s taxonomy recently, and got a lot of feedback from readers that the examples of multiple-choice questions at different Bloom-levels were helpful. So today I want to present a different taxonomy, “Structure of the Observed Learning Outcome”, SOLO, this one classifying the structural complexity of learning outcomes.

SOLO has first been published in 1982 by Biggs and Collis, and the original book is sadly out of print (but available in Chinese). There is a lot of material out there that either describes SOLO or applies it to teaching questions, so you can get a quite good idea of the taxonomy without having read the original source (or so I hope ;-)).
SOLO has four levels of competence: unistructural, multistructional, relational and extended abstract. At the unistructural level, students can identify or name one important aspect. Multistructural then means that the student can describe or list several unconnected important aspects. At the relational level, students can combine several important aspects and analyze, compare and contrast, or explain causes. Lastly at the extended abstract level, students can generalize to a new domain, hence create, reflect or theorize.
Slide1

Visualization of the different levels of competence in the SOLO taxonomy

While competence is assumed to increase over those four levels, (in fact, there is a fifth, the prestructural, level before those four levels, where the student has completely missed the point), difficulty does not necessarily increase in a similar way.

Depending on how questions are asked, the level of competence that is being tested can be restricted. I am going to walk you through all the levels with an example on waves (following the mosquito example here). For example, asking “What is the name for waves that are higher than twice the significant wave height?” requires only a pre-structural response. There is basically no way to arrive at that answer by going through reasoning at a higher competence level.

Asking “List five different types of waves and outline their characteristics.” requires a multi-structural response. A student could, however, answer at the relational level (by comparing and contrasting properties of those five wave types) or even the extended abstract level (if the classification criteria were not only described, but also critically discussed).

A higher SOLO level would be required to answer this question: “List five different types of waves and discuss the relative risks they pose to shipping.”

At worse, this would require a multi-structural response (listing the five types of waves and the danger each poses to shipping). But a relational response is more likely (for example by picking a criterion, e.g. wave height, and discussing the relative importance of the types of waves regarding that criterion). The question could even be answered at the extended abstract level (by discussing how relevance could be assessed and how the usefulness of the chosen criteria could be assessed). Since the word “relative” is part of the question, we are clearly inviting a relational response.

In order to invite an extended abstract response, one could ask a question like this one:

“Discuss how environmental risks to shipping could be assessed. In your discussion, use different types of waves as examples.”

Is it helpful for your own teaching to think about the levels of competence that you are testing by asking yourself at which SOLO level your questions are aiming, or do you prefer Bloom’s taxonomy? Are you even combining the two? I am currently writing a post comparing SOLO and Bloom, so stay tuned!
Testing drives learning.

Once you’ve tested on something correctly once, you will remember it forever. Right?

In a study on “The Critical Importance of Retrieval for Learning” by Karpicke and Roediger (2008), four different student groups are compared in order to figure out the importance of both repetition and testing for longer-term recall of learned facts.

Students are asked to memorize a list of 40 Swahili-English word pairs, and then tested on those pairs. After the first test, the four groups are then treated differently: The first group continues studying and testing on all word pairs. The second group continues studying all word pairs, but is only tested on those words that were not successfully recalled. As soon as one word pair is successfully recalled, it is dropped from all subsequent tests. The third group is tested on all word pairs in all tests, but word pairs that were successfully recalled in a test are dropped from subsequent studying. And for the last group, every successfully recalled word pair is dropped from all subsequent studying and testing.

The learning gain during the study period is very similar for all four groups, but interestingly the recall a week later is not.

The groups that were always tested on all word pairs, no matter whether the word pairs were studied until the end or dropped after successful retrieval, could recall about 80% of the word pairs one week later. The students in the other two groups, where word pairs were dropped from testing after successful retrieval, only recalled between 30 and 40% of word pairs correctly.

This basically shows that repeated studying does not have an effect once a word pair has been successfully recalled once, but that repeated testing even after a successful recall consolidates the learning. Testing drives learning, indeed.

These findings should probably have substantial implications on the way we teach – and on how we learn ourselves. The authors report that self-testing is rarely reported as a self-studying technique and that practicing retrieval is only ever a side benefit of students testing whether or not they have learned. And the findings are indeed contradicting the widely accepted conventional wisdom that repetition will improve retention of material. So at the very least, we should share the findings of this study with students and educators.

One way to include more testing in large classes are clickers and multiple choice questions, and the benefits of clickers on retention of material are discussed in the Marsh et a. (2007) paper discussed recently.

Another way would be to encourage students to not just repeatedly read a text when studying for an exam, but to ask themselves questions on details of the text to test what they remember and how well they understand it.

Come to think of it, there are really a lot of possibilities for including question-asking in classes. How are you going to do it?

Classifying educational goals using Bloom’s taxonomy

How can you classify different levels of skills you want your students to gain from your classes?

Learning objectives are traditionally categorized after Bloom’s (1956) taxonomy. Bloom separates learning objectives in three classes: cognitive, affective and psychomotor. Cognitive learning objectives are about what people know, understand and about their thinking processes dealing with and synthesizing that knowledge. Affective learning objectives are about feelings and emotions. Lastly psychomotor learning objectives are about what people do with their hands. Even though Bloom was trying to combine all three classes, in the context of today’s university education, the focus is clearly on cognitive learning objectives.

Cognitive learning objectives can be divided into sub-categories. From low-level to high-level processes those categories are as follows:

Knowledge Learning gains on this level can for example be tested by asking students to repeat, define or list facts, definitions, or vocabulary.

Comprehension In order to test comprehension, students can for example be asked to describe, determine, demonstrate, explain, translate or discuss.

Application Ability to apply concepts is shown for example by carrying out a procedure, calculating, solving, illustrating, transferring.

Analysis Competency on this level can be tested by asking students to contrast and compare, to analyze, to test, to categorize, to distinguish.

Synthesis Ability to synthesize can be shown by assembling, developing, constructing, designing, organizing or conceiving a product or method.

Evaluation The highest level, evaluation, can be tested by asking students to justify, assess, value, evaluate, appraise or select.

In the next post I’ll talk about how you can use this classification to help with developing good multiple-choice questions, so stay tuned!

Giving feedback on student writing

When feedback is more confusing than helpful.

The other day I came across a blog post on Teaching & Learning in Higher Ed. on responding to student writing/writers by P. T. Corrigan. And one point of that post struck home, and that point is on contradictory teacher feedback.

When I am asked to provide feedback on my peers’ writing, I always ask them about what stage in the writing process they are in and what kind of feedback do they want. Are they in the copy-editing stage and want me to check for spelling and commas, or is this a first draft and they are still open for input on the way their thoughts are organized, or even on the arguments they are making? If a thesis is to be printed that same evening, I am not going to suggest major restructuring of the document. If we are talking about a first draft, I might mark a typo that catches my eye, but I won’t focus on finding every single typo in the document.

But when we give feedback to students, we often give them all the different kinds of feedback at once, leaving them to sort through the feedback and likely sending contradictory messages in the process. Marking all the tiny details that could, and maybe should, be modified suggests that changes to the text are on a polishing level. When we suggest a completely different structure at the same time, chances are that rather than re-writing, students will just move existing blocks of text, assuming that since we provided feedback on a typo-level, those blocks of text are in their final, polished form already when that might not be how we perceive the text.

Thinking about this now, I realize that the feedback I give on student writing does not only need to be tailored to the specific purpose much better, it also needs to come with more meta information about what aspect of the writing my focus is on at that point in time. Only giving feedback on the structure without pointing out grammatical mistakes only sends the right message when it is made clear that the focus, right now, is only on the structure of the document. Similarly, students need to understand that copy-editing will usually not improve the bigger framing of the document and only focus on layout and typo-type corrections.

We’ve intuitively been doing a lot of this pretty well already. But go read Corrigan’s blog post and the literature he links to – it’s certainly worth a read!

Why might students not learn from demonstrations what we want them to learn?

More potential pitfalls to avoid when showing demonstrations.

Kristin and I have been invited to lead a workshop on “Conducting oceanography experiments in a conventional classroom” at the European Marine Science Educators Association EMSEA14 conference in Gothenburg in October (and you should definitely come – it’s gonna be a great conference!). And while you know I’m a big fan of showing a lot of demonstrations and experiments in class, for the purpose of this workshop I’ve looked into the literature to base the argument for (or against) demonstrations on a sound scientific basis.

I recently discussed how demonstrations help most when they are embedded in active learning scenarios, where students make predictions before watching the demonstration, and discuss afterwards. But what else should we take care of when using demonstrations as a teaching tool?

The paper “Why May Students Fail to Learn from Demonstrations? A Social Practice Perspective on Learning in Physics” by Wolff-Michael Roth and coauthors (1997) presents 6 dimensions that might hinder student learning. Rather than repeating what they found from their example (but you should definitely read the paper – it is really interesting!), I thought I’d ask myself how well my own teaching is doing along those 6 dimensions.

So without further ado, let’s get started. These are the 6 dimensions:

1) Separating signal from noise
2) Different discourses
3) Interference from other demonstrations
4) Switching representations
5) Larger context of demonstrations
6) Lack of opportunities to test science talk

For 1 and 3, I immediately identified situations in my teaching where I might have hindered student learning by not paying enough attention to those dimensions. Those I will discuss in separate posts over the next couple of days (dimension 1; dimension 3). I am still thinking about 2 and 4 and while there are probably examples of where I could improve along those dimensions, I still haven’t come up with examples where the signal is a lot clearer than the noise (see what I did there?). So let’s focus on 5 and 6 here.

So, 5. “Larger context of demonstrations”? In their paper, Roth and coauthors mainly focus on how students are told that the demonstrations they see will not be relevant for the exam. This is definitely not the case in my classes – my students know that they might have to recall details of the experiments in the exam or use them as a basis to develop other experiments. Also most experiments in my class are not just presented, but are in some kind of teaching lab context, or are taken up in homework assignments. As one motivation for me to show experiments in class is for students to practice to write lab reports, the pen-dropping described in the article does not happen in my class, or at least not nearly as extensively as described.

However, I am wondering whether the students realize the larger larger context for the demonstrations. As in whether they realize the learning objectives behind me showing the demonstrations. This I need to think more about.

And 6. “Lack of opportunities to test science talk”? I have been using peer instruction in my courses, and I have always interacted a lot with my students, both during lectures, labs, student cruises and outside of classes, but I could probably still improve on this. Especially seeing the positive effect active learning has, I will make sure to incorporate enough opportunities to practice science talk in future courses.

How about you? How are you doing along those 6 dimensions?

Roth, W. M., McRobbie, C. J., Lucas, K. B., & Boutonné, S. (1997). Why may students fail to learn from demonstrations? A social practice perspective on learning in physics. Journal of Research in Science Teaching: The Official Journal of the National Association for Research in Science Teaching, 34(5), 509-533.

So what exactly are we testing?

Asking the right questions is really difficult.

Last week, a paper by Gläser and Riegler was presented in the journal club at my work (can’t find it online yet, so can’t link to it, sorry!). Even though the paper itself dealt with the effectiveness of so-called “Brückenkurse” (i.e. 2-week courses that are offered to incoming students to bring them up to speed in mathematics before they take up their regular university courses), what ended up fascinating me much more is how one the choice of the test question was really unfortunate.

The authors were trying to compare additive and proportional reasoning capabilities of the students. Additive reasoning is of the kind “if M and G share a cake and M eats 2/3rd of it, how much does G get?” or “If you want to be at school five minutes earlier than usual, how much earlier than usual should you be leaving from home?”. Proportional reasoning, on the other hand, is something like “M is driving at constant speed. After one hour, she has driven 15km. How far had she driven after 30 minutes?”. Browsing now, I see that there is tons of literature on how children develop additive and proportional reasoning skills which I haven’t read yet, so please go look for yourself if you want to know more about that.

Anyway, the question the authors asked to gauge the additive reasoning skills of the students, went something like this:

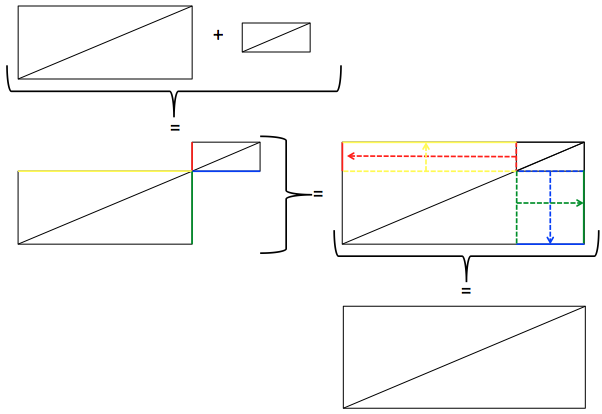
A rectangle with a diagonal length of 2 cm is uniformly scaled up, such that its circumference grows by 2.5 cm. The new diagonal is now 3 cm long. Now a similar rectangle, with a 7cm long diagonal, is scaled up such that its circumference grows by 2.5 cm. How long is the diagonal of the new rectangle?

And then they offer multiple choice answers for both the result and the explanations.

Wanna figure it out for yourself? Go ahead! I won’t talk about the answer until much further down in the figure caption…

We did not actually solve this question during the discussion, but the ideas bounced around all focussed on “a2 + b2 = c2” or “sine and cosine!” or other stuff prompted by a right triangle – likely the kind of associations that students taking that test would also have.

Since we weren’t aware that we were looking at a question to be solved with additive reasoning, the simplest solution didn’t occur to us. Maybe not surprisingly, since similarity in geometry means that one shape can be produced from another only by stretching and/or rotating and/or flipping it, with all angles staying the same and the proportion of all lengths staying the same, too, which seems to be all about proportionality rather than additive reasoning.

glaeser_and_riegler_proportional_reasoning

The main steps in discovering that additive reasoning actually works in this case. From the question we know that adding a similar rectangle with 2.5 cm circumference increased the diagonal by 1 cm, from the drawing above we see that this holds no matter the size of the original rectangle as long as similarity is given (which it is in the question), hence the length of the diagonal in the question will increase from 7 to 8 cm.

Looking for an additive reasoning solution, in the end that one is very easy to find (see figure above). However, looking at those exercises was a great reminder for how much we are conditioned to react to certain stimuli in specific ways. See a right triangle? a2 + b2 = c2! Mathematics test? Must be some complicated solution and not just straight-forward adding up of two numbers! There is a lot of research on how correct problem-solving strategies are triggered in situations where they are not applicable, but it was a good (and scary!!) reminder to experience first hand how none* of us 15 or so colleagues came up with the correct strategy right away to solve this really very simple problem. This really needs to have implications on how we think about teaching, especially on how we condition students to react to clues as to what kind of strategy they should pick to solve a given problem. Clearly it is important to have several strategies ready at hand and to think a little bit about which one is applicable in a given situation, and why.

* edit: apparently one colleague did come up with the correct answer for the correct reasons, but didn’t let the rest of us know! Still – one out of 14 is a pretty sobering result.

How to make demos useful in teaching

Showing demonstrations might not be as effective as you think.

Since I was talking about the figures I bring with me to consultations yesterday, I thought I’d share another one with you. This one is about the effectiveness of showing demonstrations in the classroom.

As you might have noticed following this blog, I’m all for classroom demonstrations. In fact, my fondness for all those experiments is what led me to start this blog in the first place. But one question we should be asking ourselves is for what purpose we are using experiments in class: “Classroom demonstrations: Learning tools or entertainment?”. The answer is given in this 2004 article by Crouch et al., and it is one that should determine how exactly we use classroom demonstrations.

The study compares four student groups: a group that watched the demonstration, a group that was asked to make a prediction of the outcome and then make a prediction and then watched the demonstration, a group that was asked to make a prediction, watched the demonstration and then discussed it with their peers, and a control group that did not see the demonstration. All groups were given explanations by the instructor.

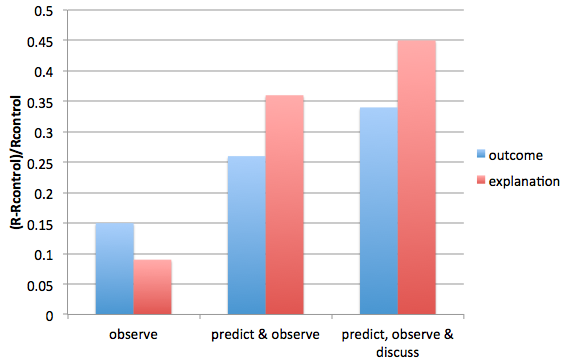
So how much did the groups that saw the demonstration learn compared to the control group? Interestingly, this varied between groups. Tested at the end of the semester without mentioning that a similar situation had been show in class, for the outcome, watching the demonstration led to a learning gain* of 0.15, predicting and then watching lead to a learning gain of 0.26 and predicting, watching and discussing lead to a learning gain of 0.34. For a correct explanation, this is even more interesting: watching the demonstration only lead to a learning gain of 0.09, predicting and watching to 0.36 and predicting, watching and discussing to 0.45.

Crouch_demonstrations_learning_gains

Learning gains found by Crouch et al (2004) for different instructional methods of classroom observations.

So passively showing demonstrations without discussion is basically useless, whereas demonstrations that are accompanied by prediction and/or discussion lead to considerable learning gains, especially when it comes to not only remembering the correct outcome, but also the explanation. Which ties in with this post on the importance of reflection in learning.

Interestingly, in that study the time investment that led to the higher learning gains is small – just two extra minutes for the group that made the predictions, and 8 minutes for the group that made the predictions and then discussed the experiment in the end.

Since you are reading my blog I’ll assume that you don’t need to be convinced to show demonstrations in your teaching – but don’t these numbers convince you to not just show the demonstrations, but to tie them in by making students reflect on what they think will happen and then on why it did or did not happen? Assuming we are showing demonstrations as learning tools rather than (ok, in addition to) as entertainment – shouldn’t we be making sure we are doing it right?

* The learning gain is calculated as the ratio of the difference between the correct outcomes of the respective groups and the control group, and the correct outcome of the control group: (R-Rcontrol)/Rcontrol. For the actual numbers, please refer to the original article.

Should we ask or should we tell?

Article by Freeman et al., 2014, “Active learning increases student performance in science, engineering, and mathematics”.

Following up on the difficulties in asking good questions described yesterday, I’m today presenting an article on the topic “should we ask or should we tell?”.

Spoiler alert – the title says it all: “Active learning increases student performance in science, engineering, and mathematics”. Nevertheless, the recent PNAS-article by Freeman et al. (2014) is really worth a read.

In their study, Freeman and colleagues meta-analyzed 225 studies that compared student learning outcomes across science, technology, engineering and mathmatics (STEM) disciplines depending on whether students were taught through lectures or through active learning formats. On average, examination scores increased by 6% under active learning scenarios, and students in classes with traditional lecture formats were 1.5 times more likely to fail than those in active learning classes.

These results hold for all STEM disciplines and through all class sizes, although it seems most effective for classes with less than 50 students. Active learning also seems to have a bigger effect on concept inventories than on traditional examinations.

One interesting point the authors raise in their discussion is whether for future research, traditional lecturing is still a good control, or whether active learning formats should be directly compared to each other.

Also, the impact of instructor behavior and of the amount of time spent on “active learning” are really interesting future research topics. In this study, even lectures with only as little as 10-15% of their time devoted to clicker questions counted as “active”, and even a small – and doable – change like that has a measurable effect.

I’m really happy I came across this study – really big data set (important at my work place!), rigorous analysis (always important of course) and especially Figure 1 is a great basis for discussion about the importance of active learning formats and it will go straight into the collection of slides I have on my whenever I go into a consultation.

Check out the study, it is really worth a read!

On asking questions

How do you ask questions that really make students think, and ultimately understand?

I’ve only been working at a center for teaching and learning for half a year, but still my thinking about teaching has completely transformed, and still is transforming. Which is actually really exciting! :-) This morning, prompted by Maryellen Weimer’s post on “the art of asking questions”, I’m musing about what kind of questions I have been asking, and why. And how I could be asking better questions. And for some reason, the word “thermocline” keeps popping up in my thoughts.

What a thermocline is, is one of the important definitions students typically have to learn in their intro to oceanography. And the different ways in which the term is used: as the depth range where temperatures quickly change from warm surface waters to cold deep waters, as, more generally, the layer with the highest vertical temperature gradient, or as seasonal or permanent thermoclines, to name but a few.

I have asked lots of questions about thermoclines, both during lectures, in homework assignments, and in exams. But most of my questions were more of the “define the word thermocline”, “point out the thermocline in the given temperature profile”, “is this a thermocline or an isotherm” kind, which are fine on an exam maybe, than of a kind that would be really conductive to student learning. I’ve always found that students struggled a lot with learning the term thermocline and all the connected ones like isotherm, halocline, isohaline, pycnocline, isopycnal, etc.. But maybe that was because I haven’t been asking the right questions? For example, instead of showing a typical pole-to-pole temperature section and pointing out the warm surface layer, the thermocline, and the deep layer*, maybe showing a less simplified section and having the students come up with their own classification of layers would be more helpful? Or asking why defining something like a thermocline might be useful for oceanographers, hence motivating why it might be useful to learn what we mean by thermocline.

In her post mentioned above, Maryellen Weimer gives several good pieces of advice on asking questions. One that I like a lot is “play with the questions”. The main point is that “questions promote thinking before they are answered”. So rather than trying to make students come up with the correct answer as quickly as possible after the question has been posed, why not let them produce multiple answers and discuss the pros and cons before settling on one of the answers? Or why not ask a question, not answer it right away, and come back to asking it over the course of the lesson or even over several lessons? I think the fear is often that if students don’t hear the right answer right away, they’ll remember a wrong answer, or lose interest in the question. However, even though this does sound plausible, this might not be how learning actually works.

A second piece of advice that I really liked in that post is “don’t ask open-ended questions if you know the answer you’re looking for”. Because what happens when you do that is, as we’ve probably all experienced, that we cannot really accept any answer that doesn’t match the one we were looking for. Students of course notice, and will start guessing what answer we were looking for, rather than deeply think about the question. This is actually a problem with the approach I suggested above: When asking students to come up with classifications of oceanic layers from a temperature section – what if they come up with something brilliant that does unfortunately not converge on the classical “warm upper layer, thermocline, cold deep layer” classification? Do we say “that’s brilliant, let’s rewrite all the textbooks” or “mmmh, nice, but this is how it’s been done traditionally”? Or what would you say?

And then there is the point that I get confronted with all the time at work; that “thermocline” is a very simple and very basic term, one that one needs to learn in order to be able to discuss more advanced concepts. So if we spent so much of our class time on this one term, would we ever get to teach the more complicated, and more interesting, stuff? One could argue that unless students have a good handle on basic terminology there is no point in teaching more advanced content anyway. Or that students really only bother learning the basic stuff when they see its relevance for the more advanced stuff. And I actually think there is some truth to both arguments.

So where do we go from here? Any ideas?

* how typical a plot to show in an introduction to oceanography that one is, is coincidentally also visible from the header of this blog. When I made the images for the header, I just drew whatever drawings I had made repeatedly on the blackboard recently and called it a day. That specific drawing I have made more times than I care to remember…

Learning by thinking

Di Stefano et al. find that reflection is an important step in the learning process.

I’ve always liked learning by teaching. Be it in sailing as a teenager or more recently in oceanography – I have always understood concepts better when I had to teach them to others. I have also heard tales from several professors I work with about how many concepts are only understood by students once they start working as student tutors. Intuitively, that has always made sense to me: Since I had to explain something to others, I had to think more deeply about it in order to make sure I had a comprehensive explanation ready. In other words, I was forced to reflect on what I had learned and that improved my learning.

Recently, I came across this study by Di Stefano et al. (2014), titled “Learning by Thinking: How Reflection Aids Performance”. There the authors describe the same thing: “learning can be augmented by deliberately focusing on thinking about what one has been doing”. But, contrary to what they were expecting, they did not find that sharing the reflection did have a significant effect on performance, at least not when it happened in addition to reflection – the main factor always seemed to be the reflection.

Interestingly, this seems to work through the reflection’s effect on self-efficacy: Reflection builds confidence that one is able to use the new skills to achieve a goal. This, in turn, leads to more learning.

This is again something that intuitively makes sense to me: Whenever I have been writing learning journals or been doing portfolios for one course or another, I felt like I was  constantly learning new things and achieving larger or smaller goals, whereas without documenting all those small victories they never stood out enough to be remembered even minutes later. So documenting them then, of course, made me feel more confident in my ability to work with whatever specific set of skills I was working on at that time.

So for me, the take-home message of this study is to encourage reflection whenever I get the chance. This sounds platitudinous, but what I mean is that am going to take every opportunity I get to encourage the use of learning journals, of blogs, of teaching. Both for the learning gain and for the feeling of gained self-efficacy.