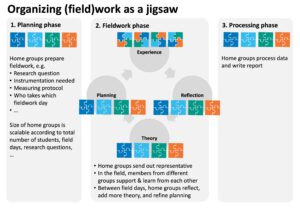
I am a huge fan of Kjersti‘s excellent teaching, it is always so inspiring! She, together with Hans-Christian, developed a jigsaw method to structure preparation for a student cruise, the cruise itself, and then writing of cruise reports. We wrote it up and submitted it for a forthcoming book on field teaching (which I will share links to as soon as they become available), but here comes an extended version for you already!
Tag Archives: Kjersti Daae
Using rubrics
I’ve been a fan of working with rubrics for a long time, but somehow I don’t seem to have blogged about it. So here we go!
Rubrics are basically tables of learning outcomes. The rows give different criteria that are to be assessed, and then performance at (typically three) different levels is described. Below, I’ll talk about the benefits that working with rubrics have for both teachers and students, and give two concrete examples of how we used them and why that was helpful.
Rubrics are a great tool for teachers
- Designing a rubric makes you really think long and hard about what it is that you want students to be able to demonstrate for the different criteria, and how you would distinguish an ok performance from a good performance for each criterion.
- Once the rubric is set up, grading becomes a lot easier. Instead of having to think about how well any given response answers your question, now it’s basically about putting crosses in the relevant cells matching the performance you see in front of you.
- This makes it a lot easier when there are many people involved in grading — the dreaded “but x got a point for y and I didn’t!”-discussions become a lot fewer because now grading is a lot more objective
- Giving feedback also becomes a lot easier, since all the performance descriptions are already there and it’s now basically about copy&paste (or even sharing the crossed-through rubric) to show “this is where you are at” and “this is what I was expecting”.
- It also helps in course planning…
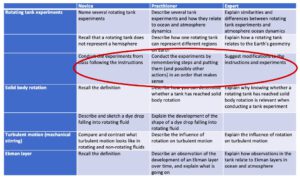
One example of where I was really glad we did have a rubric is the project that Torge and I collaborated on: We bought four cheap setups for rotating tank experiments and designed a course around making otherwise really unintuitive and difficult to observe concepts not only visible, but manipulating them in order to gain a deeper understanding. We had written down a rubric pre-corona, but when we went into lockdown in March 2020, having the rubric helped us a lot in quickly figuring out how to transfer a very much hands-on course online. Since we had clearly identified the learning outcomes, it became very easy to think of alternative ways to teach them virtually. The figure above shows part of the rubric, and circled in red is the only learning outcome in that selection (of a lesson that we thought was all about the hands-on experience!) that wasn’t just as well taught virtually. But looking closely at the rubric, we realised that the students did not actually need to necessarily do the rotating experiments themselves, as long as they were doing some kind of experiment themselves to practice conducting experiments following lab instructions. With the rubric, we had a checklist of “this is what they need to be able to do at the end of class” to directly convert into activities. We ended up with me showing the rotating experiments from my kitchen, while the students were doing non-rotating experiments, using only readily available household items, from their homes. Without the very explicit learning outcomes in our rubric, converting the course would probably been a lot more difficult.
Rubrics are also great for students
- They get a comprehensive overview over what the instructor actually expects from them
- They can use the rubric to make sure they “tick all the boxes”, or strategically decide where to put their time and effort
- Instructor feedback is now a lot more helpful than “2 out of 5 points”.
Kjersti shares an example of how she “negotiated” rubrics in her GEOF105 class to co-create it with her students:
The goal is to invite students to negotiate an assessment rubric for written assignments. We have tested this out in the following way:
- The teacher drafted a rubric and assigned an equal weighting of 5 points to each assessment criteria (15 criteria gave a total score of 75 points).
- The students voted anonymously for which criteria they wanted to assign a stronger weighting. We made no limits in how many criteria each student could vote for.
- The votes were counted up, and the remaining 25 points in the assessment were distributed based on the number of votes for each criterion.
The two criteria most students voted to weight stronger, were the structure of the lab report and the reflection part. I suspect they wanted more points for the structure partly because it is not too difficult, but also because they spend much time figuring out how a lab report should look. I also found it interesting that they wanted more points for reflection. Last year we asked the students to write a reflection paragraph that would not be assessed. We thought it would be stressful for the students to write the reflection knowing it would be evaluated. But, I guess we were wrong!
They also wanted more point for making/discussing hypothesis, using good illustrations and relating the experiment tank to the Earths geometry — all of which are objectively difficult parts of the lab report.
We found two main results after using the negotiated rubric:
- The students (on average) achieved higher scores than the previous year (were the rubric was fixed)
- The students made fewer complaints to the assignment score
We think the students achieved higher scores because they spent more time getting acquainted with the rubric before writing their assignments and could use it more constructively as a checklist.
So those are our experiences with using rubrics. How about you? We’d love to hear from you!
Small groups work on shared artefacts
Participation in shared production of artefacts is a great way to learn in a community, because putting things on paper (or, as we will see later, on online slides or physical whiteboards) requires a clearer articulation of the topic of discussion, and a level of commitment to a shared meaning (Wenger, 1998). We give two examples of methods we like to use, and then a trick to break up roles in student groups so it is not always the same person taking notes or reporting back to the group.
Physical whiteboards
One of Kjersti‘s favourite teaching techniques is the use of whiteboards, especially in GEOF105, a second-year course introduction to oceanography and meteorology (see many examples of great student artefacts on her Twitter; and multiple-choice questions to support discussions as her other favourite method here).
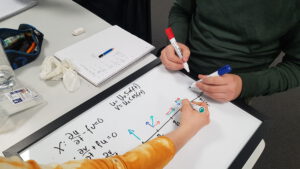
For in-person teaching with group discussions and exercises, the groups can draw or write their main results on portables whiteboards (best trick: Picture frames with just white paper behind the glass! Very cheap, very effective. Great idea, Elin!). When the students are asked to document their results on a whiteboard, they need to be concrete and agree on the level of details they provide.
In our GEOF105 course in undergraduate oceanography, we use many sketching exercises. We find that the sketching exercises provide many positive aspects:
- Students like sketching. They often decorate the sketches with smiling suns or add wildlife to the sketches, contributing to a relaxed atmosphere and a positive learning environment.
- Many questions arise when the students start sketching, because suddenly having a vague idea is not enough any more. First, they discuss, explain, and check if their ideas make sense. Then, they need to combine all the ideas into one concrete sketch.
- The sketching activates more students in the discussions. Some students take responsible for sketching, some provide input, and some ask questions.
Below, you see an example of one group’s work on coastal up- and downwelling on the Northern vs Southern hemisphere (note the use of appropriate animals to illustrate the hemisphere ;-))
Shared online slides
But this type of negotiating of meaning can also happen in a virtual space. We have used shared online slides during group work in both digital and in-person teaching. The slides provide an easy way to provide figures and questions the groups can work on, and you can also add one slide for each group where they write down a summary of their discussion or answers key questions. The sharing of online slides and collaborative writing on them provides several opportunities:
- You can keep track of the groups’ progress by looking at their slides. Especially in digital teaching, where you cannot as easily eavesdrop on the students’ discussions, it is difficult to visit all the different breakout groups and get an idea of their progress. Students often dislike it if the teacher jumps into their breakout-group unannounced (ehem, some teachers dislike doing it, too…). We have experienced that students prefer the teacher to pay attention to the slides and not visit the breakout-groups uninvited.
- You can choose to allow the students to look at the other groups’ slides. This gives an opportunity to help the students if they feel they get lost or need some ideas to proceed with the discussions.
- You can review the slides from the different groups and make a summary after the group activity, prepare how to structure a discussion based on the points different groups wrote down, or how to proceed (giving students more or less time in the group, picking up or dropping a topic, …).
- The students have access to the shared slides — and thus their combined notes — after the lecture
Anecdotal evidence, but students that are asked “which ice cube will melt faster, the one in salt water or the one in freshwater?” without also being asked to sketch the mechanism they base their answer on, almost always get it wrong (or right only for the wrong reasons). This year’s class all came to the correct response based on the correct mechanism (see below)!
Assigning responsibilities to break up established roles
Group dynamics can be tricky, and groups very easily fall into pattern that might engage students very unequally. To facilitate shared responsibility for taking notes, sticking to the topic of discussion, or reporting back from group work, you can assign and re-assign the roles based on semi-random criteria. For in-person teaching, you can use their birthday (e.g. birthday closest to Christmas, or ’today’), or other semi-random information to distribute roles. In online teaching, you can also use the students’ physical location as a criterion. You can, for instance, ask the student located furthest south/north/east/west to report back from the group. The students will need to first figure out who is responsible for each role and then follow through with that. Great icebreaker, and not always the same person taking notes or reporting back!
Guest post by Kjersti Daae: Using voting cards to increase student activity and promote discussions and critical thinking
I got permission to publish Kjersti Daae‘s iEarth conversation on teaching (with Torgny Roxå and myself in April 2021) on my blog! Thanks, Kjersti :-) Here we go:
I teach in an introductory course in meteorology and oceanography (GEOF105) at the geophysical institute, UiB. The students come from two different study programs:
Most students do the course in their third semester. They have not yet learned all the mathematics necessary to dive into the derivation of equations governing the ocean processes. Therefore, we focus on conceptual knowledge and understand the governing ideas regarding central ocean processes, such as global circulation and the influence of Earth’s rotation and wind on the ocean currents. The students need to learn how to describe the various processes and mechanisms included in the curriculum. I, therefore, use voting cards to promote student discussions during lectures.
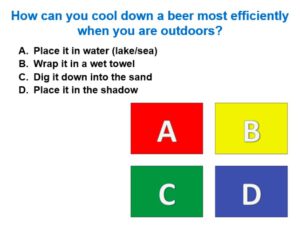
I first heard about voting cards from Mirjam’s blog “Adventures in Oceanography and Teaching”. The method is relatively simple. You pose a question with four alternatives A,B,C,D, accompanied by different colours for easy recognition. The students have a printout each with the four letters on it.They spend a few minutes thinking about the question and prepare their answer. Then they fold their paper so that only one letter/colour shows, and hold it up and provide direct feedback to the teacher. The questions can, among others, be used to checking if the students understand a concept or let the students guess the outcome of something they haven’t learned yet.
However, I prefer to use voting cards to promote discussions among peers. This procedure is following the Think-pair-share method developed by Lyman (1981). By carefully selecting alternative answers, I can make it hard for the students to choose the correct answer, or the answers can be formulated so that the students can argue for more than one correct answer. When the students hold up their answers, they can look around at the other students’ responses and find someone with a different response than themselves. Then they can pair up and discuss why they answer differently and see if they can agree on one common answer before sharing their opinion with the rest of the class. During this exercise, the students practice talking about science and arguing for various answers/outcomes based on the voting cards’ questions.The exercises serve at least two purposes:
- The student practice answering/discussing relevant questions for the final exam.
- The students get active instead of listening passively to the lecturer.
Usually, I can see the students becoming very tired after 10-15 minutes of passive listening. These voting questions “wake up” the students, and after one such question, they tend to stay focused for another 10-15 minutes.
I think the voting cards work really well. When I display a question, the students usually move from a relaxed position to sitting more straight and preparing for being active. I can hear them discussing what they are supposed to. I also get very good feedback and responses in whole-class discussions/summaries following the discussions in pairs. Such summaries are especially interesting if multiple answers can be correct, depending on how the students argue. I can select responses from students based on their visible letters and make sure we can hear different solutions to the same question. During a semester, I see a clear development in the way students reflect on the various questions and express critical thinking governing oceanographic processes. The exercises show the students how important argumentation is. An answer with a well-founded argumentation and critical thinking is worth much more than just the answer/letter. My observation is consistent with Kaddoura (2013), who found that the think-pair-share method increased nursing students’ critical thinking.
Lyman, F. (1981). “The responsive classroom discussion.” In Anderson, A. S. (Ed.), Mainstreaming Digest, College Park, MD: University of Maryland College of Education.
Kaddoura, M. (2013). «Think Pair Share: A Teaching Learning Strategy to Enhance Students’ Critical Thinking», EducationalResearchQuarterly, v36 n4 p3-24
Learning together across courses — our iSSOTL presentation
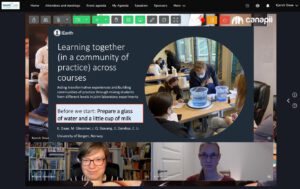
Last week, Kjersti Daae and I gave a virtual presentation at the iSSOTL conference, and here is a short summary.
We presented an ongoing teaching innovation project, funded by Olsen legat and conducted together with Jakob Skavang, Elin Darelius and Camille Li, that we started last year at the Geophysical Institute in Bergen: Bringing together third semester and fifth semester students to do tank experiments.
In our presentation, we touched on the literature inspiring the design of the teaching project, the study we have conducted, and then our results and conclusions.
Our main goal was to change the way students look at the world around them, by giving them a new perspective on things. A framework that describes this well are “transformative experiences” that I wrote about in more detail here.
Transformative experiences are awesome, because they trap you in a feedback loop: Once you have changed the way you look at the world and notice new things, this feels good and makes life more fun. Therefore you continue doing it voluntarily, noticing more cool things in a new way, feeling happier about it, and so on and so on.
One example of a transformative experience happening was described by Dario after we did some kitchen oceanography (more on that here).
But we don’t want people to go through the transformative experience alone, we want them to do it in a community of practice to support one another and create even more of a feedback. In our case, the community are our students at the Geophysical Institute, who share the interest in dynamics of the atmosphere and ocean and learn more about them by having shared experiences and discussions that they can refer back to.
The topic we wanted to address in our course and make the central topic of this community of practice is the influence of rotation on movement in the atmosphere and ocean. This is the central concept of geophysical fluid dynamics, but it is difficult to grasp because the scales in question are so large that they are difficult to directly observe, and the mathematical descriptions are difficult and unintuitive.
And here is where we invited the audience to become part of the very first steps in that teaching project.
We start out by making sure everybody has a good grasp of what happens in a non-rotating frame so we can later contrast the rotating case to something we know for sure people have seen before (we used to assume that people had a good grasp of what happens in non-rotating fluids, but this turns out to be very much not the case).
At this point in our demonstration, Kjersti showed a live demonstration! (And I was so fascinated that I forgot to take a screenshot)
Once we have established what pouring a denser fluid into a lighter fluid looks like in a non-rotating case, it is time to move on to a rotating case. Considering rotation when we talk about flows on the rotating Earth (in the atmosphere or ocean) needs to consider that the Earth has been spinning for a very long time. We can simulate that by rotating a bucket of water (which needs to rotate for a much shorter period of time because it is much smaller).
When we drip colour into a rotating bucket full of water, the way the colour distributes itself looks very different from what it looked like earlier in the non-rotating case. We now get columns of dye rather than the mushroom-like features.
These experiments are not difficult in themselves, but we wanted students to not just follow cookbook-style instructions, but to actively engage and discuss what they observe.
Therefore, we brought students in their third semester together with students in their fifth semester, who had done the same experiments in the previous year.
The idea was that the third semester students would receive guidance by the older students, and would be able to discuss hypotheses and make sense of their observations together. The presence of the fifth semester students would help them be less stressed about potentially making mistakes and help the labs run a lot smoother.
The fifth semester students had done the experiments in the previous year. We prepared them for their role (you don’t need to know all the answers! In fact, you are not supposed to even answer their questions. Help them figuring it out themselves by asking questions like “…”) and went through the experiments with them to refresh their memory and also talk about how they were understanding and seeing things differently now that they had another year of education under the belt compared to when they first saw the experiments.
And then for us: Distributing and sharing responsibility for learning is something we have been interested in for a while now (see blog post on co-creation here for more information). Having students so engaged in sense-making through discussions gave us a great opportunity to eaves-drop on their arguments and get a much better understanding of what they are thinking and which points we should address in more detail later.
In order to understand how this setup worked for the students, we collected several types of data: We had questionnaires aimed at the third semester students (testing specific learning outcomes, but also on their observations of roles and interactions, and interpretations of the situation) and fifth semester students (on observations of roles and interactions, and interpretations of the situation, and how they would compare the experience as “guide” to that the previous year). We instructors also took notes and reflected on our observations.
So what did we find?
The third semester students all perceived the presence of the older students as very positive and described the interactions the way we had hoped — that they weren’t being fed the answers, but asked questions that help them find answers themselves.
From the fifth semester students, we also got a very positive response. They especially focussed on how they had to think about what makes a good question or good instruction, and that that helped them reflect on their own learning. They also pointed out that the experience showed them how much they had learned during the last year, which they had not been aware of before.
They also really enjoyed the experience of being a teacher and interacting in that role.
Also looking at learning outcomes, we found that the third year students learned a lot more as compared to last year’s third year students (which is a bit of an unfair comparison since last year was dominated by covid-19 restrictions, but still that is the only data we have that we can compare to). Specifically, the misconception that “the centre of the tank is the (North) Pole” seems to have been eradicated this year (we’ll see if that holds over time).
One thing we noted and that students also pointed out as very helpful is that conversations did not just deal with the experiment itself, but that the younger students asked a lot of questions about other experiences that the older students had made already, like for example the upcoming student cruise. We had hoped that this would happen, and that these kind of conversations would continue beyond these lessons!
So this is where we ended our presentation and hoped to discuss a couple of questions with the audience. If you have any input, we would love to hear from you, too!
CHESS/iEarth joint course on “communication skills in outreach and teaching”
Kjersti Daae and I led the CHESS/iEarth joint course on “communication skills in outreach and teaching” in Bergen in September 2021; here is a short summary:
CHESS is training the climate scientists of tomorrow, iEarth is changing teaching culture in Norwegian geosciences. Naturally, PhD students from both centres have a lot to talk about, and that they are coming at it from different angles makes it even more interesting!
This course started out virtually in spring, and for 13 weeks, we met online for two hours to discuss a diverse range of topics with super interesting guest speakers:
- Ivar Nordmo spoke about different metaphors of learning, and how the way we speak about learning influences our thoughts on the matter
- Virginia Schutte gave us insights and practical tips both on JEDI (justice, equity, diversity and inclusion) and on science communication
- Kikki Kleiven gave us new ideas about teaching geosciences
- Sam Illingworth made each of us write 3 poems! (See a selection below)
- Jostein Bakke gave us many tips for good outreach
- Cathy Bovill and Mattias Lundmark worked with us on “students as partners”
- Anders Alberg gave many suggestions for building good supervisor-supervisee relationships
- Mirjam Glessmer talked about building networks in academia
And then, in September, we were in the lucky position to actually run an in-person workshop to bring it all together!
We ended up being 8 participants physically in Bergen (enjoying the beautiful new rooms in the basement of the Geophysical Institute, and the excellent catering from the new café there!) and one participant joining online.
The three days were structured to start out with a generous coffee break combined with a morning activity: Some fun science communication practice. On one day, for example, we wrote five lines about our research, and then checked with the xkcd “upgoer 5” editor which of the words we used are not part of the “ten hundred” most common words! We then rewrote and found out that some people are “rock-knowing” and others work on “the big blue water”!
On another day, we made fortune tellers (some of us got distracted with the “kitchen oceanography” examples on the table, i.e. creating double-diffusive layers with milk and coffee… Which led to a lot more kitchen oceanography using coffee later on!)
And on the last day, we tried to visualise things that are difficult to imagine, e.g. how wide a low-pressure system is relative to its height. Here is a nice example of showing how temperature has changed over a very long time (Thanks, Vanja, for jumping on the idea of using toilet paper rolls — I have always wanted to try that!).
But the most important part of the workshops were our phenomenal guest speakers.
Robert Kordts let a session on microteaching and gave helpful feedback (some of the things tried out in the microteachings were directly implemented as outreach for the Bjerknescenter the next day!). Anders Alberg worked with us on providing feedback and understanding research ethics. Torgny Roxå helped us get into why some people resist knowledge. And on the last day, Kikki Kleiven and Helge Drange shared their experience in doing science communication as climate scientists, and gave feedback on our own attempts.
All in all, a super inspiring three days!
Thank you to CHESS and iEarth for making this possible, and for our cool group of participants and guest speakers of being so constructive and engaged!
An iEarth teaching conversation with Kjersti Daae and Torgny Roxå on #WaveWatching
iEarth is currently establishing the new-to-me format of “teaching conversations”, where two or more people meet to discuss specific aspects of one person’s teaching in a “critical friend” setting. Obviously I volunteered to be grilled, and despite me trying to suggest other topics, too (like the active lunch break and the “nerd topic” intro in a workshop), we ended up talking about … #WaveWatching. Not that I’m complaining ;-)
After the conversation, I wrote up the main points as a one-pager, which I am sharing below. Thank you, Kjersti and Torgny, for an inspiring conversation!
—
I use #WaveWatching in introductory courses in oceanography and in science outreach both on social media and in in-person guided tours. #WaveWatching is the practice of looking at water and trying to make sense of why its surface came to look the way it does: What caused the waves (e.g. wind, ships, animals)? How did the coastline influence the waves (e.g. shelter it from wind in some places, or block entrance into a basin from certain directions, or cause reflection)? What processes must be involved that we cannot directly observe (e.g. interactions with a very shallow area or a current)? Kjersti Daae (pers. comm.) suggests an analogy to explain #WaveWatching: Many people enjoy a stir-fry for its taste, like we enjoy looking at water, glittering in the sun, without questioning what makes it special. But once we start focusing on noticing different ingredients and the ways they are prepared, it is a small change in perspective that changes our perception substantially, and leads to a new appreciation and deeper understanding of all future stir-fries (and possibly other dishes) we will encounter.
I teach #WaveWatching using a cognitive apprenticeship leaning (Collins et al., 1988) approach*: By drawing on photos of selected wave fields (in the field using a drawing app on a tablet), I model my own sensemaking (Odden & Russ, 2019). I coach students to engage in the process, and slowly fade myself out. Students then engage in #WaveWatching practice anywhere they find water – in the sink, a puddle in the street, a lake, the ocean. Since waves are universally accessible, this works perfectly as hyper-local “excursions” in virtual teaching: Students work “in the field” right outside their homes.
Waves are not an integral part of the general curriculum in physical oceanography. While some wave processes are relevant for specific research questions, for typical large-scale oceanography they are not. And the concepts used in #WaveWatching are not even new to students, they are just an application of high-school optics to a new context.
Nevertheless, #WaveWatching helps work towards several goals that are important to me:
- Using “authentic data” acts as motivation to engage with theory because the connection with the real world makes it feel more interesting and engaging (Kjelvik & Schultheis, 2019).
- Engaging in sensemaking and gaining experience on what can (and cannot!) be concluded from an observation are highly relevant skills and this is an opportunity for practice.
- Building an identity as oceanographer – seeing the world through a new lens, joining a community of practice (Wenger, 2011), but also being able to demonstrate newfound expertise and identity to friends and family outside of that new community by talking about this new lens – are otherwise rare in socially distant times.
After being exposed to #WaveWatching, people tell me that they can’t look at water in the same way they did before. They are now seeing pattern they never noticed, and they try to explain them or ask themselves what I would see. They often send me photos of their observation years after our last interaction, and ask if I agree with their interpretations. #WaveWatching might thus be a threshold concept, “a portal, opening up a new and previously inaccessible way of thinking about something” and where “the change of perspective […] is unlikely to be forgotten” (Meyer & Land, 2003).
—
Literature:
- Collins, A., Brown, J. S., & Newman, S. E. (1988). Cognitive apprenticeship: Teaching the craft of reading, writing and mathematics. Thinking: The Journal of Philosophy for Children, 8(1), 2-10.
- Kjelvik, M. K., & Schultheis, E. H. (2019). Getting messy with authentic data: Exploring the potential of using data from scientific research to support student data literacy. CBE—Life Sciences Education, 18(2), es2.
- Meyer, J. H. F., and Land, R. (2003) “Threshold Concepts and Troublesome Knowledge: Linkages to Ways of Thinking and Practising” in Improving Student Learning: Ten Years On. C. Rust (Ed), OCSLD, Oxford.
- Odden, T. O. B., & Russ, R. S. (2019). Defining sensemaking: Bringing clarity to a fragmented theoretical construct. Science Education, 103(1), 187-205.
- Wenger, E. (2011). Communities of practice: A brief introduction.
*more on that in this post (that comes online on 21.5.2021).