Tag Archives: circulation
Combining a slowly rotating water tank with a temperature gradient: A thermal wind demonstration!
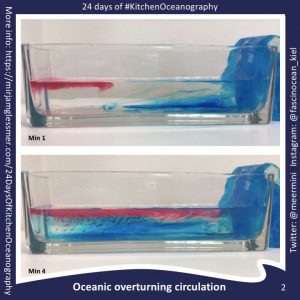
Setting up an overturning circulation in a tank is easy, and also interpreting the observations is fairly straightforward. Just by introducing cooling on one side of a rectangular tank a circulation is induced (at least for a short while until the tank fills up with a cold pool of water; see left plot of the image below).
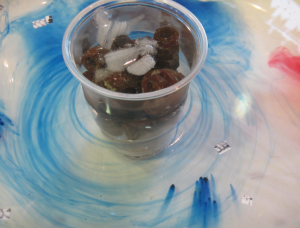
But now imagine an axially symmetric setup where the cooling happens in the middle. What will happen to that overturning circulation if the tank is set into rotation (see right plot above)?
First, let’s check there is an overturning circulation. We can see that there is when we look at dye crystals that sank to the bottom of the tank: Dye streaks are moving outwards (and anti-clockwise) from where the crystals dropped on the ground, so at least that part of the overturning circulation is there for sure. If our tank were taken to represent the Hadley cell circulation in the atmosphere, this bottom flow would be the Trade winds.
Now, in addition to having water sink in the middle of the tank, spread radially outwards, and returning by rising near the outer edge of the tank and flowing back towards the middle, a secondary circulation is induced, and that’s the “thermal wind”. The thermal wind, introduced by the temperature gradient from cold water on the inside of the tank to warmer waters towards the rim, tilts columns that would otherwise stay vertically.
You see that in the image below: Dye dropped into the tank does not sink vertically, but gets swirled around the cold center in a helix shape, indicated in the picture below by the white arrows. In that picture, the swirls are tilted very strongly (a lot stronger than we’d ideally have them tilted). The reason for that is that we just couldn’t rotate the tank as slowly as it should have been, and the higher the rotation rate, the larger the tilt. Oh well…
So this is the current pattern that we observe: An overturning circulation (sketched with the red arrows representing warmer water and the blue arrows representing colder waters below), as well as the thermal wind circulation (indicated in green) with stronger currents near the surface (where the water is moving in the same direction as the rotating tank, but even faster!) and then a backward flow near the bottom. The velocities indicated here by the green arrows are what ultimately tilted our dye streaks in the image above.
The thermal wind component arises because as the overturning circulation moves water, that water carries with it its angular momentum, which is conserved. So water being brought from the rim of the tank towards the middle near the surface HAS to move faster than the tank itself the closer it gets to the middle. This flow would be the subtropical jets in the Hadley cell circulation if out tank were to represent the atmosphere.
Here is an old video of the experiment, first shown 5 years ago here. I’m looking forward to when Torge’s & my rotating tanks are ready so we can produce new videos and pictures, and hopefully being able to rotate the tank even more slowly than we do here (but that was the slowest possible rotation with the setup we had at that time). I promise you’ll see them here almost in realtime, so stay tuned! :-)
Experiment: Temperature-driven circulation
My favorite experiment. Quick and easy and very impressive way to illustrate the influence of temperature on water densities.
This experiment is great if you want to talk about temperature influencing density. Although it doesn’t actually show anything different from a temperature driven overturning experiment, where circulation is determined by hot water rising and cold water sinking, somehow this experiment is a lot more impressive. Maybe because people are just not used to see bottles pouring out with the water coming out rising rather than plunging down, or maybe because the contrast of the two bottles where one behaves exactly as expected and the other one does not?
Anyway, it is really easy to do. All you need is a big jar and two small bottles. Cold water in one of the small bottles is dyed blue, hot water in the other small bottle is dyed red. Both are inserted in the jar filled with lukewarm water (movie below).
Using bottles with a narrower neck than mouth is helpful if you want to use the opportunity to talk about not only temperature-driven circulation, but also about double-diffusive mixing (which you see in form of salt fingers inside the red bottle in the picture above).
Isn’t this beautiful?
—
P.S.: This text originally appeared on my website as a page. Due to upcoming restructuring of this website, I am reposting it as a blog post. This is the original version last modified on December 2nd, 2015.
Those foam stripes parallel to the coast — again!
I think I might be getting obsessed with those stripes parallel to the coast. We saw them as foam stripes, eel grass stripes and now today: leaf stripes!
Or should it be leaves stripes instead of leaf stripes?
Interestingly enough, that day there wasn’t just one stripe, but in some places there were even two. It’s a little difficult to see in the pictures, but it was very clear in person.
See?
A little further downwind foam also appeared, but only inshore of the innermost leaf stripe.
And then a little further downwind, several parallel foam stripes appeared. Now this I could imagine being Langmuir circulation. And all the other stripes must be on individual convergence zones, too?
Someone should hire a PhD student to figure this out, it is really bugging me that there is a phenomenon that we can observe pretty much every time we look at Kiel fjord, yet I can’t find anything on what is going on there.
Luckily, the day I took those pictures, my famous oceanographer friend J was with me, and it was bugging her almost as much as it was bugging me :-) We decided the most likely explanation was that someone had pulled all those leaves on thin strings and put them out in the water just to see whether someone would notice…
The importance of playing in outreach activities.
Some time ago, I wrote two blog posts on the importance of playing in outreach activities for the EGU’s blog’s “educational corner” GeoEd. Both have now been published, check them out! Here is the link on EGU’s website (here) and in case that ever stops working, it is also available on my own website (here – including a lot of bonus materials that didn’t make the cut over at EGU)
What do you think? What makes for the best outreach activities?
Continuity
What do you see when you look at an aquarium?
When I was in Gothenburg last year for EMSEA14, one night we got to hang out at the Sjöfartsmuseet Akvariet there, and, even cooler, had the whole place to ourselves. A lot of the staff was around and happy to chat, including people who actually designed the exhibitions, so that was really exciting. But those are the times when I realize that I am really a physical oceanographer at heart. I like looking at colorful anemones or fishies or sea horses, sure!
But what I am most excited about is stuff like this: When there is enough suspended stuff in the water to visualize a flow field to recognize hydrodynamic principles, like in this case continuity.
Eddies in a jar
Rotating experiments in your kitchen.
Do you know those Saturday mornings when you wake up and just know that you have to do oceanography experiments? I had one of those last weekend. Unfortunately, I didn’t have a rotating table at hand, but luckily most of my experiments work better than the exploding water balloon time-lapse I showed you on Monday, so this is what I did:
I took a large cylindrical jar, filled it with water, stirred, let it settle down a little bit and then injected dye at the surface, radially outward from the center. Because the rotating body of water is slowed down by friction with the jar, the center spins faster than the outer water, and the dye streak gets deformed into a spiral. The sheet stays visible for a very long time, even as it gets wound up tighter and tighter. And you can see the whole eddy wobble a bit (or pulsate might be the more technical term) because I introduced turbulence when I stopped stirring. So pretty, the whole experiment. And so satisfying if you need a really quick fix of oceanography on a Saturday morning!
Watch the movie below if you want to see more. Or even better: Go play yourself! It’s easier than making one of those microwave mug cakes and sooo goooooood :-)
Hadley cell experiment
Cooling and rotation combined. (deutscher Text unten)
I can’t believe I haven’t blogged about this experiment before now! Pierre and I have conducted it a number of times, but somehow the documentation never happened. So here we go today! Martin and I ran the experiment for our own entertainment (oh the peace and quiet in the lab!) while the kids were watching a movie. But now that we’ve worked out some of the things to avoid (for example too much dye!), we’ll show it to them soon.
This is a classical experiment on general atmospheric circulation, well documented for example in the Weather in a Tank lab guide. The movie below shows the whole experiments, though some parts are shown as time lapse.
Für unsere eigene Unterhaltung haben Martin und ich dieses Experiment gemacht, während die Kinder mit allen Gruppen gemeinsam einen Film gesehen haben. Himmlische Ruhe im Labor! Aber wir werden es bald auch der Gruppe vorführen.
Dieses klassische Experiment zeigt, wie die großskalige atmosphärische Zirkulation in der Hadley-Zelle angetrieben wird und ich weiß auch schon, wie wir es beim nächsten Mal noch eindrucksvoller hinbekommen als bei diesem Mal!
Langmuir circulation, take 2
Attempt at mechanistic understanding of Langmuir circulation.
After complaining about how I didn’t have mechanistic understanding of Langmuir circulation recently, and how I was too lazy to do a real literature search on it, my friend Kristin sent me a paper that might shed light on the issue. And it did! So here is what I think I understand (and please feel free to jump in and comment if you have a better explanation).
First, let’s recap what we are talking about. My friend Leela (and it was so nice to have her visit!!!) and I observed this:
Long rows of foam on the surface of the fjord, more or less aligned with the direction of the wind (we couldn’t tell for sure since we were on a moving boat, and since it was a tourist cruise we couldn’t ask them to stand still for a minute to satisfy our oceanographic curiosity). Foam is – and so much makes sense – accumulated in regions of surface convergence.
But let’s see. The explanation that Kristin forwarded me is from the paper “Upper ocean mixing” by J.N. Moum and W.D. Smyth for Academic Press Encyclopedia of Ocean Sciences, 2000. According to my understanding of their paper and others, Langmuir circulation is related to Stokes drift.
Stokes drift is the small current in the direction of wave propagation that is caused by orbital wave motions not being completely closed (even though they are as a first order explanation, and that’s what you always learn when you think about rubber ducks not being laterally moved by waves).
As the wave orbital motions decrease with depth, there is a shear in the Stokes drift, with strongest velocities being found at the surface. At the same time, if there are small disturbances in the wind field, there are small inhomogeneities in the resulting surface current, hence shear that generates vertical vorticity.
The combination of horizontal and vertical vorticity causes counterrotating vortices at the ocean surface. The convergences between two adjacent rows concentrate the wind-driven surface current into a jet at the convergence, hence providing a positive feedback.
Voila: Stokes drift!
Water seeks its level.
A solution for the siphon problem of the fjord circulation experiment.
After having run the fjord circulation experiments for several years in a row with several groups of students each year, Pierre and I finally figured out a good way to keep the water level in the tank constant. As you might remember from the sketch in the previous post or can see in the figure below, initially we used to have the tank separated in a main compartment and a reservoir.
But there were a couple of problems associated with this setup. Once, the lock separating the two parts of the tank fell over during the experiment. Then there are bound to be leaks. Sometimes we forget to empty the reservoir and the water level rises to critical levels. In short, it’s a hassle.
So the next year, we decided to run the experiment in a big sink and tip the tank slightly, so that water would just flow out at the lower end at the same rate that it was being added on the other side. Which kinda worked, but it was messy.
So this year, we came up with the perfect solution. The experiment is still being run in a sink, but now a hose, completely filled with water, connects the main tank with a beaker. The hight of the rim of the beaker is set to the desired water level of the big tank. Now when we add water to the big tank, there is an (almost – if the hose isn’t wide enough) instant outflow, so the water level in the tank stays the same.
This way, we also get to regulate the depth from where the outflowing water is being removed. Neat, isn’t it?