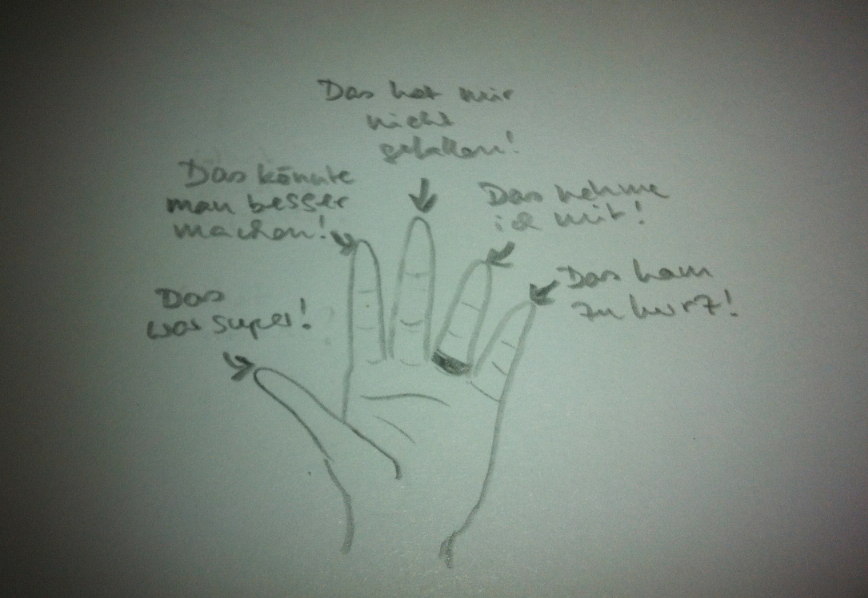
At my new job the quality management team regularly offers workshops that the whole team attends. One detail has repeatedly come up and I want to present it here, too. It is a new-to-me method to ask for specific feedback: The five finger method.
Category Archives: method
Clickers
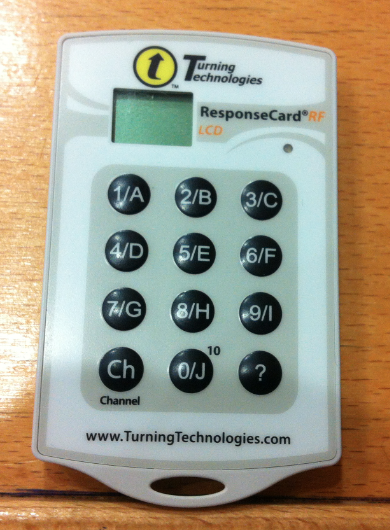
Remember my ABCD voting cards? Here is how the professionals do audience response.
Remember my post on ABCD voting cards (post 1, 2, 3 on the topic)?
I then introduced them as “low tech clickers”. Having never worked with actual clickers then, I really really liked the method. And I still think it’s a neat way of including and activating a larger group if you don’t have clickers available. But now that I have worked with actual clickers, I really can’t imagine going back to the paper version.
So what makes clicker that much better than voting cards?
Firstly – students are truly anonymous. With voting cards nobody but the instructor sees what students picked. But having the instructor see what you pick is still a big threshold. And to be honest – as the instructor, you do tend to remember where the correct answers are typically to be found, so it is totally fair that students hesitate to vote with voting cards.
Secondly – even though you as the instructor tend to get a visual impression of what the distribution of answers looked like, this is only a visual impression. The clicker software, however, keeps track of all the answers, so you can go back after your lecture and check the distributions. You can even go back a year later and compare cohorts. No such thing is possible with the voting cards unless you put in a huge effort and a lot of time.
Third – the distribution can be visualized in real time for the students to see. While with the voting cards I always tried to tell the students what I saw, this is not the same thing as seeing a bar diagram pop up and seeing that you are one out of two students who picked this one option.
If you read German – go here for inspiration. My colleague is great with all things clicker and I have learned so much from him! Most importantly (and I wish I had known this back when I used the voting cards): ALWAYS INCLUDE THE “I DON’T KNOW” OPTION. Especially when you make students to pick an answer (as I used to do) – if you don’t give them the “I don’t know” option, all you do is force them to guess, and that can really screw up your distribution as I recently found out. But more about that later…
P.S.: If I convinced you and you are now looking for alternatives to paper voting cards but can’t afford to buy a clicker system – don’t despair. I might write a post about it alternative solutions at some point, but if you want to get a couple of pointers before that post is up, just shoot me an email…
Concept maps II
A couple of pointers on how to use concept maps in class.
I recently presented concept maps as a tool both here and in a workshop I co-taught. And I was pleasantly surprised by how many people said that they were considering employing this tool in their class! So for those of you who might want to use it – here are some more pointers of how I used it. But beware – there is a whole body of literature on this method out there – these are only my own experiences!
So. Firstly – for concept maps to work in class you will have to introduce them the first time round you are using them. What I did was to start drawing a concept maps on the board, and have students tell me what else to add to it and how. I used “roses” as my example, with the question of how roses and people interact.
The way it developed was that students named different parts of roses (stems, petals, thorns, …) and that roses can both hurt people (with their thorns) and make people happy (because of the way they look, because of what they symbolize, because of the context they are presented in, …), that roses use up CO2 and produce O2 which is relevant for us, that roses need soil, that they might need fertilizer, that they become soil again when they die. As you can see, even this very simple example can already produce quite a complex concept map. And it gave me the chance to point out all the different features I wanted the students to include, but without me actually having to give away concepts and connections that I thought were important for the topic they were later working on.
Another very important point: Bring sheets of paper. There will already be enough resistance against trying this (and any) new method – don’t give the students the chance to boycott it because they don’t have anything to write on!
And most importantly – enjoy. It is really amazing to see concept maps develop over time, and it is even more amazing to see how students enjoy seeing their progress mapped out by their maps.
Concept maps
Drawing concept maps at the beginning, the middle and the end of the course.
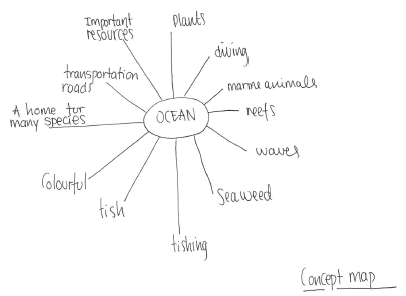
Using concept maps in teaching is something that I first tried last year in both the GEOF130 and CMM31 courses. The idea is that coming in, students typically don’t have a very good overview over the topics and concepts that are going to be covered in an introductory oceanography class, but that that will hopefully change over the course of the course.
The reason for trying to use concept maps in teaching was twofold.
Firstly, I wanted students to see how they gradually learned more and more about oceanography, and how they started to see connections between concepts that initially did not seem related.
Secondly, I am a big concept- or mind-map drawer whenever I need to study complex topics. For every big examination at university, be it in physics or ship-building or oceanography, I have drawn concept maps (even though at the time I didn’t know they were called that, and I was using them intuitively to organize my thoughts, rather than purposefully using them as a method). So why not try if it helps students study, too?
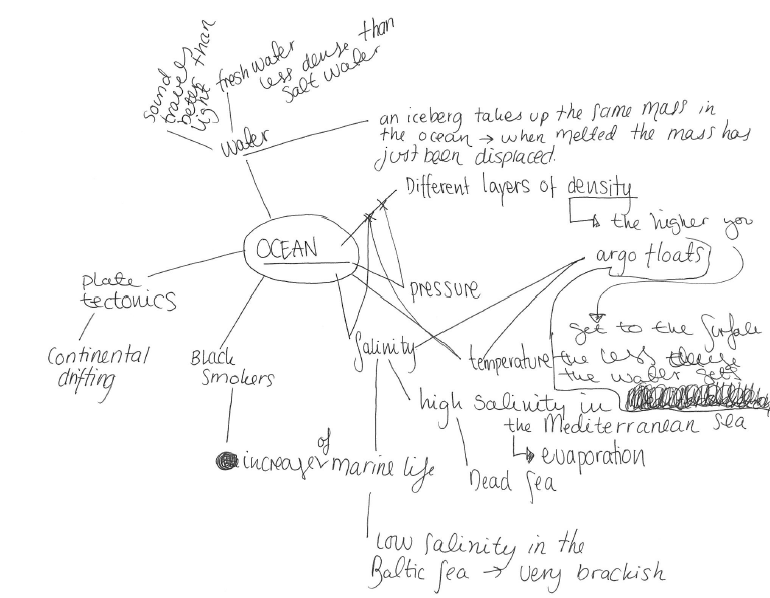
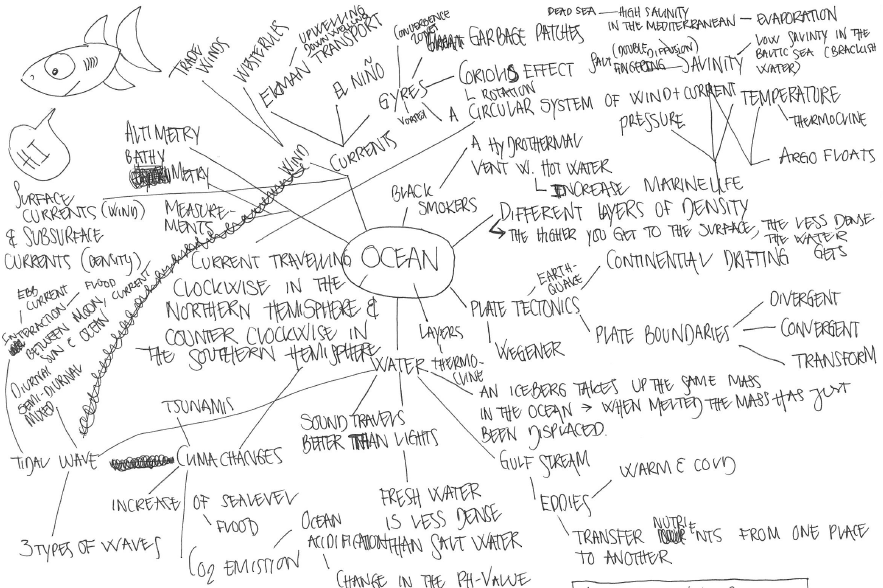
So how did it work in practice? Students were asked to draw concept maps during the first lecture, during a lecture some time half-way through the course, and at the end of the course. I collected and scanned the concept maps (out of my own curiosity) but students always had access to them and were encouraged to work on them any time they wanted to. Concept maps got impressively complex fairly quickly, and students reported that the maps helped them both to see their progress and to organize their thoughts.
For one of the courses, I used the concept maps as basis for the oral examination in the end (which was a lot more time-intensive to prepare on my part than I had imagined, and I wouldn’t do that again) and for part of the grade. For that, I had written down a list of concepts that I thought they should definitely have learned in my course, and a list of connection between concepts that I thought were crucial, and I just counted them and ticked them off on a list. Again, this was a lot of work and I am not sure if I would do it again. Not because it was so much work, but because I am not sure if by grading basically whether students went through the table of contents of the textbook and made sure all the headings were included in the map, I am encouraging just that and nothing more (although I actually don’t think this is what happened in either of the courses, but still, thinking of constructive alignment, basically naming concepts is not a learning outcome I want from my class).
So in conclusion, I would definitely use concept maps in teaching again (Isn’t it impressive to see the maps develop?), but not as a tool for evaluation.
P.S.: A big THANK YOU! to the student whose concept maps I am showing here (and who wishes to remain anonymous, but kindly agreed to let me use them as an example).
Examinations via Skype.
My experience with an examination via Skype.
In 2012, I taught two lectures via Skype at the University Centre of the Westfjords, while actually physically sitting in Norway. That experience is described in this post. When writing that post, I remembered that I also have experience in doing examinations via Skype. Except that experience was as a student, not as a teacher. In 2011, I defended a Master’s thesis at the University of Hamburg while, again, being physically located in Norway. How did that work out?
Defending a thesis via Skype is not that uncommon these days and actually a very easy, cheap and environmentally friendly way of defending when you no longer live in the place where you studied (or when you cannot travel there for other reasons). The way it worked in my case was that I had two opponents on the call, and since we were all to cheap for the upgrade, we could only hear each other and did not have a video connection. Which made it less stressful for me – when I am video-skyping, I tend to focus on my own video way too much, and thinking about how weird my hair looks or how I should sit in a specific position to block something behind me that would otherwise be visible. This tends to take away brain power from the topic I should be focussing on. Since I knew both their voices, there was also not an issue with knowing who was speaking at any given time (if you are ever on a call/skype with a group of people and there is even one person who doesn’t know everybody else really well: Please make sure to always announce who you are when you start speaking!).
I had to give a presentation, which I did by sending them the slides in advance and asking them to look at specific slides while I was talking about them. Thanks to my friend Nadine who let me borrow her apartment, I had a fast internet connection and privacy. What more do you need?
The only stressful time was waiting for them to call back after the exam when they were discussing my grade, but I guess that is a really stressful time no matter the setting.
So yes – examinations via Skype are actually a good option! No bad experiences here.
On drawing on the board by hand in real time
Drawing by hand on the board in real time rather than projecting a finished schematic?
It is funny. During my undergrad, LCD projectors were just starting to arrive at the university. Many of the classes I attended during my first years used overhead projectors and hand-written slides, or sometimes printed slides if someone wanted to show really fancy things like figures from a paper. Occasionally people would draw or write on the slides during class, and every room that I have ever been taught in during that time did have several blackboards that were used quite frequently.
These days, however, things are differently. At my mom’s school, many classrooms don’t even have blackboards (or whiteboards) any more, but instead they have a fancy screen that they can show things on and draw on (with a limited number of colors, I think 3?). Many rooms at universities are similarly not equipped with boards any more, and most lectures that I have either seen or heard people talk about over the last couple of years exclusively use LCD projectors that people hook up to their personal laptops.
On the one hand, that is a great development – it is so much easier to show all kinds of different graphics and also to find and display information on the internet in real time. On the other hand, though, it has become much more difficult to talk students through graphics slowly enough that they can draw with you as you are talking and at the same time understand what they are drawing.
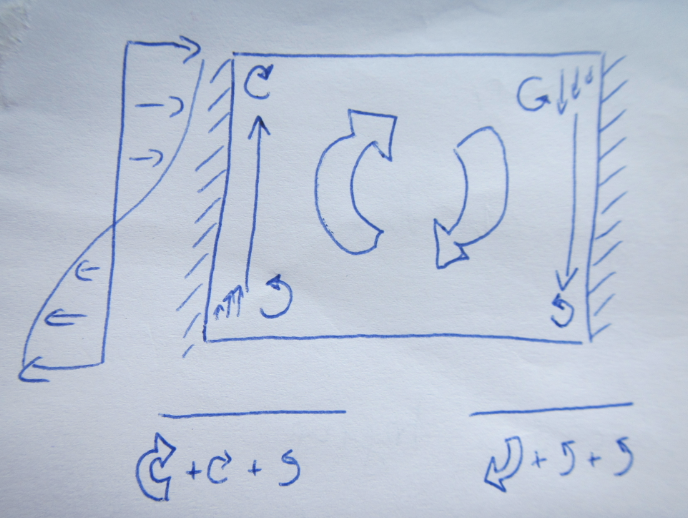
Sketch of the mechanisms causing westward intensification of subtropical gyres – here the “before” stage where the symmetrical gyre would spin up since the wind is inputting more vorticity that is being taken out by other mechanisms.
The other day, I was teaching about westward intensification in subtropical gyres. For that, I wanted to use the schematics above and below, showing how vorticity input from the wind is balanced by change in vorticity through change in latitude as well as through friction with the boundary. I had that schematic in my powerpoint presentation, even broken down into small pieces that would be added sequentially, but at last minute decided to draw it on the whiteboard instead.

Sketch of the mechanisms causing westward intensification of subtropical gyres – here the “after” stage – the vorticity input by wind is balanced by energy lost through friction with the western boundary in an asymmetrical gyre. Voila -your western boundary current!
And I am convinced that that was a good decision. Firstly, drawing helped me mention every detail of the schematic, since I was talking about what I was drawing while drawing it. When just clicking through slides it happens much more easily that things get forgotten or skipped. Secondly, since I had to draw and talk at the same time, the figure only appeared slowly enough on the board that the students could follow every step and copy the drawing at the same time. And lastly, the students saw that it is actually possible to draw the whole schematic from memory, and not just by having learned it by heart, but by telling the story and drawing what I was talking about.
Does that mean that I will draw every schematic I use in class? Certainly not. But what it does mean is that I found it helpful to remember how useful it is to draw occasionally, especially to demonstrate how I want students to be able to talk about content: By constructing a picture from scratch, slowly building and adding on to it, until the whole theory is completed.
Q&A pairs
Have students group in pairs, develop and answer questions.
It is really hard to come up with exam questions (or even just practice questions) that have the right level of difficulty so that students feel challenged, but confident that they will be able to solve the questions.
One way to develop those questions is to not actually develop them yourself, but have students develop them. So what I did in CMM31 was to ask students to group in pairs of two and develop questions that they thought would be fair exam questions. So they should be difficult enough that students have to think and employ a lot of what they learned during the course, but they should not be so difficult that they are impossible to answer.
You would think now that students would come up with really easy questions in order to trick you into giving an easy exam, wouldn’t you? There is a way to avoid this: After students have developed the questions in pairs (and made sure they know the correct answer), you can go around the room and have everybody share their question with the rest of the group (see? now having a difficult question makes you look smart!). The rest of the group answers the question, the person who asked the question has to say whether they are happy with the answers, or add to the answers if they feel like important aspects were not mentioned. Plus since there is an instructor in the room, he or she can always comment on the answers.
I usually say I give the students 10 minutes to come up with the questions (so 5 minutes each) and it then ends up being something like 6 or 7 minutes each. Since I’m sitting in the same room and listening in on the conversation, I can adapt the timing so it works best. Then it usually takes about 3 minutes to answer each of the questions so that everybody, including the instructor, is happy. So depending on the size of your group you might want to split the group into smaller groups so that exercise doesn’t take up too much time.
I find that using this Q&A pair method gives me a pretty good insight into what concepts students perceive as difficult, and how well the group as a whole can answer the questions. Since it is not the instructor asking the question, it seems to be much easier for students to throw in ideas (and I make sure that as the instructor I am not standing in front of the class, and when students start talking to me rather than the group, I point out who asked the question and that they should be talking to that person).
It does take up a lot of class time, but it is using class time for concepts that students feel are important and worth talking about.
Using Scientific Meetings to Enhance the Development of Early Career Scientists
Early online release of a paper on “Using Scientific Meetings to Enhance the Development of Early Career Scientists” by Urban and Boscolo.
Even though it has apparently been online for quite a while, I was only just recently made aware that the paper “Using Scientific Meetings to Enhance the Development of Early Career Scientists” by Ed R. Urban and Roberta Boscolo has been released online. I provided some comments on an earlier version, and I think this paper is a really good resource.
The paper contains many concrete steps that you can take to engage early career scientists in meetings, suggests activities meeting planners should consider and shows examples of those activities in practice. If you are in the process of planning a meeting, or if you are going to plan one soon – check it out!
Long-distance teaching.
My experiences with giving a lecture via Skype.
As I mentioned in yesterday’s post, I taught two lectures at the University Centre of the Westfjords, Iceland, in 2012 while physically being in Norway. How did that work out?
Teaching via Skype is a great option for when travel is not in the cards, be it for environmental, economic or other reasons. But I can tell you – it is a lot more stressful than teaching in person because you miss out on all of the non-verbal clues that tell you whether or not students are following. But I would do it again any time!
Why did it work out well? I think there were several important factors. In no particular order:
1) I over-prepared. I tend to be over-prepared, but in this case I put a lot of time into preparations, and I even talked through both lectures with a friend to make sure they were structured in a way that was easy to understand.
2) I had all the important key words on the slides. I always try to make sure to have key words on my slides so students can write down any weird technical terms that I might use and forget to explain, but in this case I defined everything on the slides.
3) I had an ally physically present in the class room. I think this was probably the most important reason for why things worked out really well and why my stress levels didn’t go through the roof when we realized that the internet connection was too weak for a two-way video. When departing for a research cruise from Reykjavik and visiting someone at their marine research institute, I happened to walk into the lab of the person who was responsible for the course, Hrönn. Hrönn and I clicked immediately and so while I was on Skype talking to the class, I knew I could rely on her to make sure things went well on the other end and to give me all the crucial information that would otherwise not have been communicated – if students got bored, if students looked like they did not understand, if everybody had left the room and left me sitting there, talking, if the connection was so bad people couldn’t understand me, etc.. Even though in the end she did not have to do anything, it helped enormously to know that she was there and would let me know if things went wrong.
4) I introduced myself to the students. I put up a picture of myself, talked about my background, where I was living, why I was interested in oceanography, why I was skyping in to give the lecture. During the lecture, I mentioned examples of how the topic was relevant to my personal life and told stories of my own experiences. Teaching via Skype adds a lot of distance – I tried to still be visible as a person and connecting on a personal level as much as possible.
5) I sent the slides before the call. This might seem obvious, but it really helped to know that they had the slides in Isafjördur already and that in the worst case if the internet were to break down, I could just deliver my lecture via speakerphone.
6) The slides were numbered with clearly visible numbers in one corner. Again, it might seem obvious, but it was really helpful to be able to say “go to slide 16” rather than having to go through “go three slides back, see the diagram? No? Then try going back one more. Still no diagram? I’m talking about the slide with ….”.
7) I made sure I could see the students. Since the internet connection was very slow, we could unfortunately not have a two-way video call for the whole duration of the lecture. But what we did was this: They showed my slides via a projector (thankfully they were numbered!), my video stream was initially, until the connection became too slow, shown on a laptop that was moved to face the class, and I could see the class via that laptop’s webcam. I could only see shapes and not distinguish facial expressions, but when I asked them to nod or shake their head in response to a question, I could see them respond. Next time, I would maybe even try using the ABCD card method or some other way to get more direct feedback in a Skype lecture.
8) We had tested the technology before. We knew what part of the classroom was visible via the webcam so we could ask the students to sit there, we had tested connecting via Skype, we had the telephone numbers on hand as a backup and we “met up” in Skype a couple of minutes before the lecture was supposed to start. But maybe this should go under the “over-prepared” heading.
All in all – I can’t stress the importance of preparation enough, and if you are to teach via Skype: Make sure you have someone in that class that you know and trust to be your ear on the ground to let you know if things don’t go the way they are supposed to.
And have fun! In the evaluation of that course, people explicitly mentioned my lectures as a highlight of the course, and I got really positive feedback. So teaching via Skype might be a bit of a hassle, but it is definitely possible to teach well via Skype.
Melting ice cubes – what contexts to use this experiment in (post 4/4)
What contexts can the “ice cubes melting in fresh water and in salt water” experiment be used in?
As you might have noticed, I really like the “ice cubes melting in fresh water and in salt water” experiment. Initially, I had only three posts planned on the topic (post 1 and 2 showing different variation of the experiment and post 3 discussing different didactical approaches to the experiment), but here we are again. Since I like this experiment so much – here are suggested contexts in which to use the experiment.
1) The scientific method.
No matter what introductory class you teach, at some point you will talk about the scientific method. And what is better than talking about the scientific method? Correct, having students experience the scientific method! This experiment is really well suited for that, because you can be fairly sure that most students will come up with a hypothesis that their experiment will not support.
2) Laboratory protocols.
For courses that include a laboratory component (like mine does), at some point you will have to talk about how to document your experiments. Again, since the hypothesis will typically not be supported by the results of the experiment, this is a great example on how important it is to write down the hypothesis and how you are planning on testing it, and then noting all the observations, not only the one that are along the lines of what you suspected. Also recording the little errors that occur along the way (“someone swapped the cups with the ice cubes, so we are not sure any more which one is which”) is very important, and if you have a class doing this experiment, you can be sure that at some point someone will make a mistake, not write it down and then be very confused afterwards. Great teaching and learning opportunity!
3) Different teaching methods.
If you are teaching about didactical models, this experiment is very well suited for this, too (see my post 3 on the topic and the Lawrence Hall of Science resource). Just have different people work on the experiment using the different methods and then discuss what and especially how people learned using those methods. The Lawrence Hall of Science resource mentions a fourth method (and I didn’t want to give the impression that I am recommending it, therefore I omitted it in my post 3) – the “read and answer” method, where students read about density, stratification and density-driven circulation and then answer questions like “what is density?” or “what is thermohaline circulation”. Again, not recommended for your oceanography class, but adding this option might be very relevant if you are teaching students or educators how to (not) teach.
4) Oceanography and climate
Yes, this is probably the main reason why you are doing this experiment in class. Now you can talk about salt in the ocean. About density-driven currents (and are there other things that drive currents apart from density differences?). About the importance of ocean currents, heat transport, the global overturning circulation, fresh water and many more.
Can you think of more contexts for this great experiment? Let me know! (Depending on your browser, you can comment on this post in the “leave a reply” box below or, if you don’t see that box, by clicking the speech bubble next to the title of the post.)
