Tag Archives: drawing

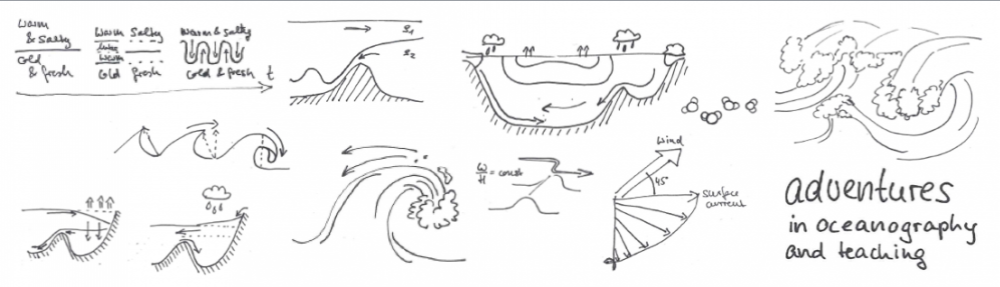
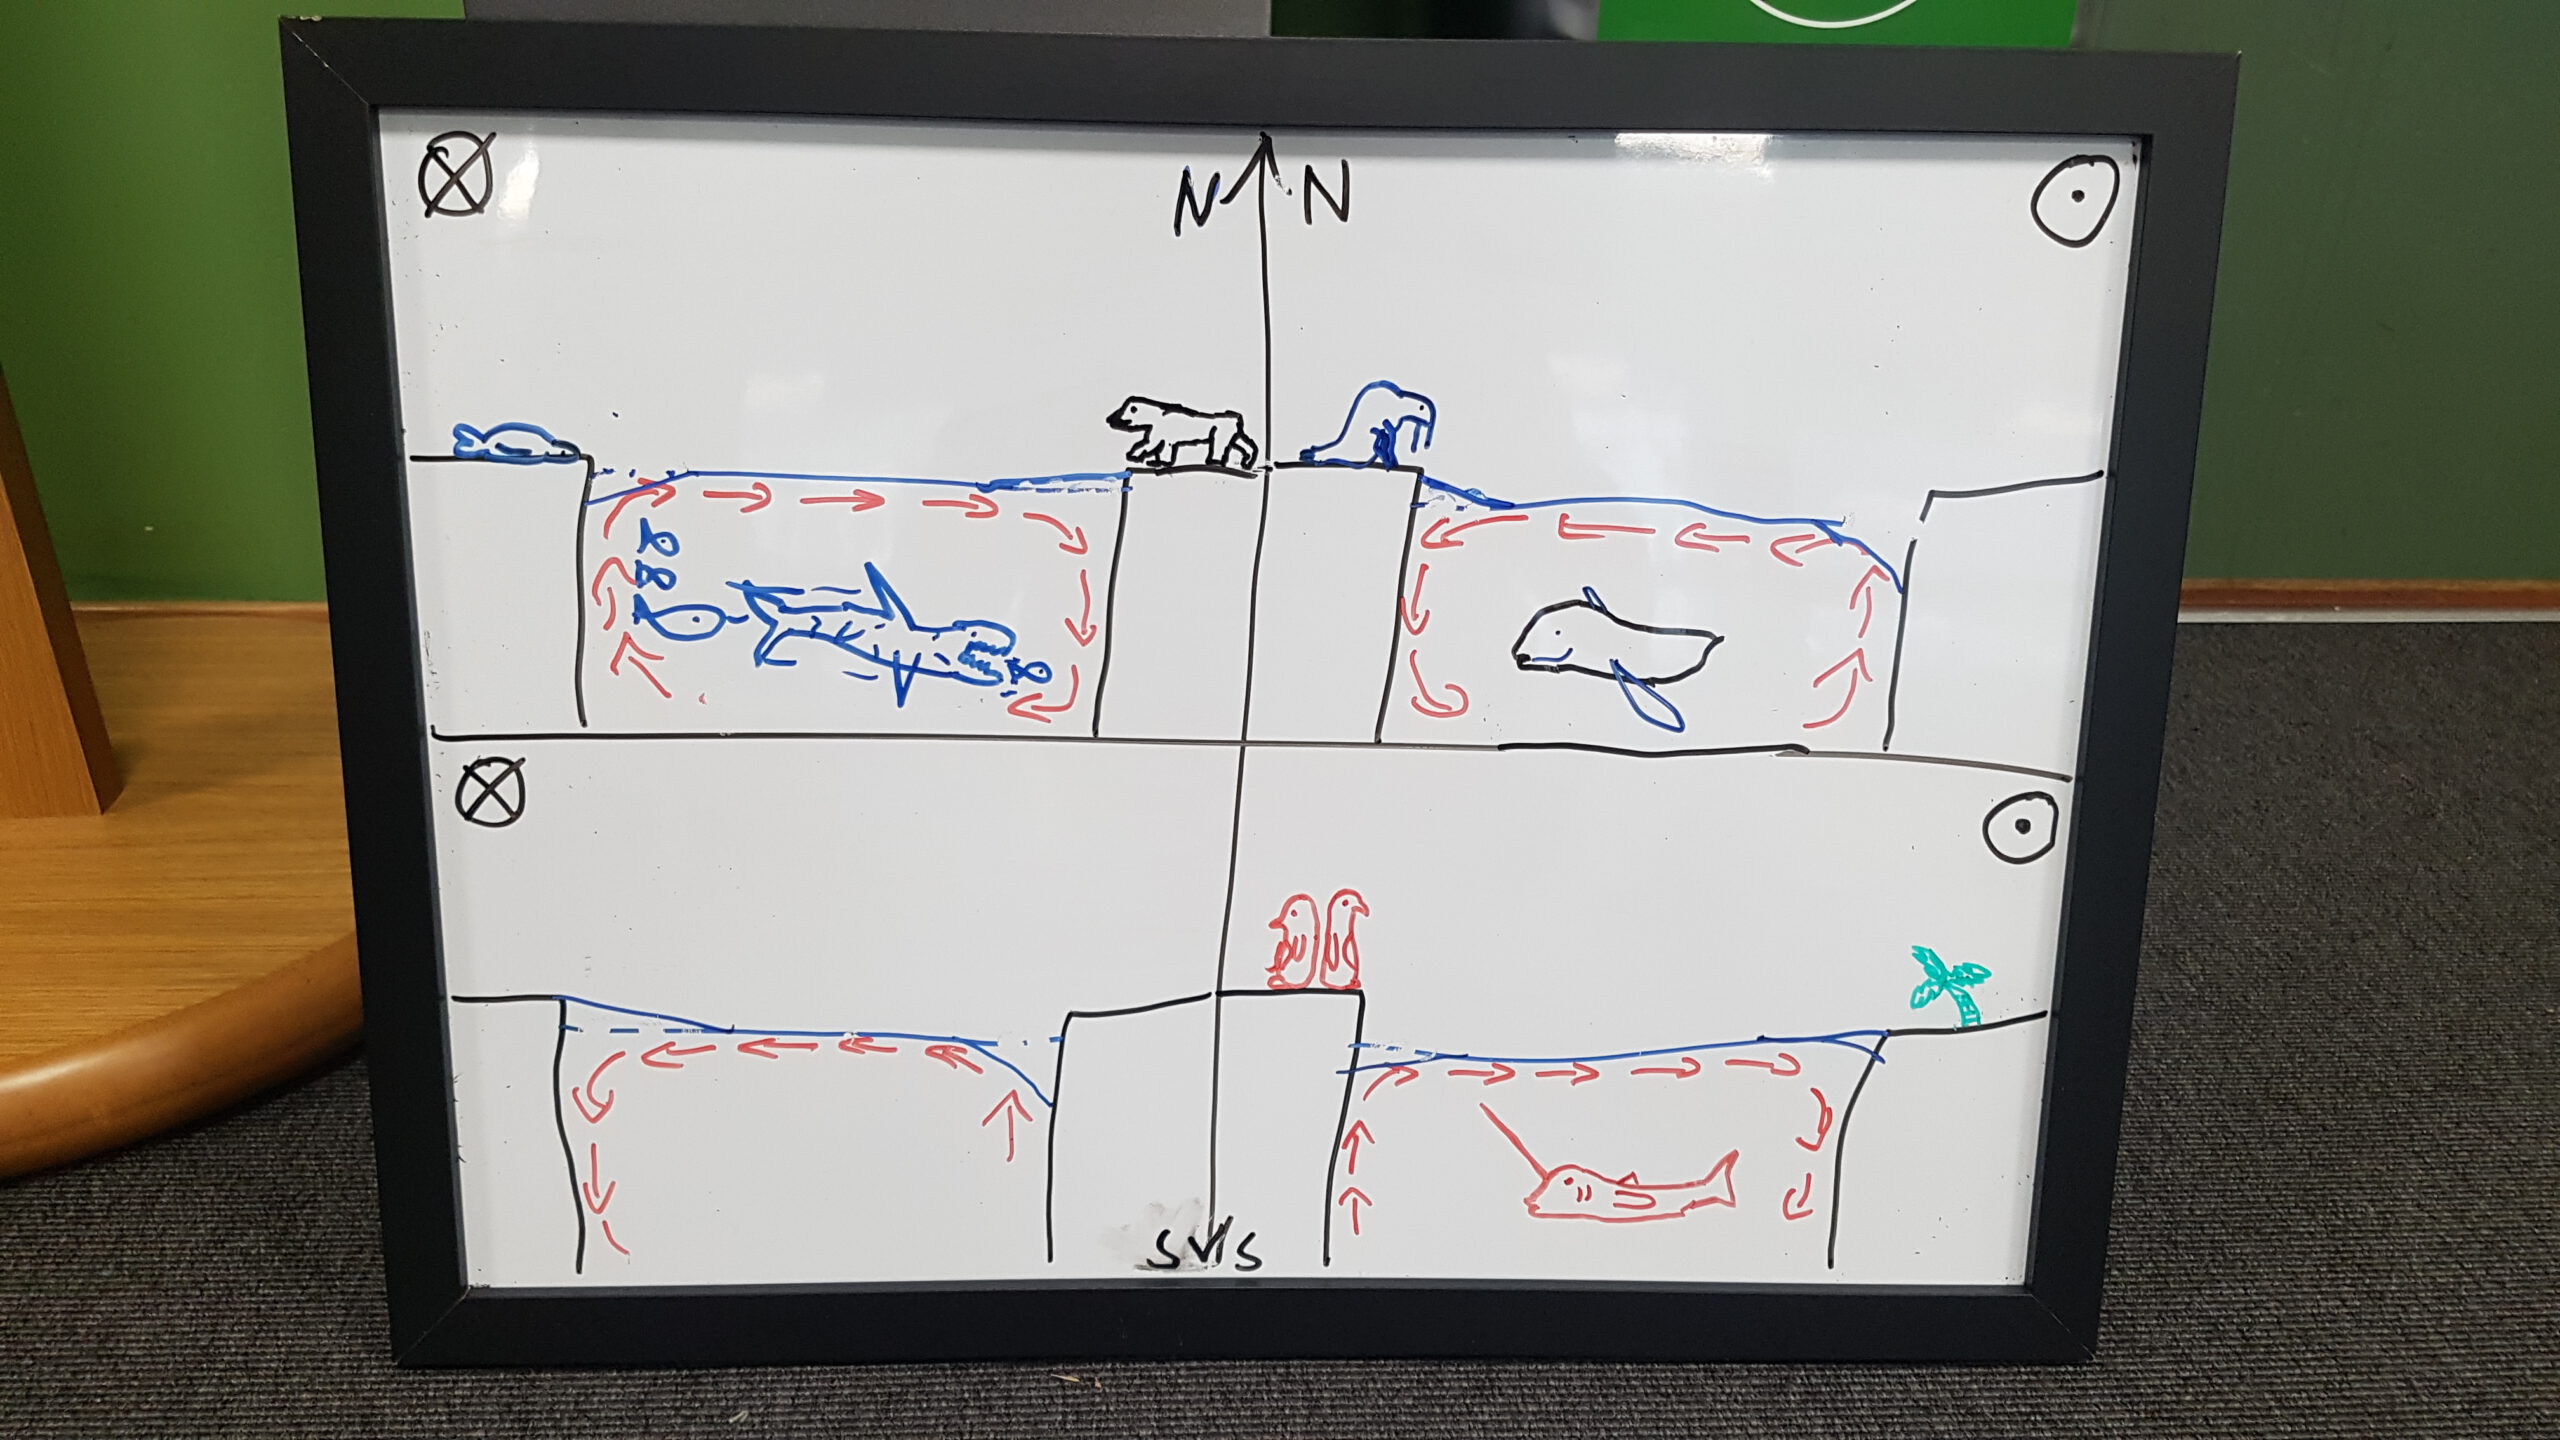
Article just published: Collaborative Sketching to Support Sensemaking: If You Can Sketch It, You Can Explain It

What a lovely Birthday gift (and seriously impressively quick turn-around times at TOS Oceanography!): Kjersti‘s & my article “Collaborative Sketching to Support Sensemaking: If You Can Sketch It, You Can Explain It” (Daae & Glessmer, 2022) has just come out today!

In it, we describe Kjersti’s experiences with using portable whiteboards that students use to collaboratively draw on in order to make sense out of new concepts or generate hypotheses for outcomes of experiments. It’s a really neat practice, you should check out our article and consider it for your own classes!

Kjersti also wrote a supplemental material to the article with a lot of details how exactly she implements the whiteboards and how she formulates the tasks (find it here).


Daae, K., and M.S. Glessmer. 2022. Collaborative sketching to support sensemaking: If you can sketch it, you can explain it. Oceanography, https://doi.org/10.5670/oceanog.2022.208.

Drawing to learn II

From reading the paper on “Drawing to Learn in Science” in my last blog post, I got browsing the literature and I came across the paper “Drawing to learn: How producing graphical representations enhances scientific thinking” by Fan (2015). There, even more reasons for why we should use drawing in instruction are given.

  • Drawing as a mode to observe the world. If we are asked to draw something, we need to look more closely at the thing we are drawing than if we were just asked to “look” at it. By drawing, for example, individual time steps of the breaking of a wave, will let you understand much more about the physics involved than just mindlessly staring at breaking waves over and over. However, for drawing to be effective as a mode to observe the world, the author points out that the opportunity to reflect upon the drawing needs to be provided, the drawing must be compared against reference knowledge and feedback needs to be given. Especially feedback is crucial, as several studies have shown.
  • Drawing as window into ongoing learning. By observing students draw or looking at finished drawings, we can learn a lot about what students think are important features of the topic of their drawing, and what are not. I have used concept maps to look at the kind of general overview my students had over a the whole field of oceanography, and also to show to them how their view of the field developed over the course of the course, but any drawing can tell you about student misconceptions if you look closely.
  • Drawing to solve problems. When looking at physics problems, if the problem isn’t given in form of a sketch already, the intuitive first step is to draw a sketch and annotate it with the relevant numbers rather than work with a paragraph of text. Drawing in this case is an important skill to solve problems.
  • Drawing to communicate. We have talked about this in the last post, but authors of this paper elaborate on a different very interesting aspect: How drawings follow social norms. The more a group of people draws together, the more similar their drawings become, and the fewer details are necessary to convey the same meaning. This is visible for example when looking at pictograms. The ones that I encounter where I live all make intuitive sense, however when traveling abroad, there are often funny signs where the meaning isn’t at all obvious to visitors…
  • Drawing to explain. The authors give the example of “how a bike pump works” as benefitting from being drawn rather than explained verbally. And as discussed in the last post, drawings are a great basis to convey ideas from.

So once more — drawing is even more important that I thought, and we should definitely provide more drawing opportunities in instruction!

Fan, J. (2015). Drawing to learn: How producing graphical representations enhances scientific thinking. Translational Issues in Psychological Science, 1 (2), 170-181 DOI: 10.1037/tps0000037

Drawing to learn

On the sciencegeekgirl blog (which, if you don’t follow it already, you should definitely start now!) there recently was a post on “drawing to learn sketching and peer instruction“. She there discusses the paper “Drawing to Learn in Science” by Ainsworth, Prain, and Tytler (2011). The authors give five reasons why students should draw in science classes:

  1. Drawing to enhance engagement. Drawing gets students engaged in a different way than “just” listening to lectures. Drawing creates emotions towards and involvement with the content you are drawing. Drawing enhances motivation to learn about the topic.
  2. Drawing to learn to represent in science. Drawing your own diagrams or representations means that you learn to better read other people’s diagrams, that you recognize what is important in different types of representations and how they work. I have often asked students to translate temperature and salinity profiles to T-S-diagrams, or vice versa, and seeing how differently the depth-axis is represented, for example, is really powerful.
  3. Drawing to reason in science. Drawing sketches of concepts helps understand them more deeply as now for example directions of forces or characteristic shapes of graphs have to be committed to paper.
  4. Drawing as a learning strategy. Converting a concept from its verbal description to a graphic representation makes it clear very quickly whether or not the concept has been understood or where there are still gaps in understanding.
  5. Drawing to communicate. By drawing, you make your own thoughts visible to the world in a very powerful way, and visualizations help making sure that you and your students or peers are talking about the same thing.

I’m a very visual learner myself, and I always draw everything in order to understand it (see, for example, the header of my blog if you need proof). But somehow I thought that was a learning strategy that everybody uses anyway, so it was really eye-opening to me to read all the reasons why we should use drawing more in instruction to support learning. And there are more reasons for drawing – stay tuned for the next blog post discussing a different paper!

Finally, sciencegeekgirl offers a way to bring the individual drawings back into a large classroom, by suggesting multiple choice questions of typical representations students might come up with, where students pick the one that most closely resembles their own drawing. It is probably not easy to come up with good answer choices the first time you use drawing in your classroom, but if you browse student answers or even collect them, it’ll get so much easier the next year… ;-)


Ainsworth, S., Prain, V., & Tytler, R. (2011). Drawing to Learn in Science Science, 333 (6046), 1096-1097 DOI: 10.1126/science.1204153

On drawing on the board by hand in real time

Drawing by hand on the board in real time rather than projecting a finished schematic?

It is funny. During my undergrad, LCD projectors were just starting to arrive at the university. Many of the classes I attended during my first years used overhead projectors and hand-written slides, or sometimes printed slides if someone wanted to show really fancy things like figures from a paper. Occasionally people would draw or write on the slides during class, and every room that I have ever been taught in during that time did have several blackboards that were used quite frequently.

These days, however, things are differently. At my mom’s school, many classrooms don’t even have blackboards (or whiteboards) any more, but instead they have a fancy screen that they can show things on and draw on (with a limited number of colors, I think 3?). Many rooms at universities are similarly not equipped with boards any more, and most lectures that I have either seen or heard people talk about over the last couple of years exclusively use LCD projectors that people hook up to their personal laptops.

On the one hand, that is a great development – it is so much easier to show all kinds of different graphics and also to find and display information on the internet in real time. On the other hand, though, it has become much more difficult to talk students through graphics slowly enough that they can draw with you as you are talking and at the same time understand what they are drawing.

Sketch of the mechanisms causing westward intensification of subtropical gyres – here the “before” stage where the symmetrical gyre would spin up since the wind is inputting more vorticity that is being taken out by other mechanisms.

The other day, I was teaching about westward intensification in subtropical gyres. For that, I wanted to use the schematics above and below, showing how vorticity input from the wind is balanced by change in  vorticity through change in latitude as well as through friction with the boundary. I had that schematic in my powerpoint presentation, even broken down into small pieces that would be added sequentially, but at last minute decided to draw it on the whiteboard instead.

Sketch of the mechanisms causing westward intensification of subtropical gyres – here the “after” stage – the vorticity input by wind is balanced by energy lost through friction with the western boundary in an asymmetrical gyre. Voila -your western boundary current!

And I am convinced that that was a good decision. Firstly, drawing helped me mention every detail of the schematic, since I was talking about what I was drawing while drawing it. When just clicking through slides it happens much more easily that things get forgotten or skipped. Secondly, since I had to draw and talk at the same time, the figure only appeared slowly enough on the board that the students could follow every step and copy the drawing at the same time. And lastly, the students saw that it is actually possible to draw the whole schematic from memory, and not just by having learned it by heart, but by telling the story and drawing what I was talking about.

Does that mean that I will draw every schematic I use in class? Certainly not. But what it does mean is that I found it helpful to remember how useful it is to draw occasionally, especially to demonstrate how I want students to be able to talk about content: By constructing a picture from scratch, slowly building and adding on to it, until the whole theory is completed.