Category Archives: hands-on activity (easy)

On how ice freezes from salt water

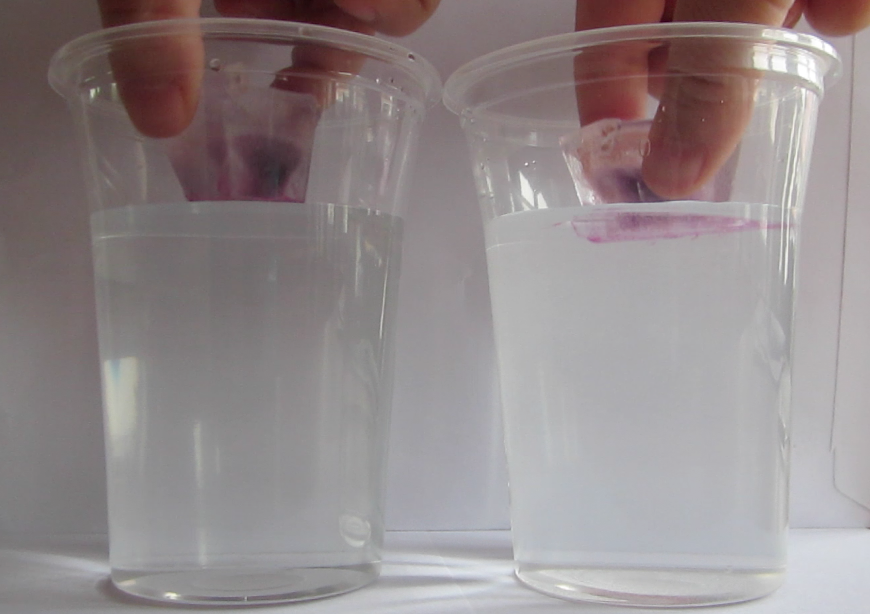
I’ve been wondering how to best show how sea ice freezes for quite a while. Not just that it freezes, but how brine is rejected. By comparing the structure of fresh water and salt water ice, one can get an idea of how that is happening (and I’ll write a post on that after we have done this experiment in class). But I accidentally stumbled upon a great visualization when preparing dyed ice cubes for the melting ice cube experiment (see this post) when all my ice cubes came out like this:

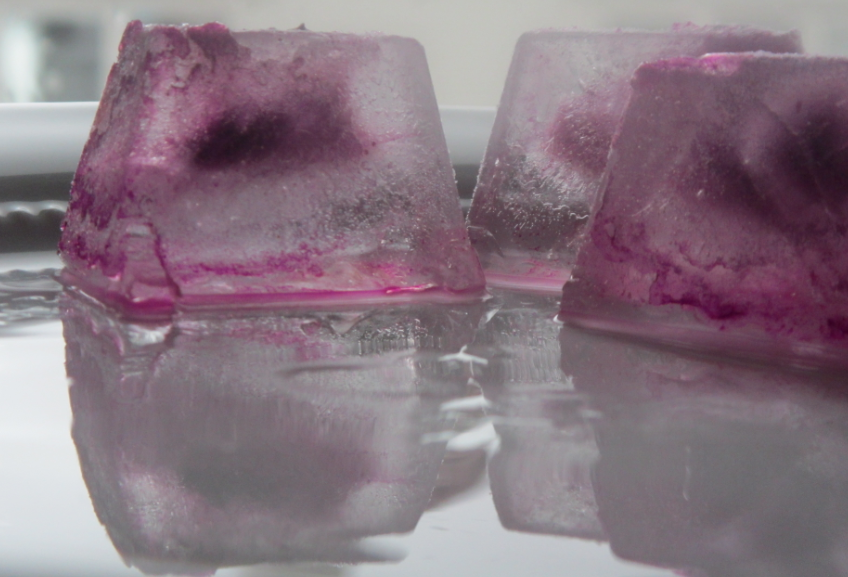
Ice cubes made from colored water.

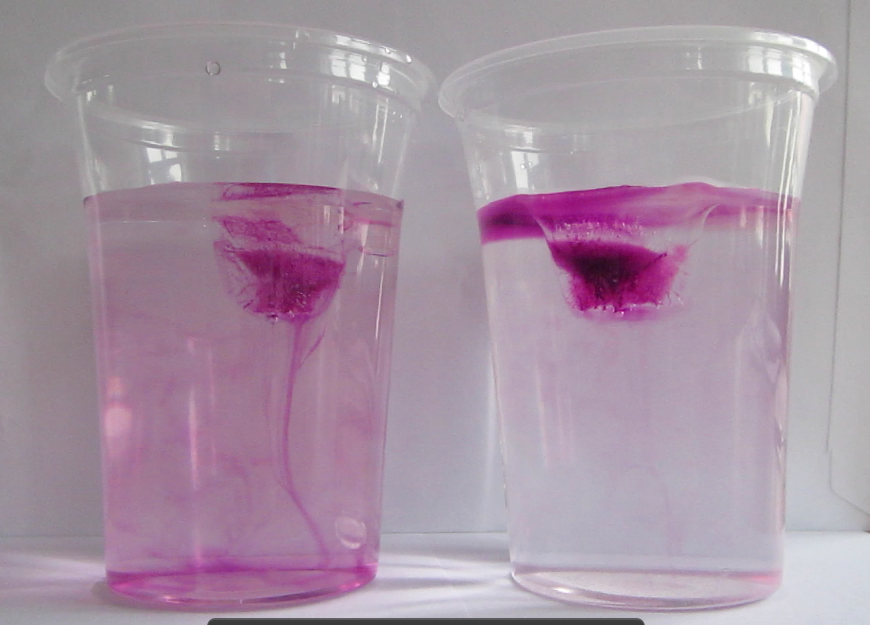
Instead of being nicely homogeneously colored, the color had concentrated in the middle of the ice cubes! And since the dye acts in similar ways to salt in the ocean (after all, it IS a salt dissolved in water, even though not the same as in sea water), this is a great analogy. It is even more visible when the ice cubes have started to melt and the surface has become smooth:

The dye has frozen out of most of the ice and been concentrated in the middle of the ice cube.

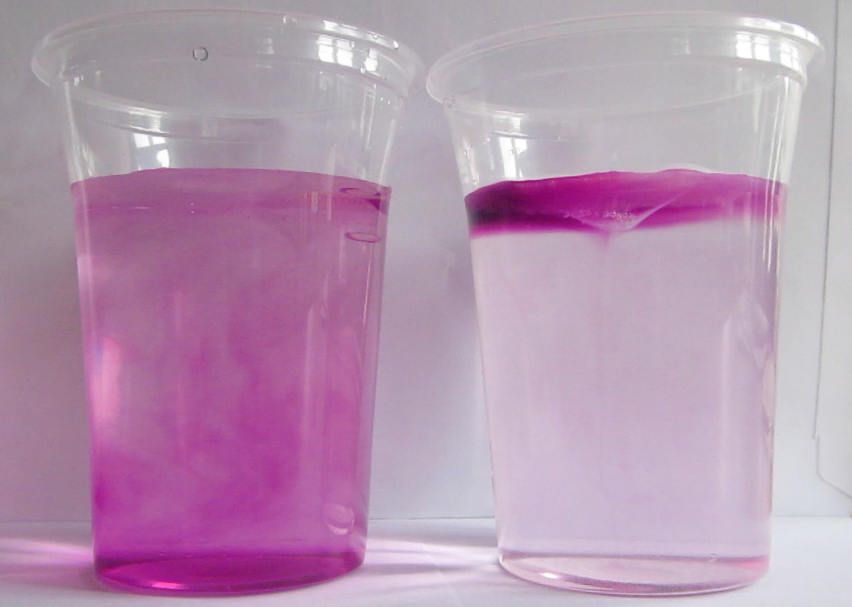
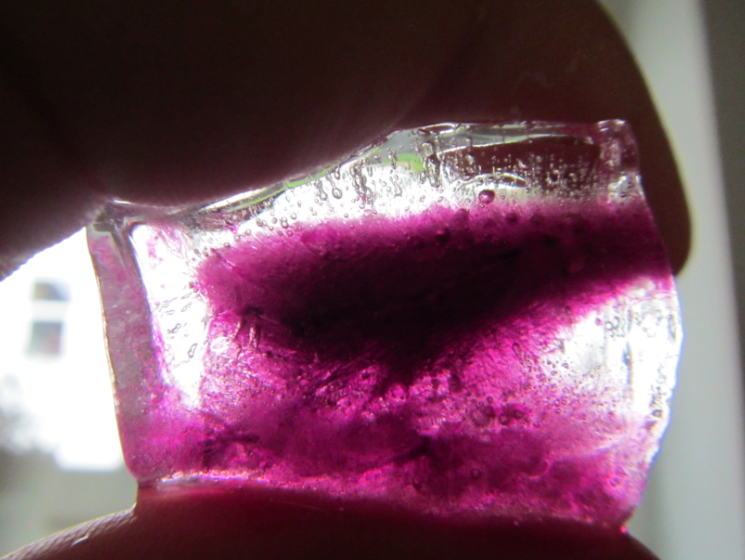
Clearly, when forming, the ice crystals have been rejecting the dye! In the ocean, due to cooling happening from above, ice would freeze downward from the surface, under the influence of gravity the brine channels would be vertical, and brine would be released in the water underneath. In my freezer, however, cooling is happening from all sides at once. There is a tendency for the dye to be rejected towards the bottom of the ice cube tray under gravity, but as ice starts forming from all sides, the dye becomes trapped and concentrated in the middle of the forming ice cube. Can you see the little brine channel leading to the blob of color in the middle?

I must say, when I first took the ice cubes out of the freezer I was pretty annoyed because they weren’t homogeneously colored. But now I appreciate the beauty of the structure in the ice, and you can bet I’ll try this again with bigger ice cubes!

Ice cubes melting in salt water and freshwater (post 1/4)

Experiment to visualize the effects of density differences on ocean circulation.

This is the first post in a series on one of my favorite in-class experiments; I have so much to say about it that we’ll have to break it up into several posts.

Post 1 (this post) will present one setup of the experiment, but no explanations yet.

Post 2 will present how I use this experiment in GEOF130, including explanations.

Post 3 will discuss how this experiment can be used in many different setups  and

Post 4 will discuss different purposes this experiment can be used in (seriously – you can use it for anything! almost…).

So, let’s get to the experiment. First, ice cubes are inserted into two cups, one filled with fresh water at room temperature, the other one filled with salt water at room temperature. In this case, the ice cubes are dyed with food coloring and you will quickly see why:

Ice cubes are added to cups filled with water at room temperature: fresh water on the left, salt water on the right.

As the ice cubes start to melt, we can see the dyed melt water behaving very differently in fresh water and salt water. In fresh water, it quickly sinks to the bottom of the cup, whereas in salt water it forms a layer at the surface.

Melt water from the ice cube is sinking towards the bottom in the cup containing fresh water (on the left), but it is staying near the surface in the cup containing salt water (on the right).

After approximately 10 minutes, the ice cube in freshwater has melted completely, whereas in salt water there are still remains of the ice cube.

After 10 minutes, the ice cube in the fresh water cup has melted completely (left), whereas the one in the salt water cup is not gone completely yet (right).

Why should one of the ice cubes melt so much faster than the other one, even though both cups contained water at the same (room) temperature? Many of you will know the answer to this, and others will be able to deduce it from the different colors of the water in the cups, but the rest of you will have to wait for an explanation until the next post on this topic – we will be doing this experiment in class on Tuesday and I can’t spoil the fun for the students by posting the answer today already! But if you want to watch a movie of the whole experiment: Here it is!

(Yes, this really is how I spend my rainy Sunday mornings, and I love it!)

– I first saw this experiment at the 2012 Ocean Sciences meeting when Bob Chen of COSEE introduced it in a workshop “understanding how people learn”. COSEE has several instructions for this experiment online, for example here and here. My take on it in the “on the Cutting Edge – Professional Development for Geoscience Faculty” collection here.

Forskningsdagene are almost upon us

Preparations for experiments to be shown at the science fair “forskningsdagene” are under preparation.

Forskningsdagene, a cooperation between research institutes and schools, science centers and other educational places, will take place next month in Bergen. This year’s topic is ocean and water, and many interesting activities are being planned.

Today Kjersti, Martin and I met up to test which dyes and liquids are best suited for internal wave experiments. Since the target group on at least one of the days are school kids, conventional substances (like potassium permanganate as dye or white spirit as one of the liquids) might not be the best option. Instead, we went for food coloring and vegetable oils.

Oil_and_water

One of our tests – a four layer system with water (green), vegetable oil (turquoise), white spirit and air.

In the end, we came up with many different options and decided that we should probably bring all the bottles so people can play with them, too.  And we should found a company that sells these bottles as nerdy paper weights. I have had one on my desk for a year now and I’m still playing with it, as is pretty much everybody who comes to my office.

IMG_4506

Our selection of different combination of colors and water and oils for internal wave experiments.

But of course the best option wasn’t mentioned until afterwards: Oil and balsamic vinegar! Thanks, Jenny!

Sea surface height and ocean depth

A hands-on activity in which students use real data to find similarities in the sea surface height and the ocean depth along satellite tracks.

In yesterday’s GEOF130 class, we explored how the sea surface height and the ocean depth are related. All we needed: Sticky notes, scissors and this work sheet (as always – leave a comment if you want more details!).

PostIts

When I went and bought the scissors, the lady asked me if I was a kindergarden teacher. I said no, I teach at the university. And that was the end of that conversation…

And even more on density

My favorite experiment. Quick and easy and very impressive way to illustrate the influence of temperature on water densities.

Today in the “introduction to oceanography” (GEOF130) we conducted my favorite experiment ever:

Cold water in one of the small bottles is dyed blue, hot water in the other small bottle is dyed red. Both are inserted in a jar filled with lukewarm water (movie below). Isn’t this beautiful? And you just wait until we add salt into the equation (and the water) next week!

More on density

Extremely simple experiment to illustrate the effect of density differences.

At room temperature, will coke cans float or sink in freshwater? And how about coke light?

coke_cans

Soft drinks in cans. Who knew you could do science with them?

Btw, this experiment is only easy if you are in a country where you can get the right soda brand both in normal and in light version in cans. Thanks to Anna’s friends for importing them for me! As we found out – Red Bull does not work.

Tasting sea water

Hands-on activity on sea water salinity

In the first lecture of the “introduction to oceanography” GEOF130 course 2013, we investigated water samples from four different regions: The Mediterranean, the tropical North Atlantic, the Baltic and Arctic sea ice. Just by tasting their different salinities (40psu, 35psu, 10psu and 5psu, respectively) students figured out which of the samples came from which region. And now what influences salinity in the ocean?