Category Archives: demonstration (easy)

Refraction of light in water – coins and lenses.

More on what water can do to light.

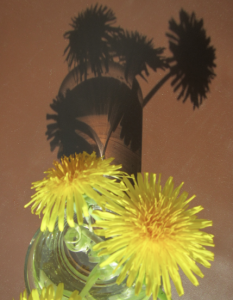
Remember my fascination with dandelions? Just to remind you:

IMG_6559

Dandelions.

Especially in combination with coins and water droplets, dandelions are a source of nearly endless entertainment:

IMG_6540

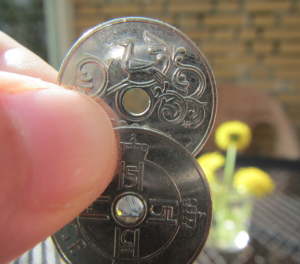
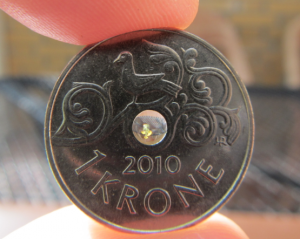
1 NOK with water droplet in the hole in the middle.

See how much cooler 1 NOK coins become only by adding a little water?

IMG_6544

The upper coin does not have water in the hole, the lower one does. See the difference?

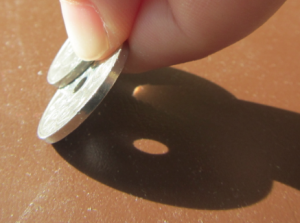
Here the same two coins in the sun – see how the water droplet in the coin in the back focusses the light whereas the empty hole in the coin in the front is just a hole?

IMG_6550

The coin in the foreground doesn’t have water in the hole, the one in the back does. See how they affect light differently?

Pretty cool stuff. And in the next post I’ll show you what this very effect does out in the real world!

IMG_6555

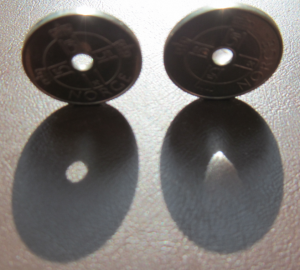
Left coin without water, right coin with water in the hole in the middle.

Guest post: The mystery of the cold room

Guest post by Kristin Richter!
Today I’m excited to bring to you a guest post from Innsbruck, Austria, written by my friend Kristin Richter. Kristin ran the oceanography lab in Bergen before I took over, and she is a total enabler when it comes to deciding between playing with water, ice and food dye, or doing “real” work. Plus she always has awesome ideas of what else one could try for fun experiences. We just submitted an abstract for a conference together, so keep your fingers crossed for us – you might be able to come see us give a workshop on experiments in oceanography teaching pretty soon! But now, over to Kristin.
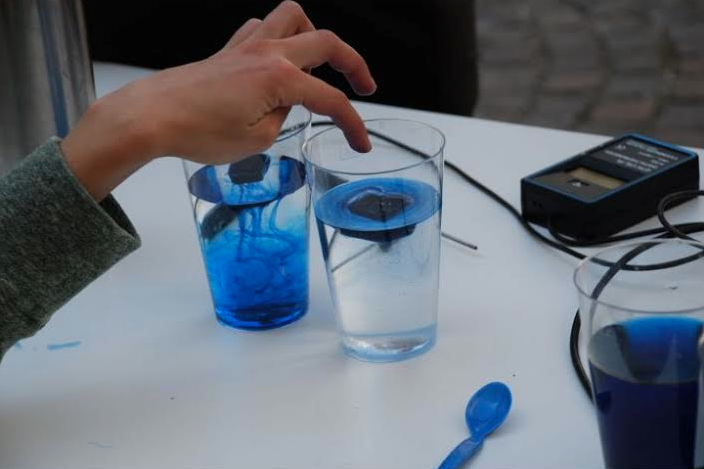
A little while ago, I made an interesting experience while presenting some science to students and the general public on the “Day of Alpine Science”  in Innsbruck using hands-on experiments. Actually, my task was to talk about glaciers but being a physical oceanographer I felt like I was on thin ice. Well, glaciers, I thought, hmmm … ice, melting ice, going into the sea, … sea, … sea ice! And I remembered how Mirjam once showed a nice experiment to me and some friends about melting ice in fresh and salt water. And suddenly I was all excited about the idea.
To at least mention the glaciers, I planned to fill two big food boxes with water, have ice float (and melt) in one of the tanks and put ice on top of a big stone (Greenland) in another tank filled with water to show the different impact of melting land ice and sea ice on sea level. Since melting the ice would take a while (especially on a chilly morning outside in early April) I would have enough time to present the “actual” experiment – coloured ice cubes melting in two cups of water – one with freshwater, and the other one with salt water.
Screen Shot 2014-04-24 at 12.17.01

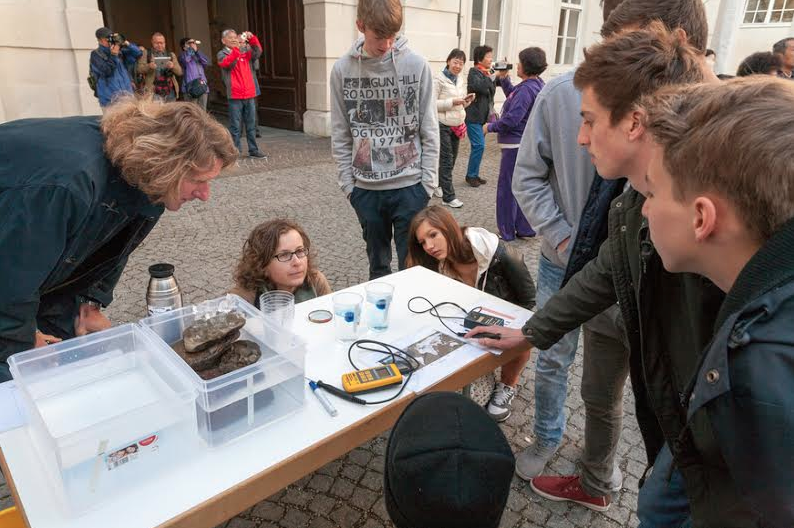
Melting ice. A comparison of sea ice and glaciers melting’s impact on sea level, ice cubes melting in fresh and salt water on the right. Photo by “Forschungsschwerpunkt Alpiner Raum”, University of Innsbruck.

As we expected many groups with many students, I needed a lot of ice. I told the organizers so (“I need a lot of ice, you know, frozen water”) and they said no problem, they will turn on their cooling chamber. The day before, I went there and put tons of water into little cups and ice cube bags into the chamber to freeze over night.The next morning – some hundreds of students had already  arrived and were welcomed in the courtyard – I went to get some ice for the first group. I opened the cooling chamber,… and froze instantly. Not so very much because of the cold temperature but because I was met by lots of ice cube bags and little cups with… water. Like in LIQUID WATER! Cold liquid water, yeah, but still LIQUID! Arrrghhhh, my class was about to begin in a few minutes and I had NO ICE. “Ah, yes”, volunteered the friendly caretaker, “come to think of it, it is just a cooling chamber!”I started panicking, until a colleague pointed out the Sacher Cafe (this is Austria after all) and their ice machine across the road. I never really appreciated ice machines, but that one along with the friendly staff saved the day. Luckily, I brought some colored ice cubes from at home – so I was all set to start.

Screen Shot 2014-04-24 at 12.16.50

Ice melting in fresh water (left) and salt water (right). Photo by “Forschungsschwerpunkt Alpiner Raum”, University of Innsbruck.

And the station was a big success, the students were all interested, asked many questions and were excited about the colored melt water sinking and not sinking. :-)  I even managed to “steal” some students from the neighboring station of my dear meteorology colleagues. That was something I was particularly proud of as they could offer a weather station, lots of fun instruments to play with and a projector to show all of their fancy data on a big screen. (Actually, I also abandoned my station for a while to check out their weather balloon.)

Anyway, I had a lot of fun that day and could definitely relate to Mirjams enthusiasm for this kind of teaching. I can’t wait for the next opportunity to share some of those simple yet cool experiments with interested students. I will bring my own ice though!


Vacuum pumps

What else did you think we tested them on?

Before using my parents’ vacuum pumps (“vacuum” being used in a loose sense of the word…) on water in this post, we obviously had to make sure they worked. And can you guess how you best test that?

Really. What else did you think we tested them on?

Happy Easter!

Bubble size depending on pressure

More playing with a vacuum pump.

In this post, we talked about how decreasing the pressure on water can make dissolved gases come out of solution. But what happens if you suddenly increase the pressure again?

This is the same movie as in the previous post, just to remind you of what we did: We decreased the pressure and then let it increase again quickly (you hear the ssssssssssss when the air is streaming back into the bottle).

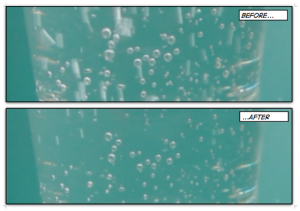
So to show it in one picture, what happens is basically this:

bubbles2

Bubbles under low pressure (top) and high pressure (bottom). Screen shots from the movie above.

The lower the pressure, the larger the bubbles. When you let the air back into the bottle, the bubbles collapse (or shrink, if you want to be less dramatic).

That reminds me that I really need to film a movie similar to the one below where one can clearly see how bubble size increases the closer the bubbles come to the surface.

Isn’t it awesome to realize that the more you film and write and think about adventures in oceanography and teaching, the more ideas you have of what you want to do next? :-)

Gases dissolved in water

A simple experiment to show that there are really gases dissolved in water.

Luckily, my parents like to play at least as much as I do. So when I got back from doing “real science” in Bergen the other day, they picked me up at the airport and showed me their latest toys: Vacuum pumps! [edit: Not really vacuum vacuum, but at least much lower than atmospheric pressure. And apparently those pumps are sold with the original purpose of re-sealing wine bottles]

Vacuum pumps are great to show that there are actually gases dissolved in water, because oftentimes that isn’t all that obvious. But when the pressure of the head space of a bottle is decreased, gases that were happily dissolved under atmospheric pressure start coming out of solution.

bubbles

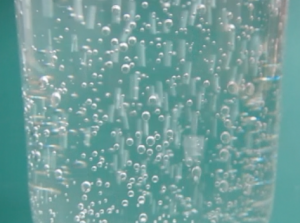
Gas being bubbled out of water by decreasing the pressure of the head space of the bottle.

Here is a comparison of normal tap water and sparkling water (sparkling water obviously containing much more dissolved CO2 than tap water, hence more bubbling).

Lava

Don’t you just love lava lamps?

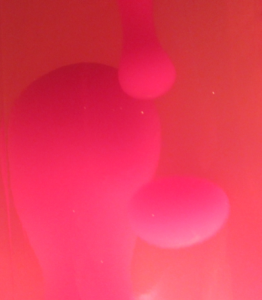
I got a lot of weird looks when I excitedly told people about two years ago that I had just bought a lava lamp. But what’s not to love about them? Plus they are great for teaching. These days kids don’t know them any more, so they are missing out on a really nice mental image of how convection works. Be it in the Earth’s mantle or in the ocean…

IMG_6106

“Lava” flow.

When I moved into my new flat, for the first week I only had an inflatable air bed and my lava lamp in my living room (oh, and a lot of boxes of course). So I have spent a lot of time looking at how the flow changes over time.

Today, all I want to share is this 9 minute movie of the lava lamp. But I’m working on a post where I’m discussing the temporal development of the flow. Sounds interesting? Stay tuned! :-)

An overturning experiment (part 3)

By popular demand: A step-by-step description of the overturning experiment discussed here and here.

I wrote this description a while ago and can’t be bothered to transfer it into the blog format, so please go and find a .pdf here. This .pdf addresses young children in the first part, and grown-ups in the second part.

Have fun and if you use this in school or with your own kid, please let me know how it went! I love to hear from my readers! :-)


An overturning experiment (part 2)

How to adapt the same experiment to different levels of prior knowledge.

In this post, I presented an experiment that I have run in a primary school, with high-school pupils, in a Bachelor-level course and in a Master-level course. The experiment itself was run identically in all cases. However, the introductions, explanations and discussions about it obviously differed.

For example, in the primary school, I introduced this experiment by showing pictures of lions and penguins and other animals that the pupils knew live in warm or cold climates, and we talked about where those animals live. In the end this aimed at how temperatures are a lot colder at the poles than at the equator. This is the differential heating we need for this experiment to work. While this is something that I felt the need to talk about with the primary school kids, this can be assumed as a given with older students (or at least that is the assumption that I made).

With the university-level courses, one of the points that I made sure came up during the discussion are the limitations of this model. For example that we apply both heating and cooling over the full depth of the water column. How realistic is that? Or the fact that we heat at one end and cool at the other, rather than cooling on either end and heating in the middle?

With the university-level courses, we could also discuss other features that we could see during the experiment. Remember this image, for example?
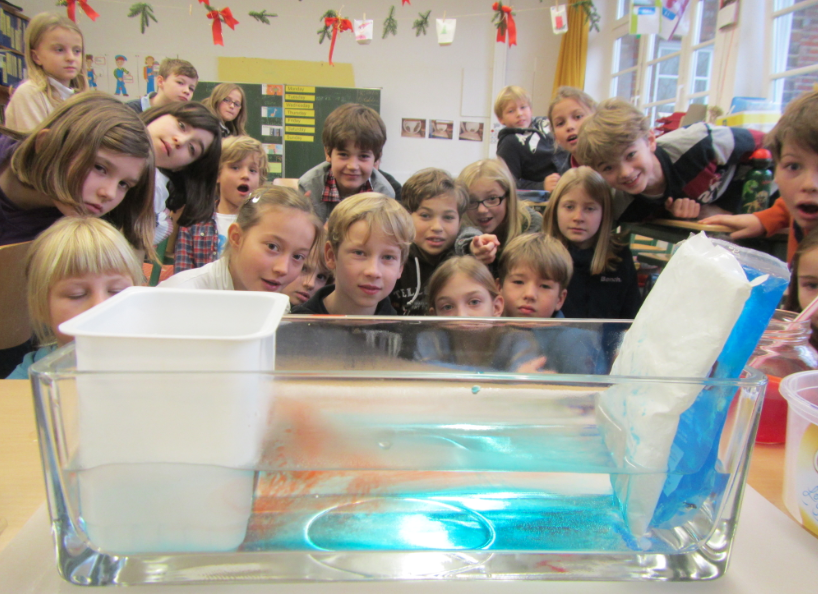
IMG_3214

The thermal conveyor belt experiment.

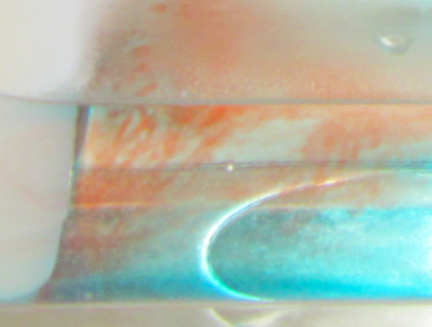
Let me zoom in on something.
IMG_3214_2

Curious features in the thermal conveyor experiment. Do you know what this is about?

Do you see these weird red filaments? Do you think they are a realistic part of the thermal circulation if it was scaled up to a global scale?

Of course not. What we see here is salt fingering (oh, and did you guys notice that a diagram of how salt fingering works is displayed at the very top left of my header? I wasn’t exaggerating when I said that it was my favorite process ever!). So basically, this is a process that is caused by the different diffusivities of heat and of the red dye. And while it is pretty large scale in our small tank, you cannot scale it up just like that when talking about the real ocean. And it is also really difficult to get rid of salt fingers for this experiment, in fact I haven’t yet managed. But I am open to suggestions! :-)

Another point that I would talk about with university-level students that I would probably not bring up with primary school kids (- although, why not if I had more time than just those 45 minutes per class?) is that ocean circulation is driven by more than just differential heating. Even when just considering the density-driven circulation, that is additionally influenced by changes in salinity. Put that together with wind-driven circulation and we are starting to talk about a whole new level of complicated…

But anyway. My point is that even primary school kids can benefit from doing this kind of experiments, even if what they take away from the experiments is not exactly the same as what older students would take away.

One of the main messages the primary school kids got seems to have been that you need to take curd cheese beakers for your warming element (look here for some reports (in german)). Not exactly my main message, but at least they were very observant of how the experimental setup was designed ;-)
An overturning experiment

A simple experiment that shows how the large-scale thermally-driven ocean circulation works.

Someone recently asked me whether I had ideas for experiments for her course in ocean sciences for non-majors. Since most of the experiments I’ve been showing on this blog were run in the context of Bachelor or Master oceanography-major courses, she didn’t think that the experiments were as easily transferable to other settings as I had claimed.

So here is proof: You can do pretty complex experiments with non-university level students. To prove my point, let’s go to a primary school.

IMG_3219

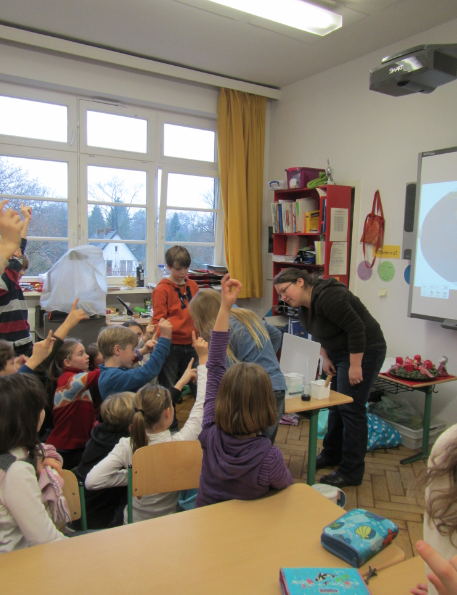
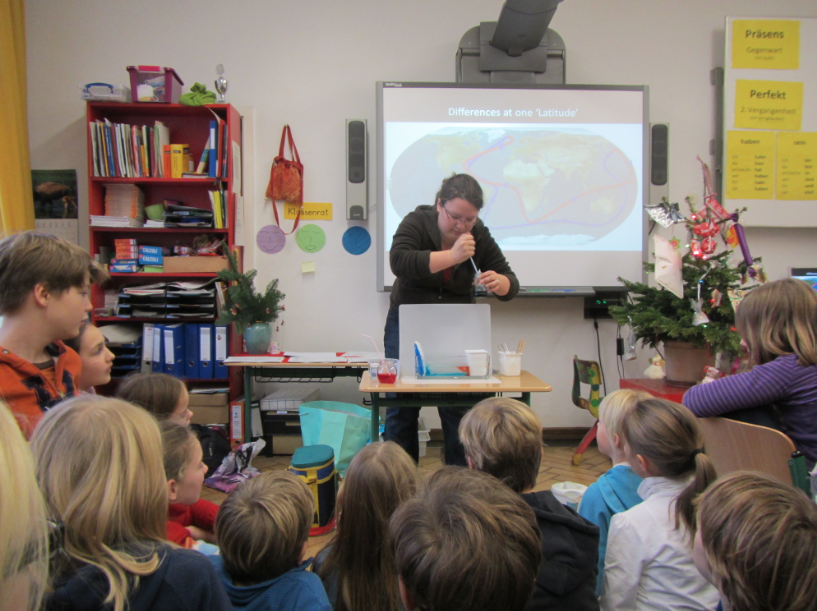
Experimenting with a primary school class.

The experiment we are running here is the global (thermal) conveyor belt. In a long and narrow tank filled with water, a heating and a cooling element are inserted at either end. Dye is added onto the elements to visualize the flow of water.

IMG_3212

Adding dye to visualize the thermally driven flow in the tank.

In the image above you see that there is something blue near the bottom of the tank, and I am adding red dye to the other side. Blue is used to track the cold water and red to track the warm water (intuitive color-coding goes a long way, no matter how old your students are!)

IMG_3214

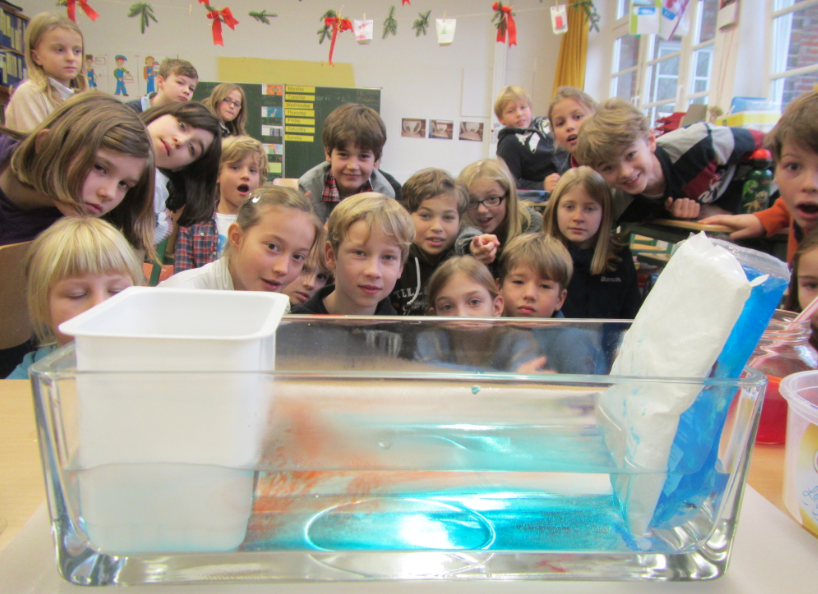
The experiment as seen by the teacher.

What you see here is the cold blue water sinking to the bottom of the tank and spreading, and the warm red water rising to the water’s surface and spreading there. As the warm water reaches the cooling pads, it gets cooled, becomes denser and sinks. Similarly, the cold water reaching the warming pads becomes less dense and rises, closing the loop.

Modeling the Denmark Strait Overflow

Ha, this is a bad pun. We are modeling the Denmark Strait Overflow – but in a non-numerical, small-scale-and-playdough kind of way.

More than a year ago, Kjetil and I ran that experiment with a group of high-school students and when writing a post about a much more sophisticated version of this experiment I realized I never documented this one in the first place. So here we go!

IMG_3604_small

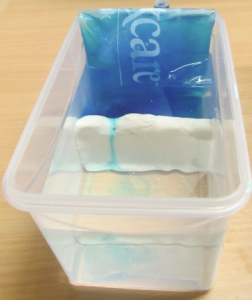
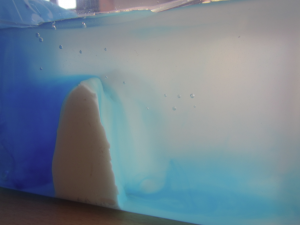
The set-up: Tupper ware with a modeling clay ridge (“let’s call it Greenland-Scotland-Ridge”) across, filled with water to a level above the ridge, cooled with a sport’s-injury cooling pack in “the North”.

Dye is added to the “northern end” of the tank (i.e. the end where the water is being cooled by a sport’s injury cooling pack). As the water cools, it becomes denser and fills up the reservoir on the northern end until it spills over the clay ridge.

IMG_3592_small

The overflow. See the blue, dense reservoir on the left and the dense water spilling over the ridge.

This is a very simple demonstration of how overflows actually work.

IMG_3607_small

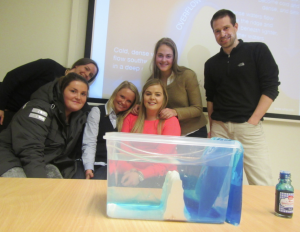
Kjetil, his Master student Eli and some of the high-school students. Can you see the sketch of the Denmark Strait Overflow on the slide in the background? (Plus, for everybody who is interested: This is the food coloring I have been using right there in the front right!)