Tag Archives: wave generation

Internal waves in a bottle

Internal waves are shown in simple 0.5l bottles.

Waves travel on the interface between fluids of different densities and the phase speed of those waves depends on the density difference between the two fluids.

MVI_4505_02

MVI_4505_03

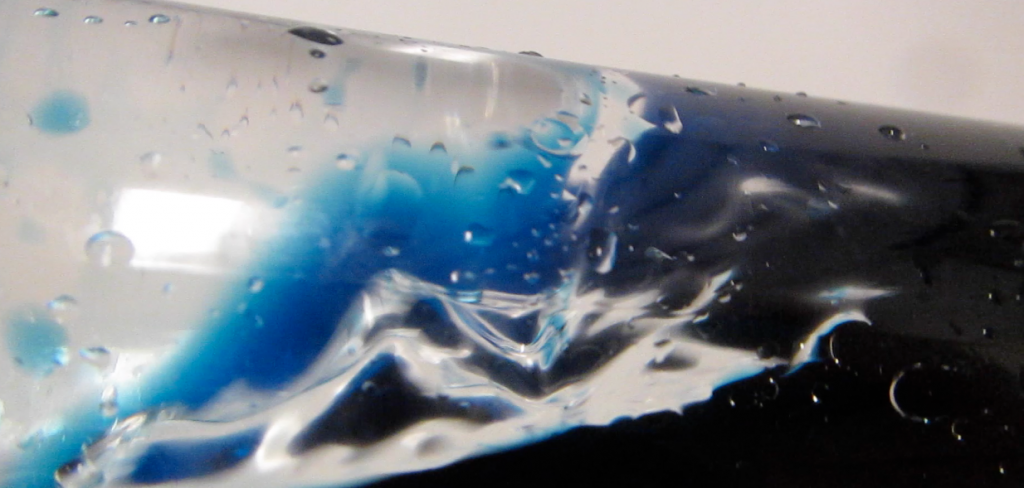
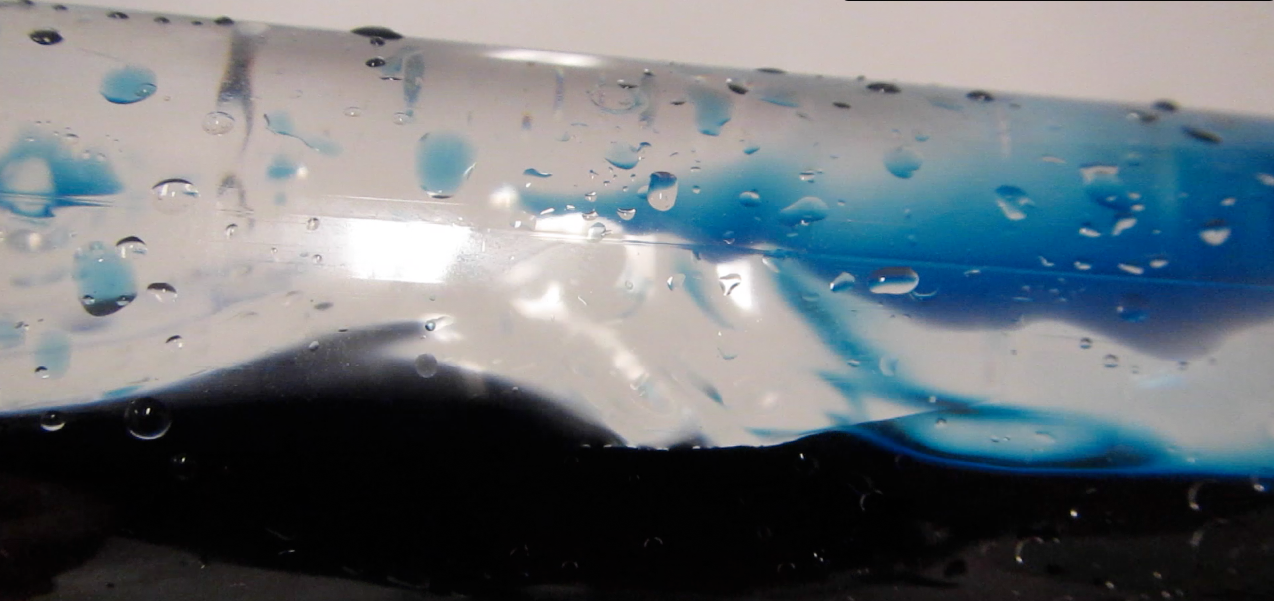
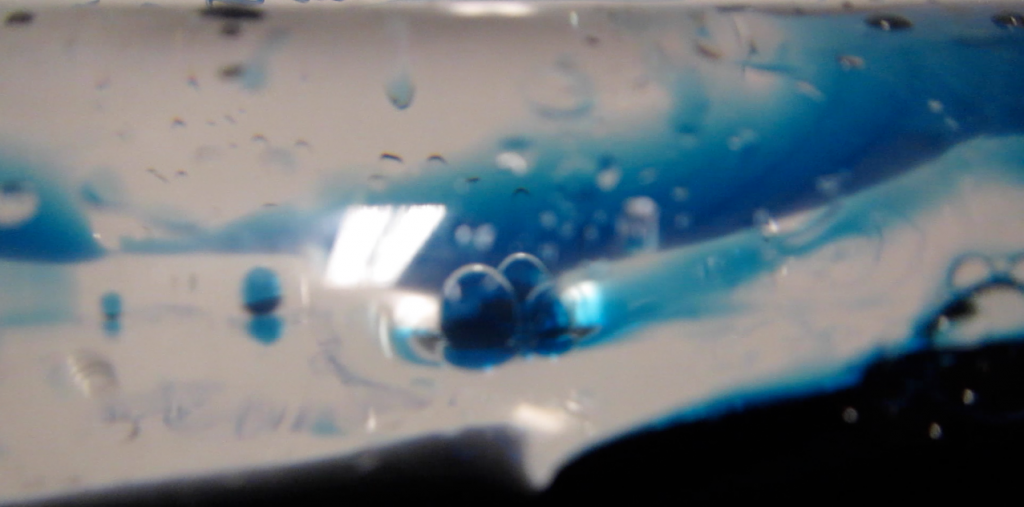
Internal waves on the interface between water (dyed blue) and white spirit.

The simplest way to demonstrate this in class can be seen below – two 0.5l plastic bottles are used, one half-filled with water, the other one filled with half water, half vegetable oil. Waves can very easily be excited by moving the bottles, and it is clearly visible that the waves at the interface between water and oil are a lot slower than the ones on the interface between water and air.

For showing this experiment to larger audiences when people can’t play with the bottles themselves, it really helps to color either the water or the oil layer for greater contrast. See here for different combinations that we tried in connection to forskningsdagene in Bergen.

Incidentally, those internal wave bottles are a great toy. If you don’t have one available but wish you had a paper weight as awesome as mine on your desk, here is a movie for you:

A fetching title for a fetching photo post

Using a photo from one of my research cruises to explain the formation of wind waves.

Wind waves are (surprise coming up!) waves generated by wind that blows over the ocean’s surface. The size of those waves depends on several factors: The strength of the wind, the length of time the wind has been blowing over the ocean, and  the fetch (hence the “fetching” title of this post).

The bow of the RRS James Clark Ross and wind-generated waves in front of it. Note how the wind direction is indicated by the wind vane, and how parts of the ocean are sheltered by the ice floes.

The image above is really useful to talk about this concept. We see the wind direction indicated by the wind vane at the bow of the RRS James Clark Ross. In the lee of the ice floes, the water surface is smooth because it is sheltered from the wind. As the distance from the ice flow, and hence the fetch, increases, waves start forming again. In addition to the formation of waves, you can see how waves are refracted around the ice floe.

I like teaching using photos that I took myself. Not only do they show exactly what I want to talk about, but they also give me the opportunity to share stories, like in this case of how I took that photo when we were first approaching the ice edge in the Greenland Sea and then the next day there was ice everywhere and we saw polar bears. Not only are students entertained and fascinated hearing personal stories of experiences at sea, I think that those stories are also important for helping students form their self-image as an oceanographer, and for motivating them to stick it out through the tougher spots of their studies. Stories also help students remember content, and story telling is a very useful method in the classroom (but more about that in another post).