Tag Archives: phase velocity

One of the most difficult #friendlywaves I’ve ever gotten! Did I get it right?

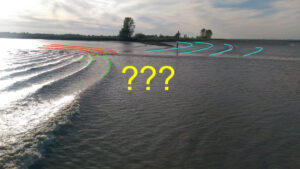
Florian sent me a #friendlywave — a wave picture he took, with hopes that I might be able to explain what is going on there. And this one had me puzzled for some time!

This is what the picture looks like:

What I knew about it: Florian was on the ferry from Wisschafen to Glückstadt, crossing the Elbe river.

In the picture itself, there are several features that jumped at me. First, drawn in with the lightblue line below: A sand bank parallel(-ish) to the island’s coast line.

Then, the ship’s wake (shown in red) breaking right near the ship (orange) and turning (green) and breaking (yellow) where it runs on the sand bank.

Florian wrote he was watching the ferry’s wake and noticed something curious: There seemed to be a shallow part, where the waves suddenly became a lot faster! And could I explain what was going on?

Looking at the picture, there were two possibilities for what he might have meant (and, spoiler alert — I completely jumped on the wrong one first!).

Below, I’ve drawn in the part of the wake that is running on the shallow sand bank (green) and how those wave crests continue on the other side of the sand bank (red). I’ve also drawn in some mystery wave crests in blue. Those were the ones I chose to focus on first, since Florian had written that he noticed waves behaving weirdly and suddenly becoming much faster. So if we are talking fast, we are talking really fast, right?

So how do we explain those blue wave crests?

There is a limit for the maximum speed a wave can have. That limit depends on the wave’s wave length: The longer a wave, the faster it travels. In deep water, i.e. water deeper than 1/2 the wavelength, the wave travels at this maximum speed (see green lines in the plot below).

But as it comes into shallower water, it gets slowed down (see black lines in the plot below — those are just a quick sketch, there are complicated equations to calculate it exactly).

In shallow water, i.e. water that is smaller than 1/20th of the wave length, the phase speed only depends on water depth: The shallower the water, the more the wave is being slowed down (see the red lines in the plot below).

Sorry about the quality of the sketch — I don’t have Matlab or anything else useful on the computer I have available right now, so I drew this in ppt! Take it with a pinch of salt, but qualitatively it’s correct!

So looking back at Florian’s picture, for the blue waves to have been caused by Florian’s ferry, there are two options:

A) they would have to have wave speeds faster than the ferry’s bow wave and wake

B) the ferry would have had to come from the direction of the island, so that the waves propagated in that deeper channel behind the sand bank before the ferry made its way around the sandbank.

Option A is impossible, because wakes travel at maximum wave speed (similar to a sonic boom in the atmosphere, where sound is travelling at maximum speed, forming a cone with the air plane at its tip, only here it’s a 2D version, a V-shaped wake with the ship at its tip). So if the wake is traveling at maximum speed already, then the blue waves can’t go faster than that.

For option B, looking Florian’s ferry up on a map, I saw that that ferry goes around a small island, which is the land you see in his picture. But a quick glance at the map shows that even though the sand bank seems to end where the ship would have had to have gone in order to create those waves, the island is still very much in the way. So this can’t be the solution, either.

This map is published at http://map.openseamap.org under a CC BY-SA 2.0 license

So let’s take another good look at the original picture.

Remember those wave crests that I marked in blue? Well, upon closer inspection it turns out that they are tidal gullys and not wave crests! (Which is what Florian confirmed when I asked whether he remembered the situation) Guess I have been barking up the wrong tree all this time!

So back to the wave crests that I marked in red:

What we see here is exactly the depth dependence of the phase speed that I plotted above. Right at the sand bank, the water is shallowest and waves are slowed down (we see that both in the green wave crests that seem to be falling back and start breaking as they get closer to the sand bank [both indicating that the water is getting shallower], and in the red wave crests right at the sand bank). But as the water gets deeper again on the far side of the sand bank (which depth measurements in the map above seem to confirm), the phase speed picks up again (as it has to — see my plot above) and the wave crests accelerate again. Hence we have the weird phenomenon of waves suddenly speeding up!

Very long explanation, I know, but still pretty cool now that we solved it, right? I love #friendlywaves — if you have any mystery wave pictures, please do send them my way! :-)

Christina’s #FriendlyWaves from Panama!

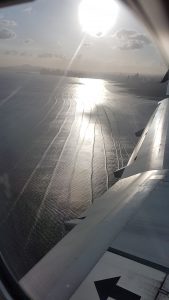
Christina writes on Twitter: “#wavewatching from a plane, approaching #Panama. @Meermini, do you know what causes those regular ‘wrinkles’?” and how could I resist writing a blog post about what I think might be the explanation?

Below is the picture Christina shared on Twitter.

Picture by Christina Oettmeier @sulfurium

What I think we see here are basically two wave fields: The regular “wrinkles” and then a lot of small crinkle.

The small crinkle are boring: local, wind-generated waves. They are not what Christina asked about.

But the wrinkles are swell: Waves that were formed in a storm far, far away and that have propagated here over a long distance. While propagating from the area where they were formed to the beach where Christina took these pictures, the waves got sorted by wave length. The longer a wave, the faster it propagates in deep water. So long waves from a distant storm will arrive first, and over hours or days the wave lengths of the waves arriving at the beach will get shorter and shorter. The wave lengths we see here seem to be about the height of the high rise buildings we see on the shore. The highest high rise in Panama is almost 300m high, so the wave lengths might not be that long, but at least 100+m.

Why do they look so “wrinkly” and not like proper breakers? When waves are in water that is shallow compared to their wave length (so say water depth would be less than 50m for these waves if we assume they are 100m long, which I think are both reasonable estimates), their shape changes from the normal sine-shape that they would show in deep water, to steep crests and loooong troughs. You might have observed waves with this shape for example in the very shallow waters of a beach on the wadden sea coast or any other beach with a really small slope, where waves look like sausages or pool noodles that are being shoved onto the beach (compare for example to pictures in this post).

What makes me confident that we are really seeing what I’ve just described above? Mainly that I can see the interaction of the waves with the sea floor. If you look at the pic above, do you see the area where the waves bend? That’s where the water is shallower. I’ve tried to sketch that below: The red lines are — in first approximation — the wave crests (I’ve only drawn in every third or so for clarity). Red dashed lines are kinda the second approximation of the wave crests: Those are the deformations that I want to talk about. And those deformations are caused by a shallower area, which I’ve drawn in with the green dashed line. This little submerged headland slows that part of the waves down that runs above it (because in shallower water the wave’s speed only depends on water depth, not on wave length any more), but not the rest of the waves that propagate towards the beach with the straight crests intact.

It’s even easier to be confident when we look at the next two pictures that Christina shared with me. Now we are a little closer to the beach and can see the area where the waves break and where it is shallow enough that the wave lengths drastically decrease (since the waves are slowed town more and more the closer they come to the beach, waves that are further out are still faster and can catch up to waves in front of them). This is very typical for the parts of a beach where the depth changes rapidly.

Picture by Christina Oettmeier @sulfurium

And on the next pic, we see even more clearly that the waves change from pool-noodle shaped offshore to breaking waves close to the beach:

Picture by Christina Oettmeier @sulfurium

In case you don’t see what I am trying to point out, here an annotated version of the pic above. Green dashed circles: Smudges on the window, or possibly reflections on the window, but nothing to do with the waves. Red circles: Here we see foam on the back side of breaking waves, so there was definitely some wave breaking going on here. And blue circle: Cool structures in the flow of water that is retracting downslope from the beach, back into the ocean.

So much for now. No idea if that made any sense to anyone except myself. Please let me know! :-)

Phase and group velocities in deep and shallow water

When Tor came to visit me in GFI’s basement lab a couple of days ago, he told me about an experiment he had seen in Gothenburg in the seventies. So Elin and I obviously had to recreate it on the spot. Therefore today, we are comparing phase- and group velocities in deep and shallow water!

Waves are excited by means of an oscillating, hand-helt beer can, curtesy of the beer brewing club at GFI. The experiments are filmed and wave lengths and phase velocities are determined from the videos, which is a lot easier than measuring them directly while the experiment is being run.

Shallow water waves

For shallow water, we are using a water depth of 10 cm. Waves are very easy to see and phase velocities are equally easy to measure.

There is another experiment on (standing) shallow water waves being run at GFI the year before students attend GEOF213, which I described back in 2013.

Deep water waves

For deep water waves, we use a water depth of 42.5 cm (the exact number only matters when the tank filling is also used to fiddle with the dead water experiment, as I had been when the idea for this experiment came up).

Typical wave lengths that are easy to do are between 10 and 25 cm (wave lengths obviously have to be short enough that the water is still “deep”, i.e. H>>wave length) — Elin’s instruction to me for the kind of waves she wanted was “Allegro!” :-D Elin, you are really the coolest and most fun person to play with tanks with!

In deep water, we now have the added difficulty that the phase speed is twice as fast as the group speed. This makes observing the whole thing a lot more difficult. Also amplitudes are a lot smaller now, since the tank was so full and we wanted to keep the water inside…

Here is t0 — Elin has just dipped the beer can into the water for the first time

t1 — can you see the wave signal has propagated up to where the red arrow is pointing to?

t2 — the signal has reached my thumb at the left edge of the picture.

From timing this, we can calculate the group speed. We can also measure the wave length on the video and then calculate a theoretical phase speed from that. For the experiments Elin and I did, the results were pretty good, as in phase speed was usually about twice as fast as group speed. And I am curious to hear how well this works out when the students run the experiment!

Playing with roll wave animations

I love how powerful Powerpoint is, at the same time there surely is a way out there to create these kind of animations with a little less copy & pasting, and especially without manually moving tons of stuff by juuust a tiny little bit from frame to frame?

How would you build these kinds of pictures? I’m even considering Matlab at this point (which I really don’t think would be such a stupid idea after all)

This is an animated gif. If it isn’t playing, I have no idea why not… It is playing on Twitter (link here)

Roll waves, one of the more complicated #friendlywaves I’ve gotten over the years…

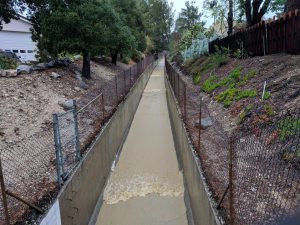
#friendlywave is the new hashtag I am currently establishing. Send me your picture of waves, I will do my best to explain what’s going on there!

When it rains, it pours, especially in LA. So much so that they have flood control channels running throughout the city even though they are only needed a couple of days every year. But when they are needed, they should be a tourist attraction because of the awesome wave watching to be done there! As you see below, there are waves — with fronts perpendicular to the direction of flow and a jump in surface height — coming down the channel at pretty regular intervals.

Roll waves on Verdugo Wash. Photo by Mike Malaska

Even though this looks very familiar from how rain flows in gutters or even down window panes, having this #friendlywave sent to me was the first time I actually looked into these kinds of flows. Because what’s happening here is nothing like what happens in the open ocean, so many of the theories I am used to don’t actually apply here.

Looks like tidal bores traveling up a river

The waves in the picture above almost look like the tidal bores one might now from rivers like the Severn in the UK (I really want to go there bore watching some day!). Except that bores travel upstream and thus against the current, and in the picture both the flow and the waves are coming at us. But let’s look at tidal bores for a minute first anyway, because they are a good way to get into some of the concepts we’ll need later to understand roll waves, like for example the Froude number.

Froude number: Who’s faster, current or waves?

If you have a wave running up a river (as in: running against the current), there are several different scenarios, and the “Froude number” is often used to characterize them. The Froude number Fr=u/c compares how fast a current is flowing (u) with how fast a wave can propagate (c).


Side note: How do we know how fast the waves should be propagating?

The “c” that is usually used in calculating the Froude number is the phase velocity of shallow water waves c=sqrt(gH), which only depends on water depth H (and, as Mike would point out, on the gravitational constant g, which I don’t actually see as variable since I am used to working on Earth). (There is, btw, a fun experiment we did with students to learn about the phase speed of shallow water waves.) This is, however, a problem in our case since we are operating in very shallow water and the equation above assumes a sinusoidal surface, small amplitude and a lot of other stuff that is clearly not given in the see-saw waves we observe. And then this stuff quickly gets very non-linear… So using this Froude number definition is … questionable. Therefore the literature I’ve seen on the topic sometimes uses a different dispersion relation. But I like this one because it’s easy and works kinda well enough for my purposes (which is just to get a general idea of what’s going on).


Back to the Froude number.

If Fr<1 it means that the waves propagate faster than the river is flowing, so if you are standing next to the river wave watching, you will see the waves propagating upstream.

Find that hard to imagine? Imagine you are walking on an elevator, the wrong way round. The elevator is moving downward, you are trying to get upstairs anyway. But if you run faster than the elevator, you will eventually get up that way, too! This is what that looks like:

If Fr>1 however, the river is flowing faster than waves can propagate, so even though the waves are technically moving upstream when the water is used as a reference, an observer will see them moving downstream, albeit more slowly than the water itself, or a stick one might have thrown in.

On an escalator, this is what Fr>1 looks like:

But then there is a special case, in which Fr=1.

Hydraulic jumps

Fr=1 means that the current and the waves are moving at exactly the same velocity, so a wave is trapped in place. We see that a lot on weirs, for example, and there are plenty of posts on this blog where I’ve shown different examples of the so-called hydraulic jumps.

See? In all these pictures above there is one spot where the current is exactly as fast as the waves propagating against it, and in that spot the flow regime changes dramatically, and there is literally a jump in surface height, for example from shooting away from where the jet from the hose hits the bottom of the tank to flowing more slowly and in a thicker layer further out. However, all these hydraulic jumps stay in pretty much the same position over pretty long times. This is not what we observe with tidal bores.

On an escalator, you would be walking up and up and up, yet staying in place. Like so:

Roll waves

Tidal bores, and the hydraulic jumps associated with their leading edges, propagate upstream. But they are not waves the way we usually think about waves with particles moving in elliptical orbits. Instead, they are waves that are constantly breaking. And this is how they are able to move upstream: At their base, the wave is moving as fast as the river is flowing, i.e. Fr=1, so the base would stay put. As the base is constantly being pushed back downstream while running upstream at full force, the top of the wave is trying to move forward, too, moving over the base into the space where there is no base underneath it any more, hence collapsing forward. The top of the wave is able to move faster because it’s in “deeper” water and c is a function of depth. This is the breaking, the rolling of those waves. The front rolls up the rivers, entraining a lot of air, causing a lot of turbulent mixing as it is moving forward. And all in all, the whole thing looks fairly similar to what we saw in the picture above from Verdugo Wash.

But the waves are actually traveling DOWN the river

However there is a small issue that’s different. While tidal bores travel UP a river, the roll waves on Verdugo Wash actually travel DOWN. If the current and the waves are traveling in the same direction, what makes the waves break instead of just ride along on the current?

What’s tripping up these roll waves?

Any literature on the topic says that roll waves can occur for Fr>2, so any current that is twice as fast as the speed of waves at that water depth, or faster, will have those periodic surges coming downstream. But why? It doesn’t have the current pulling the base away from underneath it as it has in case of a wave traveling against the current, so what’s going on here? One thing is that roll waves occur on a slope rather than on a more or less level surface. Therefore the Froude number definitions for roll waves include the steepness of the slope — the steeper, the easier it is to trip up the waves.

Shock waves: Faster than the speed of sound

Usually shock waves are defined as disturbances that move faster than the local speed of sound in a medium, which means that it moves faster than information about its impending arrival can travel and thus there isn’t any interaction with a shock wave until it’s there and things change dramatically. This definition also works for waves traveling on the free surface of the water (rather than as a pressure wave inside the water), and describe what we see with those roll waves. Everything looks like business as usual until all of a sudden there is a jump in the surface elevation and a different flow regime surging past.

If you look at such a current (for example in the video below), you can clearly see that there are two different types of waves: The ones that behave the way you would expect (propagating with their normal wave speed [i.e. the “speed of sound”, c] while being washed downstream by the current) and then roll waves [i.e. “shock waves” with a breaking, rolling front] that surge down much faster and swallow up all the small waves in their large jump in surface elevation.

Video by Mike Malaska

In the escalator example, it would look something like this: People walking down with speed c, then someone tumbling down with speed 2c, collecting more and more people as he tumbles past. People upstream of the tumbling move more slowly (better be safe than sorry? No happy blue people were hurt in the production of the video below!).

Looking at that escalator clip, it’s also easy to imagine that wave lengths of roll waves become longer and longer the further downstream you go, because as they bump into “ordinary” waves when they are about to swallow them, they push them forward, thus extending their crest just a little more forward. And as the jump in surface height gets more pronounced over time and they collect more and more water in their crests, the bottom drag is losing more and more of its importance. Which means that the roll waves get faster and faster, the further they propagate downstream.

Speaking of bottom drag: When calculating the speed of roll waves, another variable that needs to be considered is the roughness of the ground. It’s easy to see that that would have an influence on shallow water. Explaining that is beyond this blog post, but there are examples in the videos Mike sent me, so I’ll write a blogpost on that soon.

So. This is what’s going on in LA when it is raining. Make sense so far? Great! Then we can move on to more posts on a couple of details that Mike noticed when observing the roll waves, like for example what happens to roll waves when two overflow channels run into each other and combine, or what happens when they hit an obstacle and get reflected.

Thanks for sharing your observations and getting me hooked on exploring this cool phenomenon, Mike!

Why are they so much slower than I thought? Observing the group velocity vs phase velocity of waves

Have you ever seen a speedboat drive past, looked at its wake moving torwards you, then gotten distracted, and when you look back a little while later been surprised that the wake hasn’t moved as far towards you as you thought it would have during the time you looked away?

Well, I definitely have had that happen many times, and the other day I was sitting on the beach with a friend and we talked about why you initially perceive the waves moving a lot faster than they turn out to be moving in the end. While I didn’t film it then, I’ve been putting my time on the GEOF105 student cruise to good use to check out waves in addition to the cool research going on on the cruise, so now I have a movie showing a similar situation!

But let’s talk a little theory first.

Phase velocity

The phase velocity of a wave is the speed with which you see a wave crest moving.

Waves can be classified into long vs short waves, or deep- vs shallow water waves. But neither deep and shallow, nor long and short are absolute values: They refer to how long a wave is relative to the depth of the water in which it is moving. For short or deep water waves, the wavelength is short relative to the water depth (but can still be tens or even hundreds of meters long if the water is sufficiently deep!). For long or shallow water waves, the wave length is long compared to the water depth (for example Tsunamis are shallow water waves, even though the ocean is on average about 4 km deep).

For those long waves, or shallow water waves, the phase velocity is a function of the water depth, meaning that all shallow water waves all move at the same velocity.

However, what you typically see are deep water waves, and here things are a little more complicated. Since phase velocity depends on wave length, it is different for different waves. That means that there is interference between waves, even when they are travelling in the same direction. So what you end up seeing is the result of many different waves all mixed together.

If you watch the gif below (and if it isn’t moving just give it a little moment to fully load, it should then start), do you see how waves seem to be moving quite fast past the RV Harald Brattstrøm, but once you focus on individual wave crests, they seem to get lost, and the whole field moves more slowly than you initially thought?

That’s the effect caused by the interference of all those waves with slightly different wave lengths, and it’s called the group velocity.

Group velocity

The group velocity is the slower velocity with which you see a wave field propagate. It’s 1/2 of the phase velocity, and it is the velocity with which the signal of a wave field actually propagates. So even though you initially observed wave crests moving across the gif above fairly quickly, the signal of “wave field coming through!” only propagates with half the phase velocity.

Usually you learn about phase and group velocities in a theoretical way and are maybe shown some animations, but I thought it was pretty cool to be able to observe it “in situ!” :-)

Group velocity and phase velocity

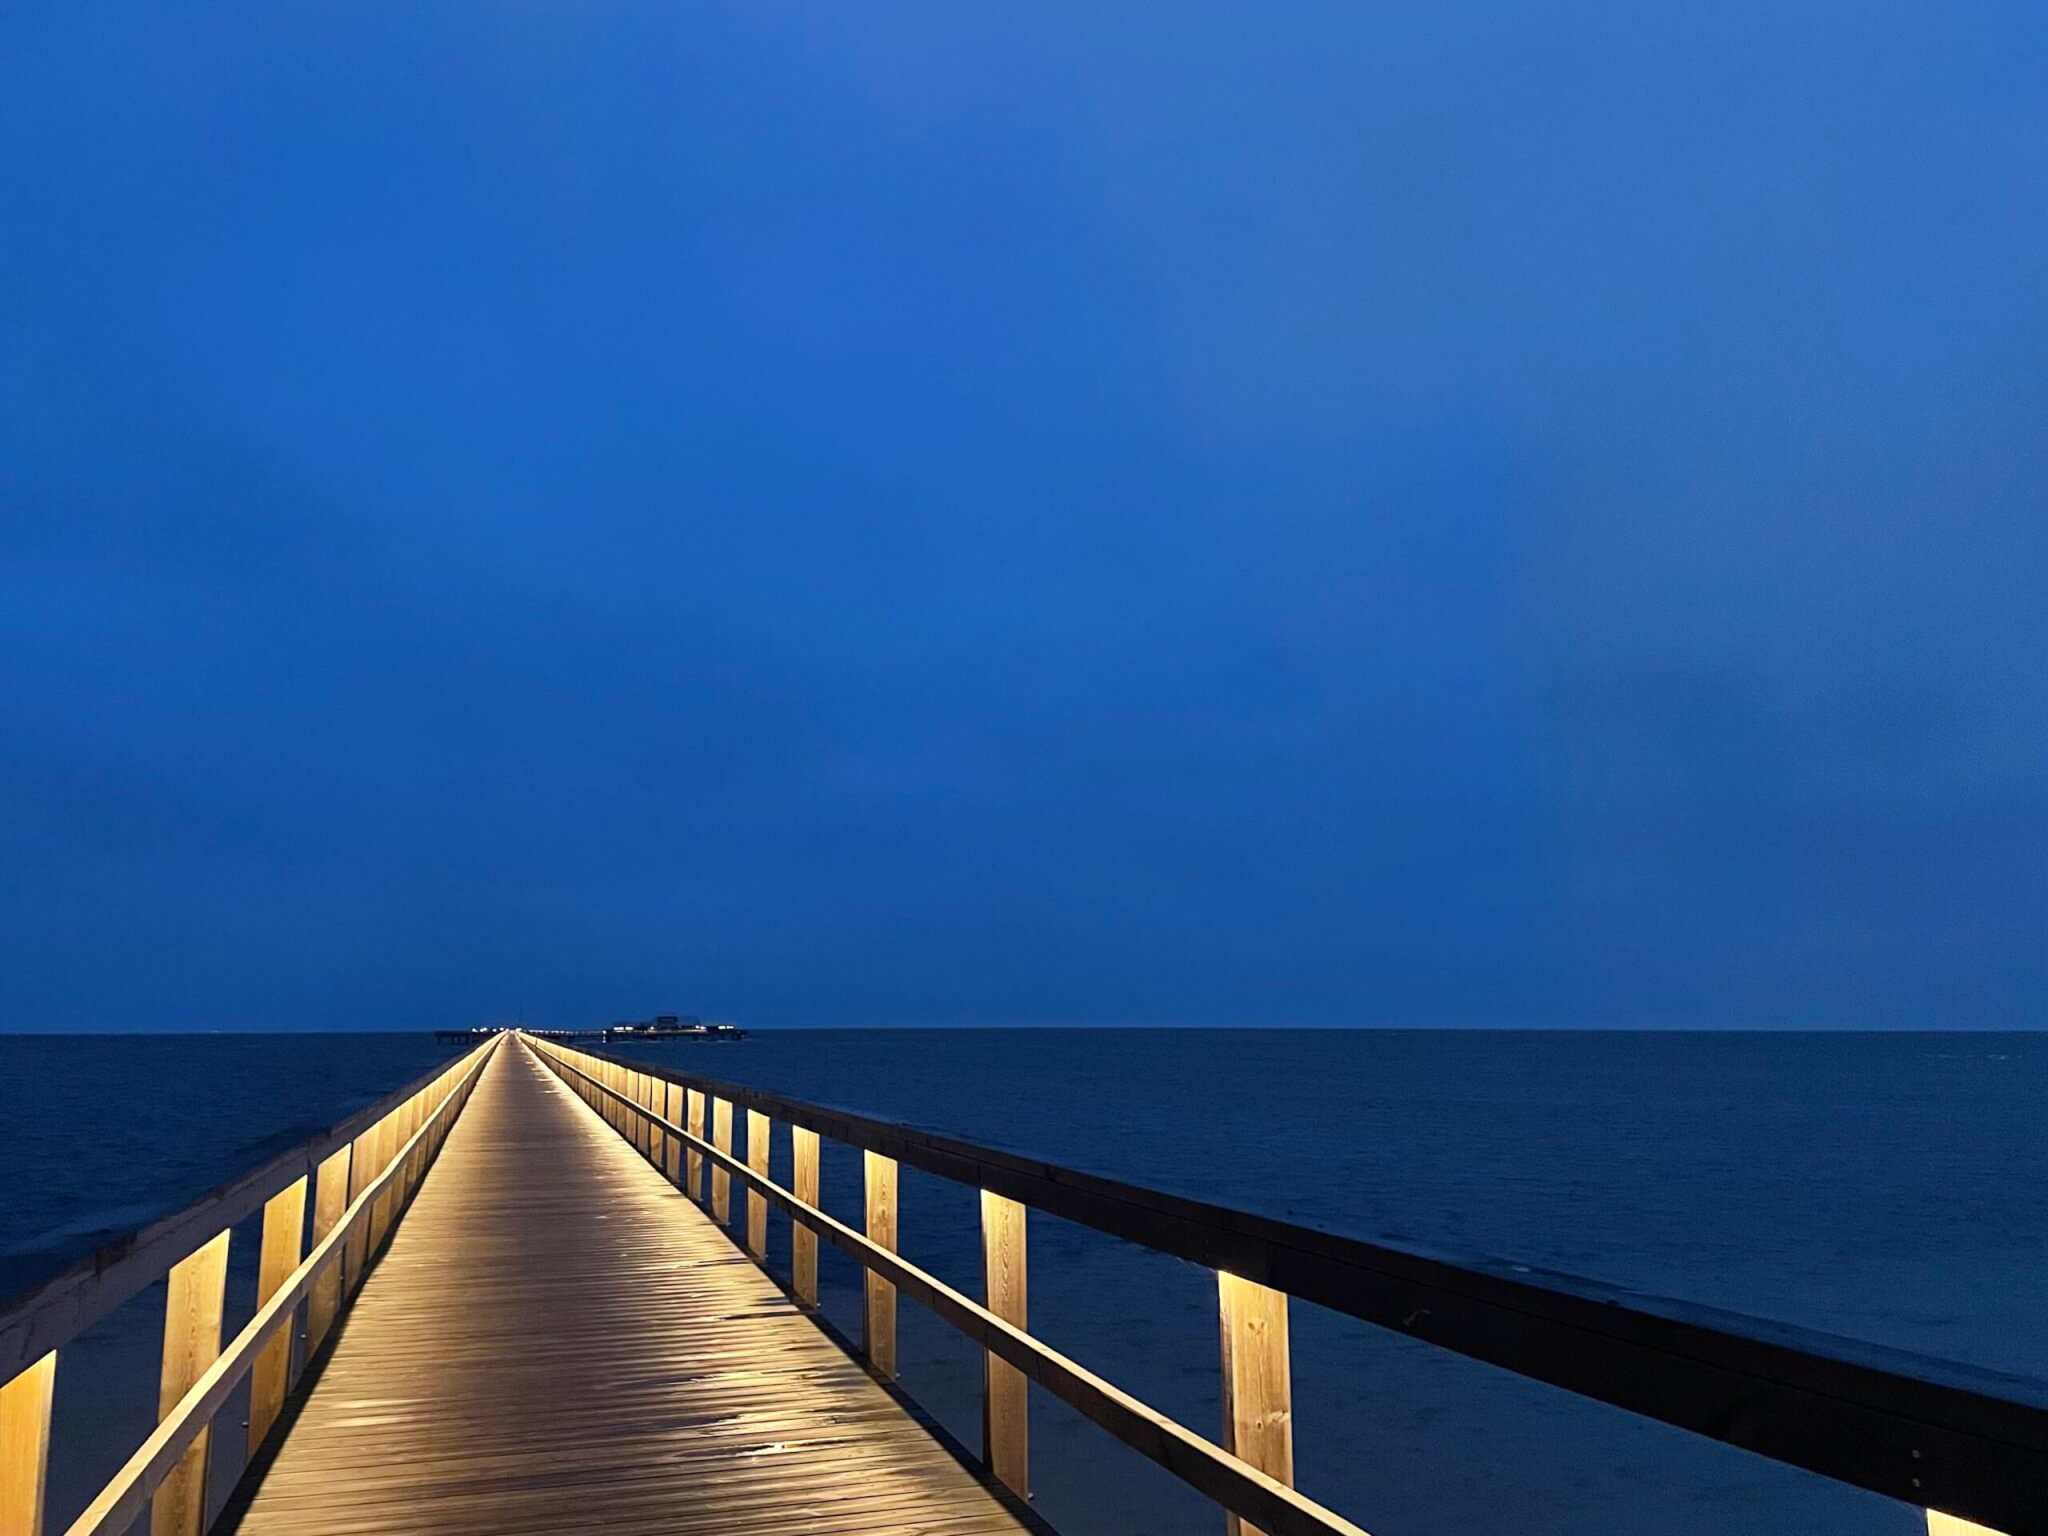
When I recently wrote about observing waves in a different way, I talked about light being focussed by the waves on the sea floor.

In the other post, I focussed on how looking at the light and dark pattern on the sea floor makes waves visible that are otherwise hard to see when just looking at the surface of the water:

But it also makes something else easier to notice, and that is how phase velocity and group velocity are really different. We know they should be, but on a choppy water surface it is really difficult to keep track of individual waves as they wobble through each other. But looking at the light and dark pattern on the sea floor, it actually becomes easier to observe. See those brighter areas and darker areas? Wave groups!

And in the movie below, you’ll see how they eat up waves that run into them, and how other wave crests come out in the front as they are overtaking the group. Cool! :-)

Why waves propagate so slowly into smooth patches of water

The morning I went to Heligoland I spent some time in the port of Hamburg, trying to film a phenomenon I had recently chatted about with the author of this inspiring guest post: How waves seem to propagate super slowly into smooth patches of water. It turned out to be really difficult to film (because ships didn’t go where I expected them to go [you see me walk a couple of steps half way through the video below, because I needed to get away where a boat was docking], other ships cross the water you are filming, and because filming water is pretty difficult in general).

Here is my best attempt:

So why does it seem to take waves so surprisingly long to propagate into smooth patches of water? Well, because what we see and notice is the phase speed of waves, with which the crests propagate. But the wave field itself only propagates with group speed, which is half the phase speed. So from the movement we notice, waves should be invading the smooth patches twice as fast as they actually do!

Now I need to go and find a good way to film this phenomenon…

Signal velocity

How can a signal travel faster than the phase of a wave, or individual particles?

I remember having a really hard time with the concept of a signal traveling faster than the phase of a wave or than individual particles when I first heard about it during my first year at university. I know my physics professor had an example he thought would help us, and I remember that it was something about being on a playground and stepping on something, but I remember that even then I didn’t get what point he was trying to make.

Anyway. I have blinds in my living room, and whenever I open or close them, I somehow think about this. In the movie below you’ll see me crank the blinds up and down. From the reflection of the lit door in the background you can see that the camera stays in more or less the same position during the movie (yes, dad, next time I’ll use a tripod!), and from the sound you hear that I’m cranking with more or less the same rate throughout the movie. And yet you see the blinds seemingly move with two different velocities: One when all the panels move in parallel, and one when the signal that something started moving (or stopped, as in the second case) propagates through the blinds as the gaps between the panels open or close.

Now tell me: Is this a good example? Or why not? What would be better?