One of the most difficult #friendlywaves I’ve ever gotten! Did I get it right?
Florian sent me a #friendlywave — a wave picture he took, with hopes that I might be able to explain what is going on there. And this one had me puzzled for some time!
This is what the picture looks like:
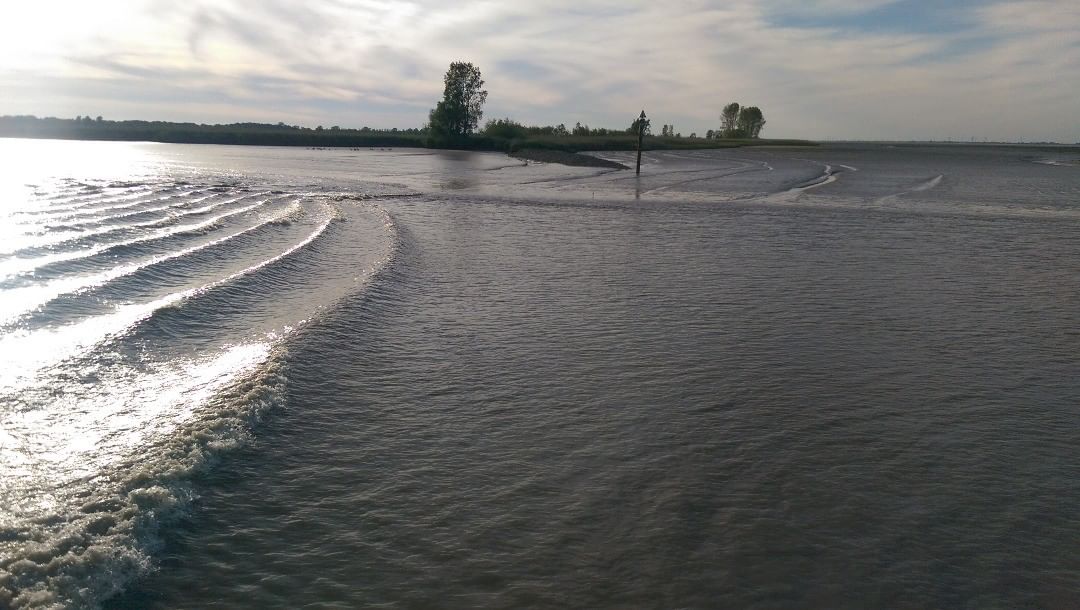
What I knew about it: Florian was on the ferry from Wisschafen to Glückstadt, crossing the Elbe river.
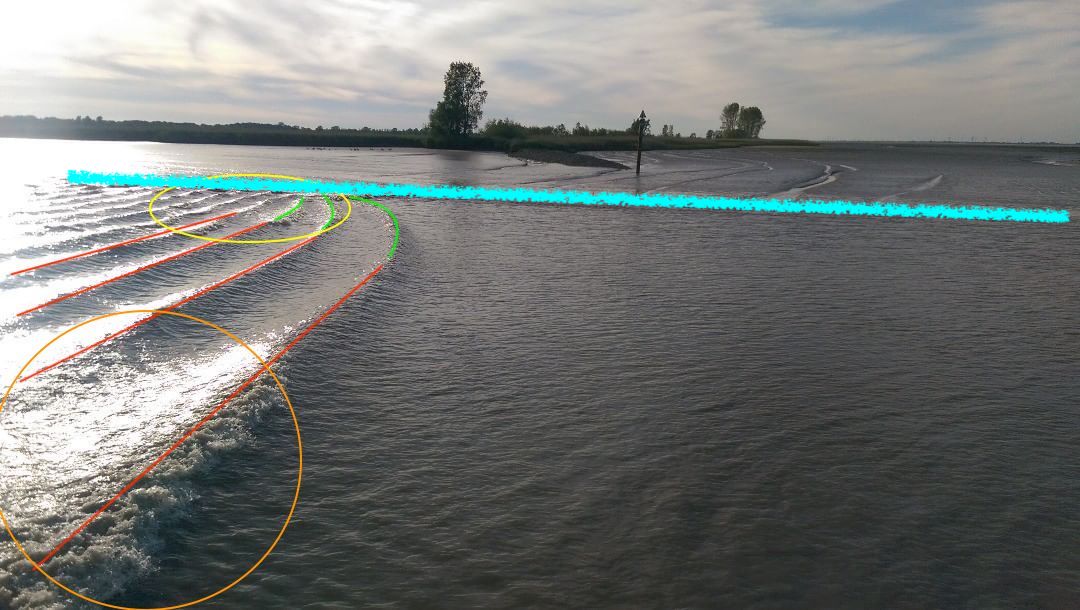
In the picture itself, there are several features that jumped at me. First, drawn in with the lightblue line below: A sand bank parallel(-ish) to the island’s coast line.
Then, the ship’s wake (shown in red) breaking right near the ship (orange) and turning (green) and breaking (yellow) where it runs on the sand bank.
Florian wrote he was watching the ferry’s wake and noticed something curious: There seemed to be a shallow part, where the waves suddenly became a lot faster! And could I explain what was going on?
Looking at the picture, there were two possibilities for what he might have meant (and, spoiler alert — I completely jumped on the wrong one first!).
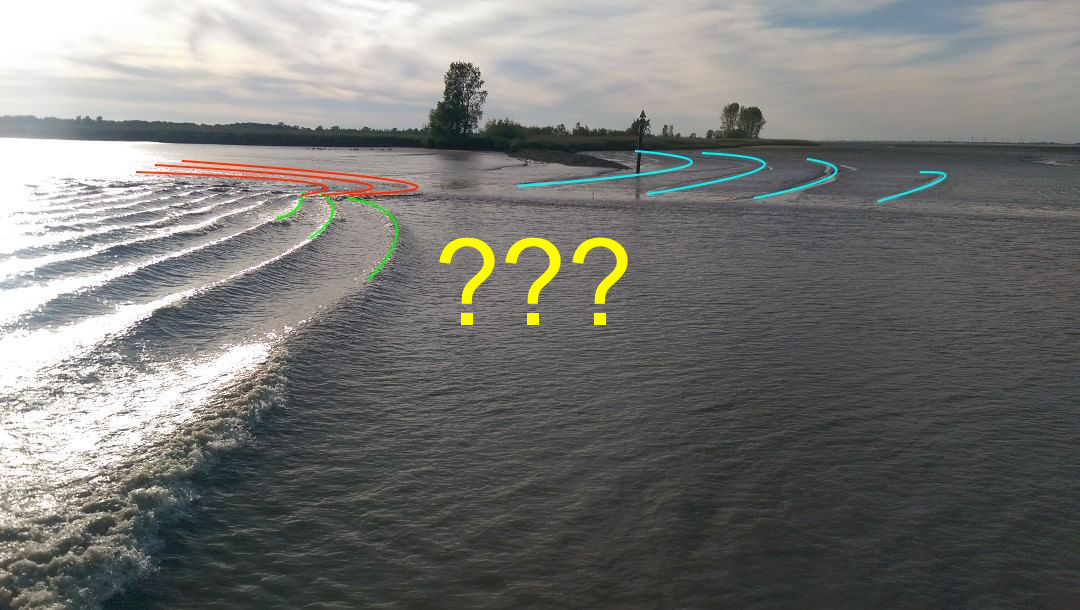
Below, I’ve drawn in the part of the wake that is running on the shallow sand bank (green) and how those wave crests continue on the other side of the sand bank (red). I’ve also drawn in some mystery wave crests in blue. Those were the ones I chose to focus on first, since Florian had written that he noticed waves behaving weirdly and suddenly becoming much faster. So if we are talking fast, we are talking really fast, right?
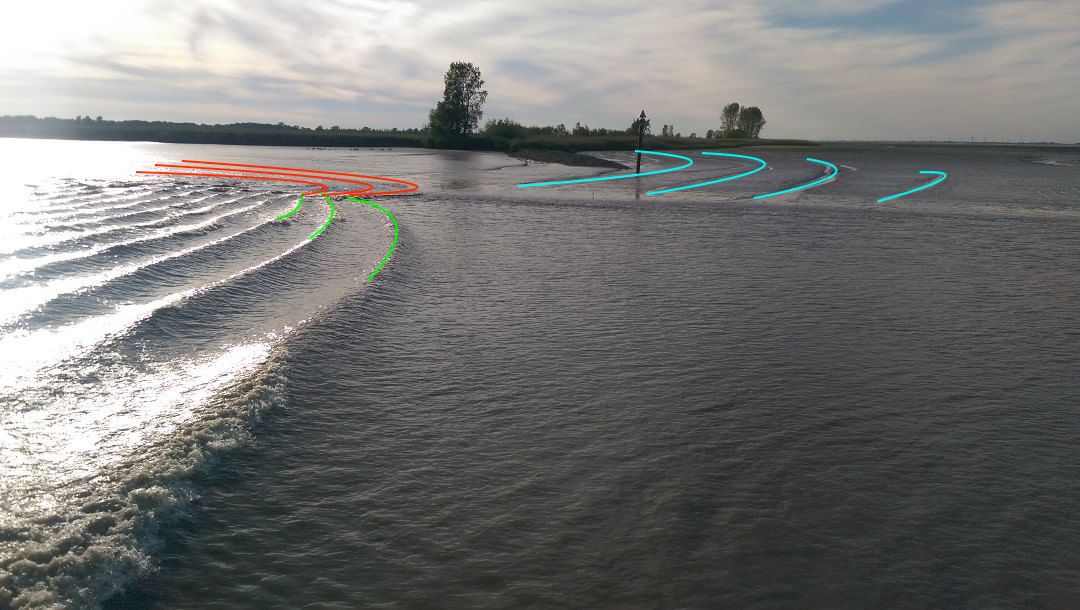
So how do we explain those blue wave crests?
There is a limit for the maximum speed a wave can have. That limit depends on the wave’s wave length: The longer a wave, the faster it travels. In deep water, i.e. water deeper than 1/2 the wavelength, the wave travels at this maximum speed (see green lines in the plot below).
But as it comes into shallower water, it gets slowed down (see black lines in the plot below — those are just a quick sketch, there are complicated equations to calculate it exactly).
In shallow water, i.e. water that is smaller than 1/20th of the wave length, the phase speed only depends on water depth: The shallower the water, the more the wave is being slowed down (see the red lines in the plot below).
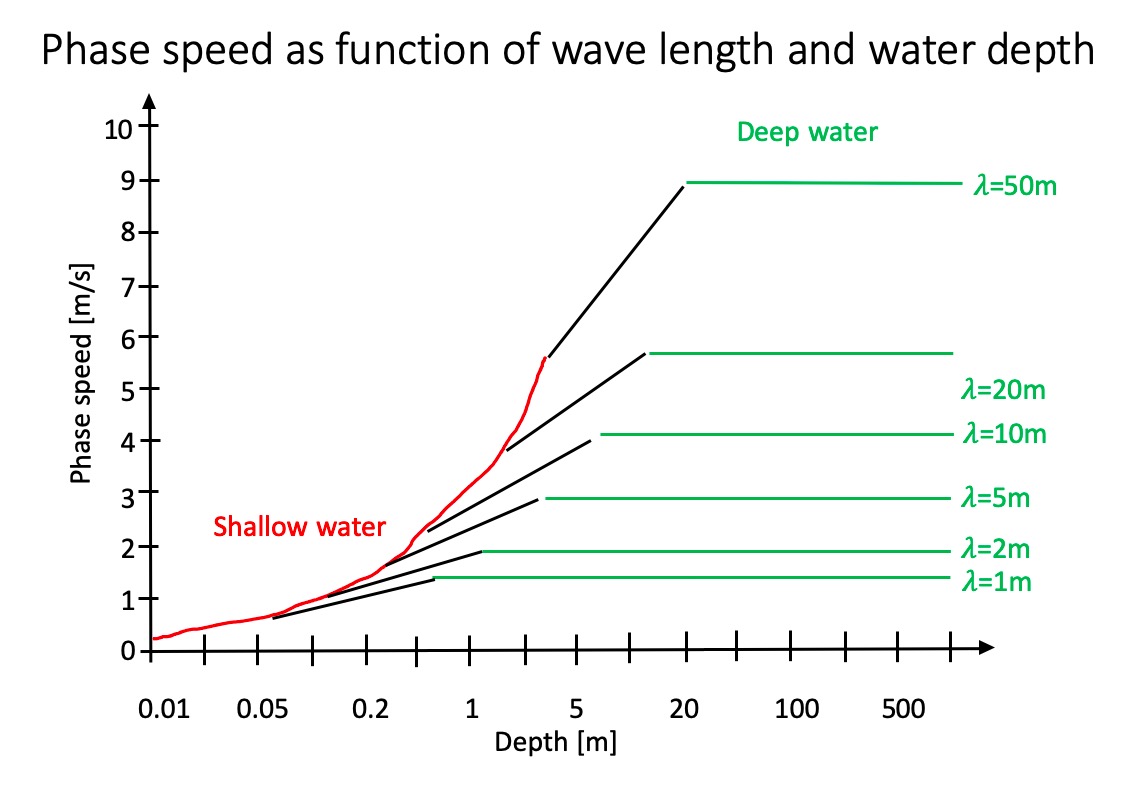
Sorry about the quality of the sketch — I don’t have Matlab or anything else useful on the computer I have available right now, so I drew this in ppt! Take it with a pinch of salt, but qualitatively it’s correct!
So looking back at Florian’s picture, for the blue waves to have been caused by Florian’s ferry, there are two options:
A) they would have to have wave speeds faster than the ferry’s bow wave and wake
B) the ferry would have had to come from the direction of the island, so that the waves propagated in that deeper channel behind the sand bank before the ferry made its way around the sandbank.
Option A is impossible, because wakes travel at maximum wave speed (similar to a sonic boom in the atmosphere, where sound is travelling at maximum speed, forming a cone with the air plane at its tip, only here it’s a 2D version, a V-shaped wake with the ship at its tip). So if the wake is traveling at maximum speed already, then the blue waves can’t go faster than that.
For option B, looking Florian’s ferry up on a map, I saw that that ferry goes around a small island, which is the land you see in his picture. But a quick glance at the map shows that even though the sand bank seems to end where the ship would have had to have gone in order to create those waves, the island is still very much in the way. So this can’t be the solution, either.
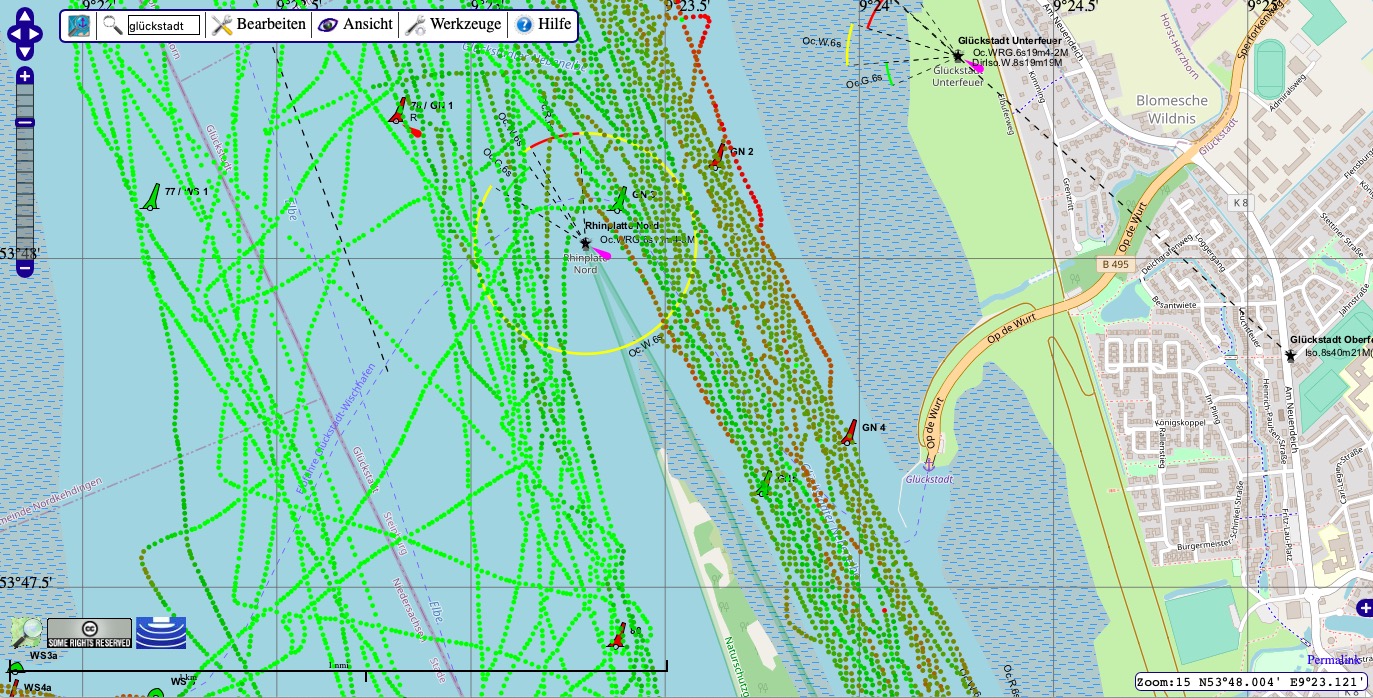
This map is published at http://map.openseamap.org under a CC BY-SA 2.0 license
So let’s take another good look at the original picture.
Remember those wave crests that I marked in blue? Well, upon closer inspection it turns out that they are tidal gullys and not wave crests! (Which is what Florian confirmed when I asked whether he remembered the situation) Guess I have been barking up the wrong tree all this time!
So back to the wave crests that I marked in red:
What we see here is exactly the depth dependence of the phase speed that I plotted above. Right at the sand bank, the water is shallowest and waves are slowed down (we see that both in the green wave crests that seem to be falling back and start breaking as they get closer to the sand bank [both indicating that the water is getting shallower], and in the red wave crests right at the sand bank). But as the water gets deeper again on the far side of the sand bank (which depth measurements in the map above seem to confirm), the phase speed picks up again (as it has to — see my plot above) and the wave crests accelerate again. Hence we have the weird phenomenon of waves suddenly speeding up!
Very long explanation, I know, but still pretty cool now that we solved it, right? I love #friendlywaves — if you have any mystery wave pictures, please do send them my way! :-)