Category Archives: hands-on activity (easy)

Melting ice cubes, again

Somehow I am stuck on this demonstration!

I can’t let go of this experiment. Last time I posted about it, someone (Hallo Papa!) complained about the background and how I should set a timer and a ruler next to the beakers for scale. The background and timer I did something about, but the ruler I forgot. Oh well, at least there is room for improvement still, right?

I always find it fascinating to see how differently the ice melts in fresh water and salt water. Below you see how convection has completely mixed the fresh water with the melt water, whereas the melt water forms a layer on the salt water. You can even still distinguish horizontal currents in there!

IMG_9241

The beakers after ice cubes have melted in fresh water (left) and salt water (right)

For everybody who still enjoys watching the experiment: Here is a movie. Top one as time lapse, bottom one in real time, all 8 minutes of it. Enjoy!

The links to the “melting ice cubes” series after the cut.

Continue reading

Conducting experiments at EMSEA14

Kristin’s and my workshop at EMSEA14.

As I mentioned before, Kristin Richter and I are running the workshop “Conducting oceanographic experiments in a conventional classroom anywhere” at the European Marine Science Educator’s Association Meeting in Gothenburg, Sweden. There is quite an active Twitter crowd around, so you can follow the storyfied meeting or look out for #EMSEA14 on Twitter.

Our workshop has been represented quite well there, too, so I’ll just post a couple of my own pictures here.

IMG_9702

Final preparations: Kristin is mixing salt water

IMG_9704

Watching intently the melting ice. As my former boss would say: It’s like watching paint dry.

IMG_9708

Except that it is really fascinating and that there are so many things to discuss!

IMG_9717

Kristin and I took turns presenting the workshops, which was great. Plus it was really nice to have two instructors walking around, talking to the groups, instead of just one.

IMG_9725

Kristin talking about using our favorite experiment to practice applying the scientific method.

For further reading, here are our slides.

Plus there are a lot of post dealing with the exact same experiment after the cut below. And there are two more posts on this exact experiment coming up that are scheduled already, one tomorrow, the other one in two weeks time. And thanks to a very nice family of participants I already have plenty of ideas of how to modify this experiment in the future!

[edit: There finally is a picture of me in the workshop, too, to show that I actually did contribute and not just leave it all to Kristin:

IMG_9779

So I did actually do something, too, and not just take pictures. Plus did you notice how there is a EMSEA sign on the podium? There were signs on the doors, too, both on the inside and outside, so one of them was visible even when the door was wide open. Such good thinking of the organizers! Gothenburg University does have a seriously impressive infrastructure in any case: Tables and chairs on wheels so the whole room could easily be modified to suit our needs. Awesome.]


The icy elevator

Weird things happening when ice cubes melt.

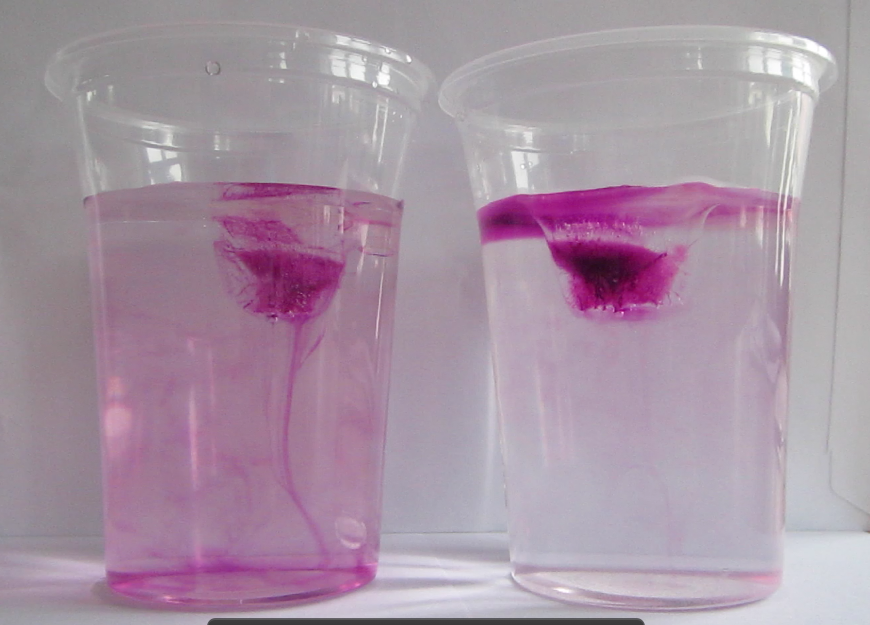
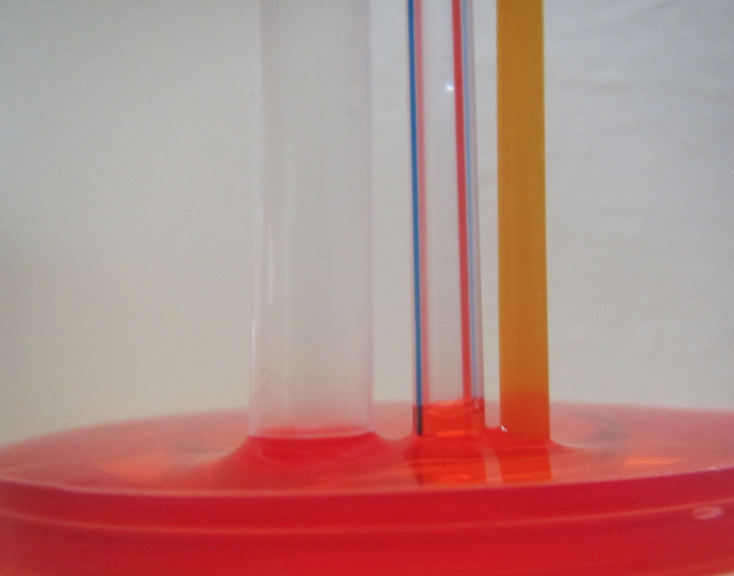
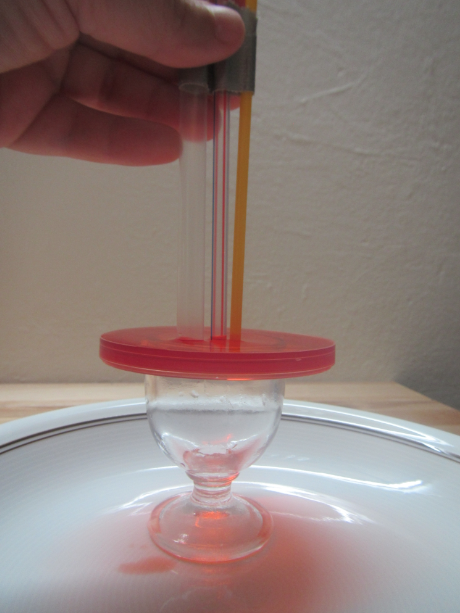
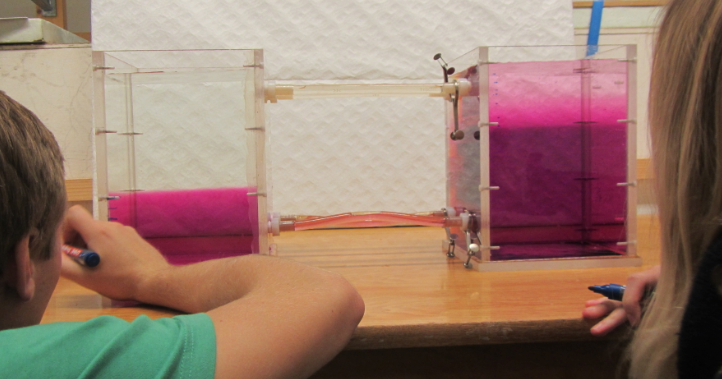
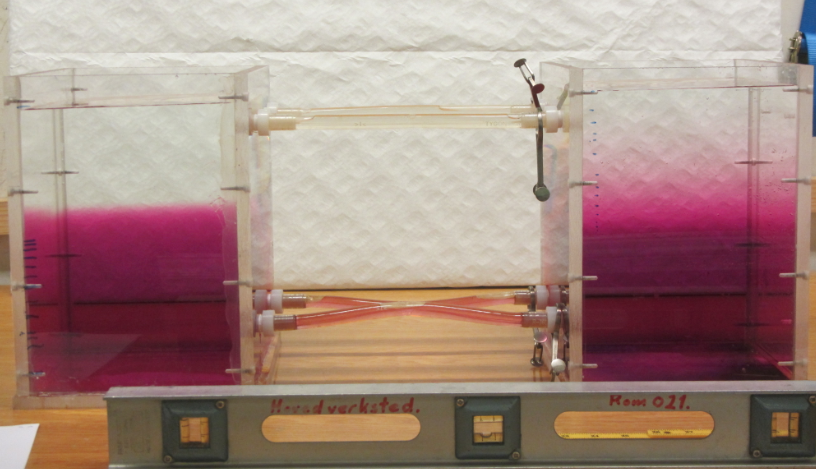
Remember I said that there were weird and wonderful things going on when I last ran the melting ice cubes in salt and fresh water experiment? It is really difficult to see in the picture below (sorry!) but you can probably spot the ice cube floating at the surface and the melt water sinking down, inducing some turbulence? And then there is a small ice bit a bit to the right of the center of the picture. And that ice bit is floating upwards.

MVI_9219

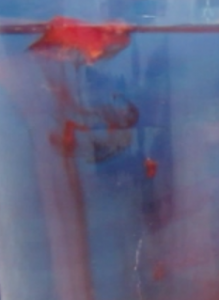
Dyed ice cube floating at the surface, and small ice bits floating up

Watch the melting ice cubes video below to see all the thing in action, it is visible really well as soon as the picture is moving:

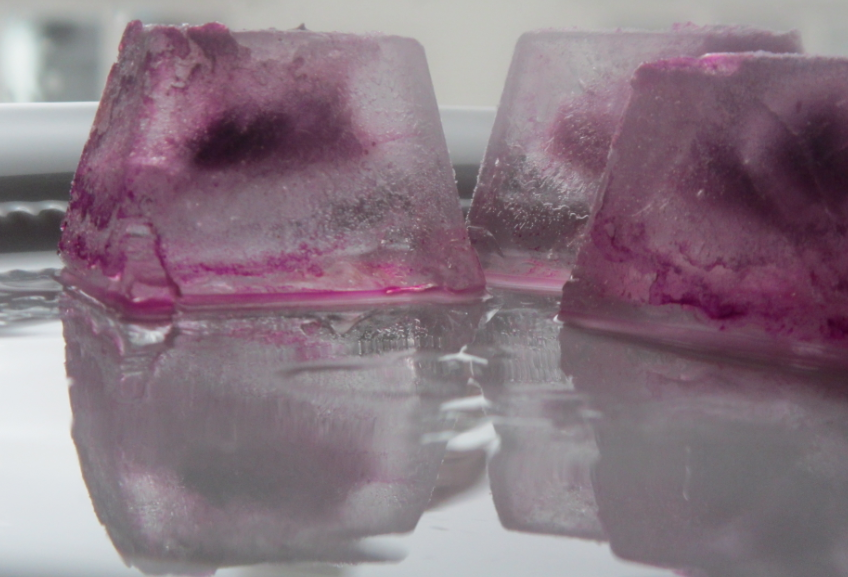
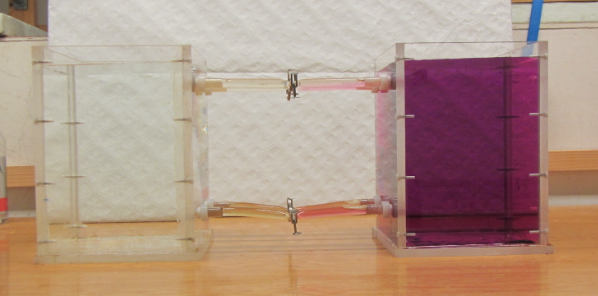
So what is going on there? I think the solution to this riddle lies in me forcing ice to freeze even though it contains more salt (or in this case, red food dye) than it is happy with. Remember how dyed ice cubes look?

IMG_4523

Ice cubes frozen from colored water

So basically there is dye trapped in the middle of the cube, because cooling is happening from all sides, hence ice is starting to form from all sides, pushing the dye to the center of the ice cube. In the ocean, cooling would of course only happen from above, so salt is being rejected as brine.

Anyway, since I wanted to dye the ice cubes to make things more visible for this blog, I am adding a dissolved substance to the water that would usually not be there. Hence I am making the ice slightly denser than it would otherwise be. So when small ice bits chip away from the main cube (which still contains large parts of pure fresh water ice from the sides of the cube where, during the freezing, the dye could still be rejected; and which therefore still floats), they are denser than the water and sink. But as they melt, the dye washed out, and eventually the remaining ice is fresh, hence less dense, enough to float up again.

The whole thing looks pretty fascinating.

What do you think, is that the correct explanation? Or can you come up with a better one? Let me know!

P.S.: Everybody I showed this video to was fascinated by how the little piece of ice is floating up. But what I find a lot more fascinating is how it came to be at the bottom of the beaker in the first place! After all, ice is supposed to float on water (or drift up again if pulled down and then released) but how did it get down there???

Melting ice cubes reloaded

Or why you should pay attention to the kind of salt you use for your experiments.

The melting ice cubes in salt and fresh water is one of my favorites that I haven’t written about in a long time, even though (or possibly: because) I wrote a whole series about it last year (see links at the end of this post).

Now that the EMSEA14 conference is almost upon us and Kristin and I busy preparing our workshop, I thought I’d run the experiment again and – for a change – take the time to finally know how much time to schedule for running the experiment. This is the experiment that I have run most often of all in all kinds of classes, but there you go… Usually I have more time than just 30 minutes, and there is so much other content I want to cover in that workshop!

There are a couple of things that I learned running this experiment again.

  • It takes at least 10 minutes to run the experiment. My water was slightly colder than usual room temperature, my ice cubes slightly smaller, though. And those 10 minutes are only the time the ice takes to melt, not the time it takes to hand out the materials and have the groups settle down.
  • There is a reason it is always recommended to use kosher salt for these kind of experiments. Look at the picture from one of the old posts in comparison to the ones from today: The iodized salt containing folic acid I had in my kitchen dissolves into really milky water. I really should have walked the two extra meters to get the good salt from my oceanography supplies in the other room!
Melting_ice_cubes_2

Ice cubes melting in fresh water (left) and salt water (right) – old experiment

IMG_9220

Ice cubes melting in fresh water (left) and salt water (right) – experiment today

  • Some food dyes are the devil. My whole kitchen is red. Plus the ice cubes didn’t freeze nicely (for a post on ice cubes freezing from salt water click here), the ice chipped when I tried to get the cubes out of the ice cube tray. I definitely can’t have that mess at a workshop. So here is another argument for using non-dyed ice cubes! The more important argument being that you think more if the cubes are not dyed and you don’t immediately see the explanation…

But it is always a fun experiment to run, and there are always new things to spot. Watch the video below and see for yourself! (Explanations on the weird phenomena coming up in a future post!)

The links to the “melting ice cubes” series:

Ice cubes melting in salt water and freshwater (post 1/4)

Ice cubes melting in fresh water and salt water (post 2/4)

Melting ice cubes – one experiment, many ways (post 3/4)

Melting ice cubes – what contexts to use this experiment in (post 4/4)

Other posts on this experiment:

Dangers of blogging, or ice cubes melting in fresh water and salt water

Guest post: The mystery of the cold room

Thermally driven circulation

One of my all-time favorite experiments.

The salt group got a bit bored from watching ice cubes melt, so I suggested they look at temperature differences for a change, and they ran the “leaking bottles” experiment.

MVI_8938

Thermally-driven circulation.

Watch a movie combining their four different setups below!

Wave interference in a tank

Creating waves and watching them interfere. (deutscher Text unten)

You might not have guessed it from reading about our waves meeting over a sandbank experiment, but we weren’t doing in purely for its entertainment value. Our goal was to see how waves interfere, because the theory of interfering waves seems to be counter-intuitive in some cases. A second experiment we have been doing on this topic is shown below. We create waves by dripping water drops on the water surface and film (and in some cases also watch) from below. Movie at the end of this post!

Obwohl es sicherlich nicht danach aussah, haben wir das  Experiment mit den Wellen auf der Sandbank nicht nur aus Spaß veranstaltet, sondern durchaus mit einem wissenschaftlichen Hintergrund: Wir wollten uns ansehen, wie sich mehrere Wellen überlagern.

Von oben werden Wassertropfen in den Tank getropft, das daraus entstehende Wellenfeld wird von unten gefilmt (und in einigen Fällen auch beobachtet).


Thermally-driven overturning circulation

Cooling on one end of the tank, heating on the other: A temperature-driven overturning. [deutscher Text unten]

Always one of my favorite experiments – the overturning experiment (and more, and more).

IMG_8467

Final preparations. – Letzte Vorbereitungen

Unsere “Klima und Strömungen”-Gruppe hat heute ausprobiert, wie man in einem Tank eine Umwälzströmung erzeugen kann, indem man an einem Ende wärmt und am anderen Ende kühlt. Einige Versuche waren nötig, bis das Experiment perfektioniert war: Am Anfang fehlte die Wärmequelle am einen Ende, was aber erst auffiel als das kalte Wasser am Boden schon das Ende erreicht hatte. Dann war die Wärmequelle zwar vorhanden, aber von außen am Plexiglastank angebracht.

IMG_8482

Warm red surface current, cold blue deep current. – Warme rote Oberflächenströmung, kalte blaue Tiefenströmung.

Letztendlich wurden ein rotes Wärmepack erhitzt und ein blaues Kühlpack eingefroren, und beide in den Tank gesteckt. Und voila! Eine tolle Zirkulation!

Ganz gegen Ende des Experiments haben wir dann noch Farbkristalle in den Tank fallen lassen, und wie man im Bild unten sehen kann, sind die super, um die Zirkulation zu visualisieren. Aus den anfangs senkrechten Streifen formt sich schnell ein Strömungsprofil: Am Boden von kalt nach warm (links nach rechts) und an der Oberfläche in die entgegengesetzte Richtung.

IMG_8499

Dye streaks as circulation tracers. – Blaue Farbstreifen, um die Zirkulation zu verdeutlichen.

Und wenn man ganz genau hinschaut: Salzfinger! :-)

Let’s do the wave! Longitudinal or transversal?

A simple visualization of two types of waves.

The FIFA world cup has been over for a while now, but I still need to share an idea I had watching one of the games when the audience got bored and started doing a wave around the stadion: this would be a great in-class demonstration of how waves do not transport matter! I usually show demos of waves travelling on ropes, but this could be much more fun – to see the shape of the wave travelling when clearly the students are not moving away from their spots.

Depending on how easy it is to calm that particular class down again you might even consider letting them do a longitudinal wave, too.

Have fun and let me know how it goes!

Capillary effects

When hydrostatics just doesn’t explain things.

Occasionally one notices water levels in straws that are slightly above the water levels in the glass. And of course – even though we always talk about water seeking its level and hydrostatics and stuff – we know that that’s how it should be because of the capillary effects. And then we probably all did that experiment in school where we had a very thin glass tube and the water rose really really high. But have you ever wondered how heights between straws with different diameters would differ? (Really? Only me?)

Anyway, here is how:

I do realize that the diameter of “typical” straws differs from country to country, but these are the Norwegian – and German – typical straws, so I herewith define this as universally typical. Anyway, from left to right: 8mm, 4mm and 3mm diameter on the outside. Unfortunately I don’t have the tools to measure the inner diameter. Plus I really need to get clear thin straws! Sorry the water level is so hard to see in the yellow straw – I even dyed the water for you!

But even with the imperfect materials I have – isn’t this quite an impressive result?

Btw, this is what it looked like when I did the experiment in my kitchen.

When in doubt, pile higher. And deeper.

Marsigli’s experiment

Density-driven flow.

The experiment presented in this post was first proposed by Marsigli in 1681. It illustrates how, despite the absence of a difference in the surface height of two fluids, currents can be driven by the density difference between the fluids. A really nice article by Soffientino and Pilson (2005) on the importance of the Bosporus Strait in oceanography describes the conception of the experiment and includes original drawings.

The way we conduct the experiment, we connect two similar tanks with pipes at the top and bottom, but initially close off the pipes to prevent exchange between tanks. One tank is filled with fresh water, the other one with salt water which is dyed pink. At a time zero we open the pipes and watch what happens.
Marsigli1

Two tanks, one with clear freshwater and one with pink salt water, before the connection between them has been opened.

As was to be expected, a circulation develops in which the dense salt water flows through the lower pipe into the fresh water tank, compensated by freshwater flowing the opposite way in the upper pipe.
Marsigli3

The two tanks equilibrating.

We measure the height of the interface between the pink and the clear water in both tanks over time, and watch as it eventually stops changing and equilibrates.
Marsigli4

The two tanks in equilibrium.

Usually this experiment is all about density driven flows, as are the exercises and questions we ask connected to it. But humor me in preparation of a future post: Comparing the height of the two pink volumes and the two clear volumes we find that they do not add up to the original volumes of the pink and clear tanks – the pink volume has increased and the clear volume decreased.
How did that happen?