The ocean is very deep. It’s also very shallow. On the L/H aspect ratio and the size of the tank.
When we come back from research cruises, one of the things that surprises people back home is how much time it takes to take measurements. And that’s for two reasons: Because the distances we have to travel to reach the area we are interested in are typically very large. And then because the ocean is also very deep.
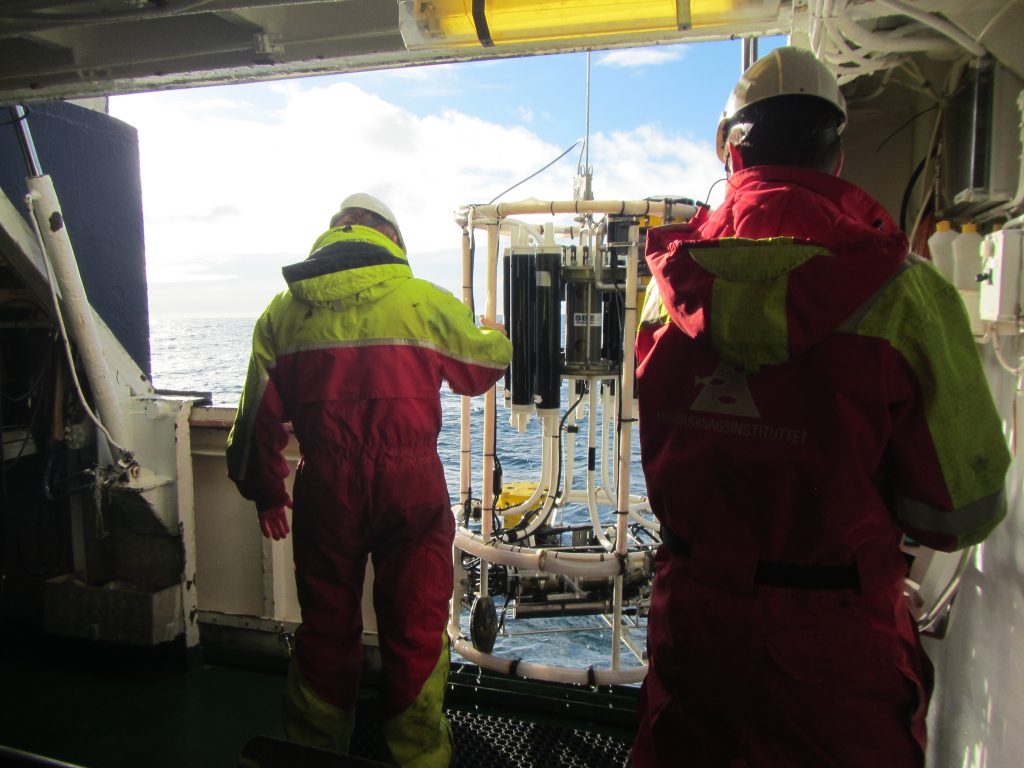
People usually find it hard to imagine that it can easily take hours for an instrument, hanging on a wire from the ship, to go down all the way to the sea floor and then come back up to the ship again. A typical speed the winch is run at is 1 m/s. That means that for a typical ocean depth of 4 km, it takes 66 minutes for the instrument to go down, and then another hour to be brought back up to the ship. And then we haven’t even stopped the winch on the way up, which we usually do each time we want to take a water sample. So yes, the ocean is very deep!
And yet, it is not deep. At least not compared to its horizontal extent. The fastest crossing of the Atlantic, some 5000km, took something like 3 days and 10 hours. And according to a quick google search, a container ship typically takes 10 to 20 days these days. So there is a lot of water between continents! And it is really difficult to imagine how large the oceans really are.
One way to describe the extent of the ocean is to use the L/H aspect ratio. It is just the ratio between a typical length (L), and a typical depth (H). A typical east-west length in the Atlantic are our 5000 km used above, and a typical depth are 4 km. This gives us an aspect ratio L/H of 5000/4 which is 1250. That is actually a really large aspect ratio — the horizontal length scales are a lot wider than the vertical ones.
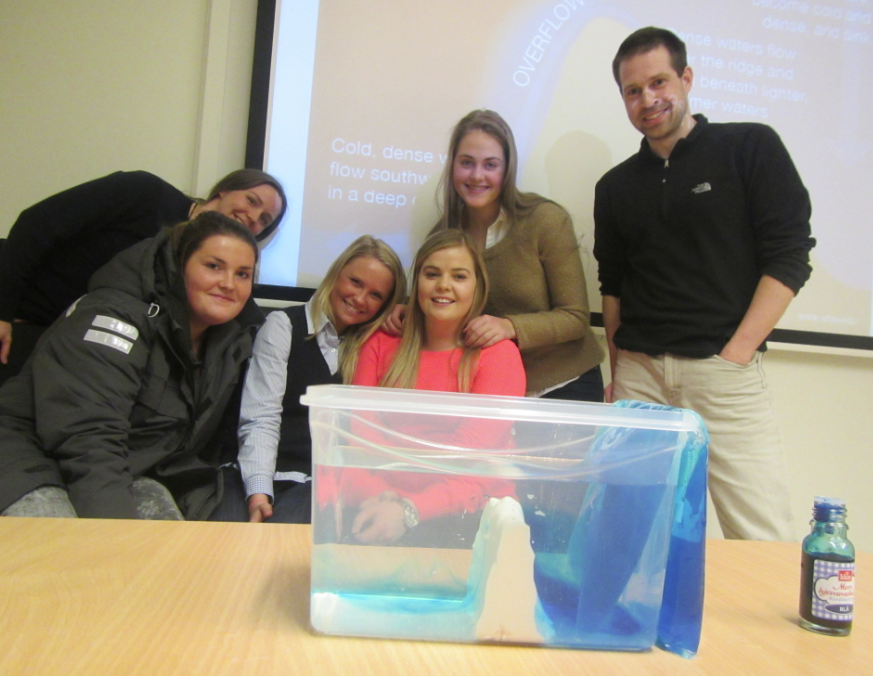
Now think about the kind of tank experiments we typically do. Here is a picture of a very simple Denmark Strait overflow experiment (more on that experiment here). You see the tank in the foreground, and a sketch of the same situation on the wall in the background. What you notice both for the experiment and the depiction is that in both cases the horizontal length scale is only about twice as much as the vertical one, leading to a L/H of 2.
This L/H of 2, however, is supposed to represent a situation that in the real world has a horizontal scale of maybe 1000 km and a vertical one of maybe 1 km, which leads to a L/H of 1000. So you see that the way we typically depict sections through the ocean is very distorted from what they would look like if they were geometrically similar, meaning that they had the same L/H ratio, which means that they could be transformed into the real world just by uniformly stretching or shrinking.
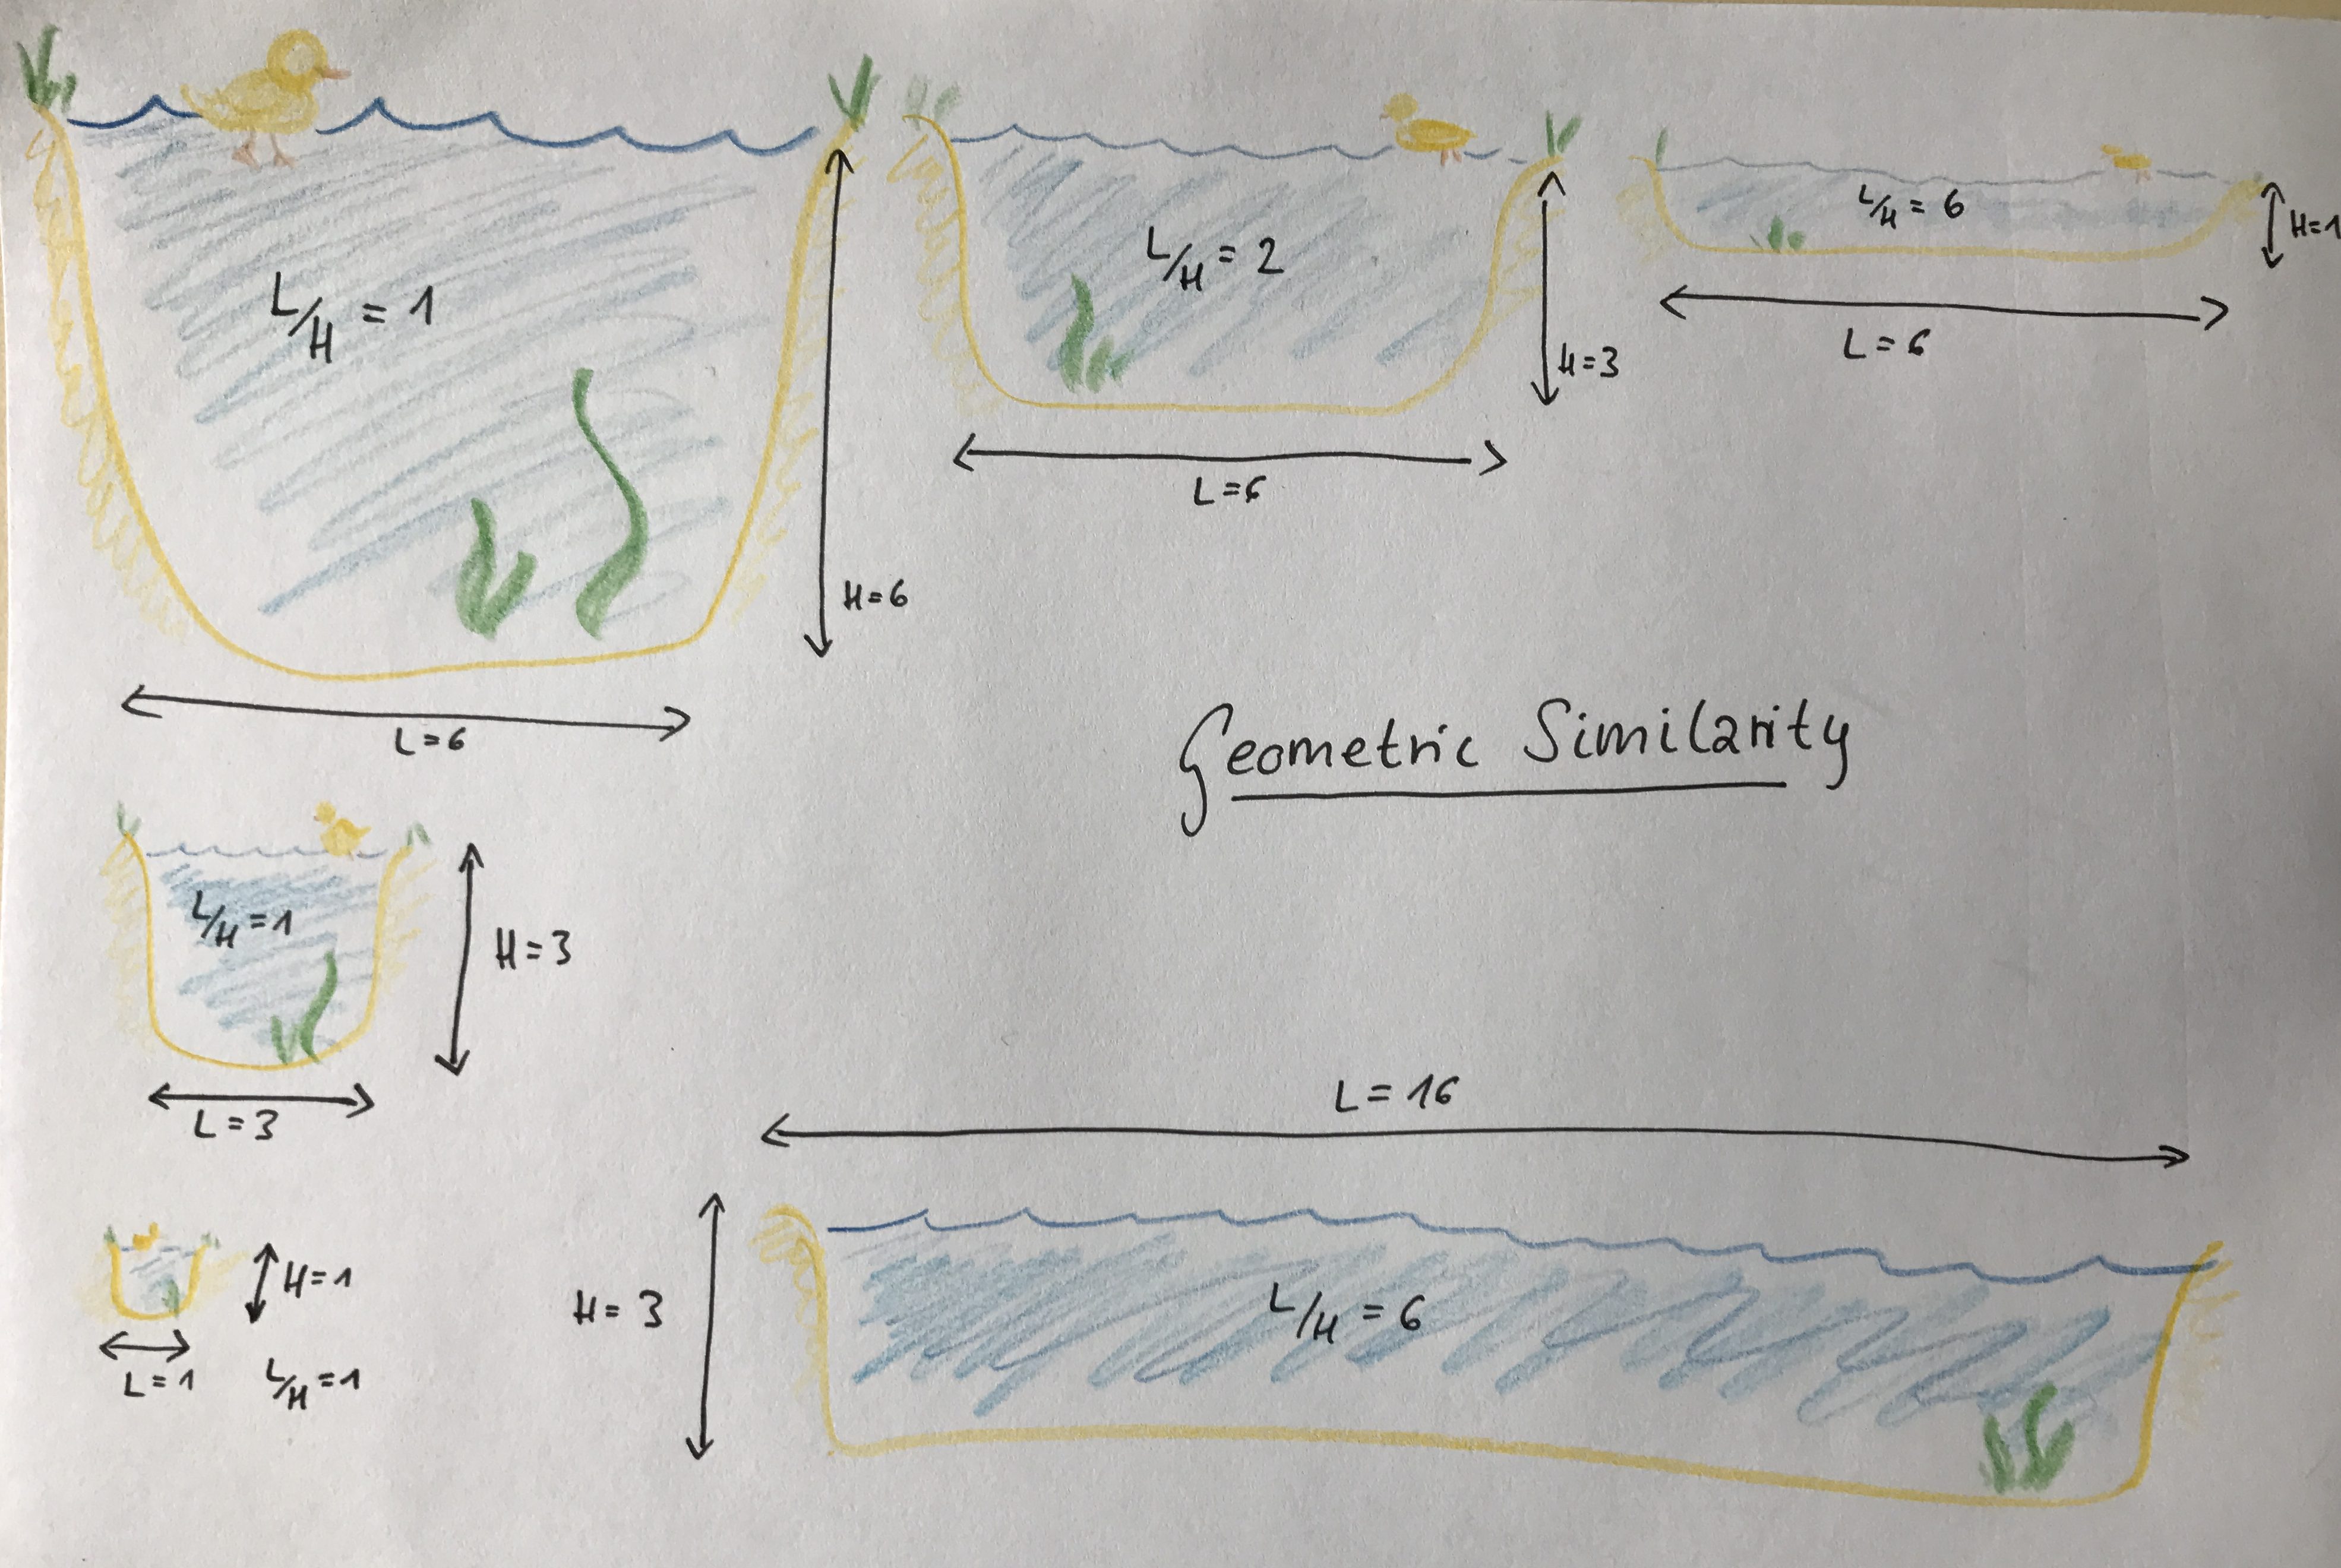
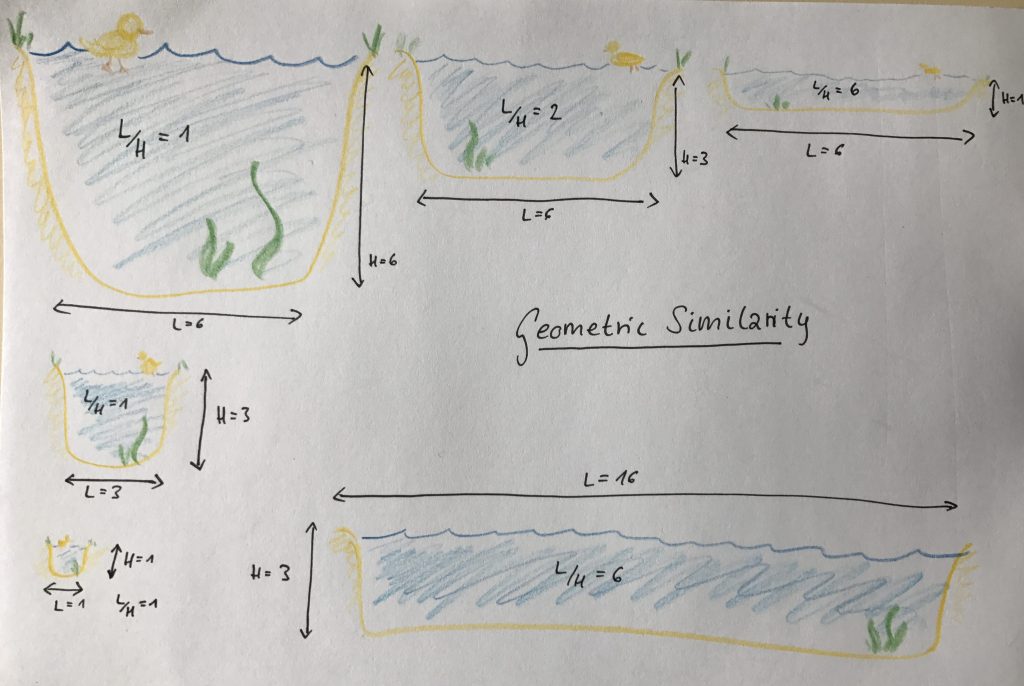
Below I have sketched a couple of duck ponds. The one on the left (with an aspect ratio L/H of 1) is geometrically shrunk below: Even though L and H become smaller, they do so at the same rate: their ratio stays the same. However going along the top row of duck ponds, the aspect ratio increases: While L stays the same, H shrinks. This means that the different ponds along the top of the picture are not geometrically similar. However, the one on the top right is geometrically similar to the one in the bottom right again (both have an L/H of 6). Does this make sense?
So in case you were wondering about why we need a tank that has 13 meters diameter — maybe now you see that it allows us to maintain geometric similarity a lot better than a smaller tank would, at least when we want to have water depths that are large enough that allow us to neglect surface tension effects and all that nasty stuff.
More on how Elin actually designed the experiments soon! :-)


