
On “fun” vs “learning”
Quick feedback tool, giving you an impression of the students’ perception of fun vs learning of a specific part of your course.
Getting feedback on your teaching and their learning from a group of students is very hard. There are tons of elaborate methods out there, but there is one very simple tool that I find gives me a quick overview: The “fun” vs “learning” graph.
This particular example is from last year’s GEOF130 “introduction to oceanography”, when we did the first in-class experiment (which I will do with this year’s class next week, so stay tuned!). Since the group was quite big for an oceanography class at my university (36 students) and I wanted to get a better feel of how each of them perceived their learning through experiments than what I would have gotten by just observing and asking a couple of questions, I asked them to anonymously put a cross on the graph where they feel they were located in the “fun” vs “learning” space after this experiment. And this is the result:
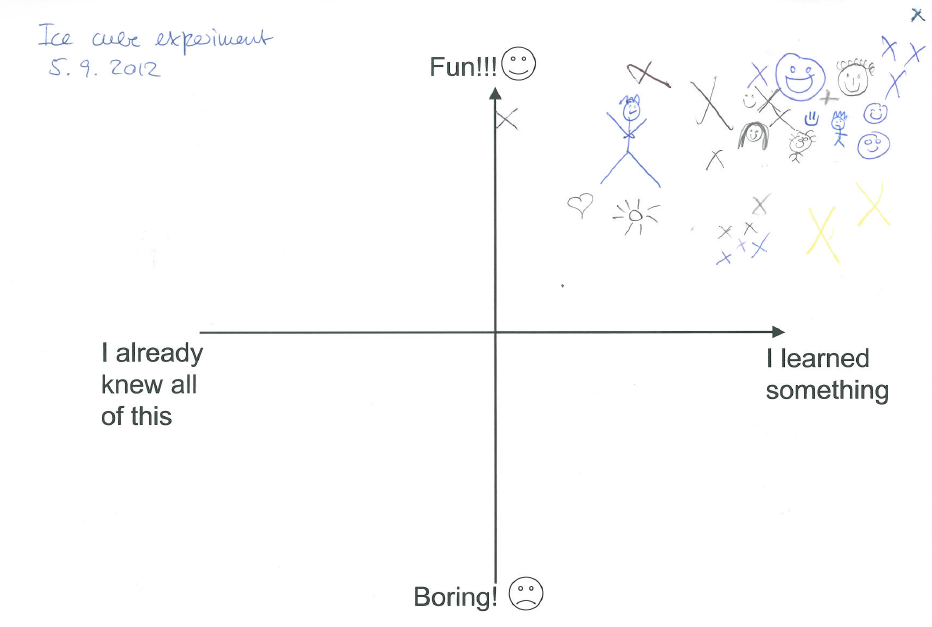
A “fun” vs “learning” graph filled in by students of the GEOF130 course in 2012 in response to an experiment that they conducted in pairs during a lecture.
Of course this is not a sufficient tool to evaluate a whole semester or course, but I can really recommend it for a quick overview!