Tag Archives: tides

Crabs in the grass — tides in Ulverston

I hope you saw my post on the Arnside tidal bore and are well aware of the awesome tides in Morecombe Bay (if not, check it out here!), so here is a little more about them.

This is what the bay looked like at the beginning of our picknick.

40 minutes later, see how there is a sand bank that appeared out of nowhere? Well, out of the water to be precise.

Tides make for really interesting beach finds. Not only are there crabs in the grass everywhere (and salt marshes are totally confusing to me. I am used to the tidal areas being muddy. Why is there grass growing in spots that are flooded with salt water twice a day?), there is also deceased jellyfish art to be found!

This is such a pretty area, and I love thistles.

Yep, more thistles. (And if there is one typical kind of picture I take over and over it’s this: sea sides with a little greenery on one side in the foreground…)

And I really liked this art!

Tidal bore in Arnside

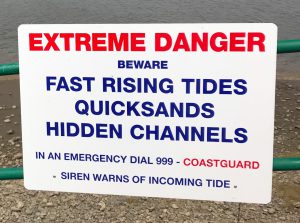
Does that warning sign above (that I showed as a teaser in yesterday’s post on wave watching in and around Arnside) make you as curious as it made me?

Usually, water rises for approximately 6 hours until high tide is reached, and then falls again for another approximately 6 hours until low tide is reached. A tidal bore, however, is an incoming tide that behaves differently from what we typically see. In a tidal bore, rather than slowly rising, the leading edge of the tide comes as one wave shortly before high tide, so the tide raises extremely quickly. (SO OF COURSE I HAD TO SEE IT!!!!!!!!)

Because this can get very dangerous if you don’t expect this to happen, there are warning signs everywhere around Arnside, and a WWII air raid siren is sounded twice before the bore arrives (that’s what you will hear when you play the video below!)

There is a lot of conflicting information out there on when to expect the bore. Why is predicting of the arrival time of the bore so difficult? While tidal forcing by the moon, the sun, and tons of other things is known very accurately, a tidal bore more than a “normal” tide is influenced by other factors, especially the wind, and the shape of the estuary and thus changes in friction (which changes constantly, see yesterday’s post).

And not only don’t we know exactly when the bore will arrive relative to predicted high water times, there is a lot of conflicting information out there on when the siren in Arnside is sounded relative to the bore. To be safe, I had to take the most conservative approach to make sure we didn’t miss it. Luckily, Astrid and Felipe were willing to wait with me for a looong time to see the Arnside tidal bore, even though none of them was really keen on it! Always important to have patient friends ;-)

Anyway, once the tidal bore arrives, it is super spectacular (I think!). We weren’t there on one of the recommended days — high tide was only 8.4 meters and locals tell you to not bother for anything below 10 meters — but I still thought it was so impressive! The video below shows it at 8 times its actual speed to give you a quick first impression:


And here are the most interesting 3 minutes of the bore when it passes right in front of us. So cool how there is actually a wave trough right before the leading edge of the bore!

And once the front has passed, this is far from over! Once the front has passed, the calm waters of the estuary are replaced by a strong current running upstream relative to the river’s original direction of flow, now quickly raising water levels all throughout the estuary. And not only that: Also very interesting flow pattern, some of which are shown in the video below.

After the front had passed and we were walking back into town, we met a couple of very excited people who had absolutely no idea what just had happened and who were all “I HAVE NEVER SEEN ANYTHING LIKE THIS! WHAT WAS THIS???”. Remember, this is what the estuary looks like before the bore arrives: lots of mud, very little water. Hardly any waves. So having the bore come in — when you’ve been waiting for it for 90 minutes, but probably even more so when you aren’t expecting anything at all — is really really impressive. And it makes you realize that they aren’t kidding when they tell you about extreme danger due to fast rising tides… Imagine water filling up all the channels at that speed — you’d be cut off from shore extremely quickly, and then separated from the shore by really strong currents. So it’s an amazing spectacle to watch, but one that one should definitely not underestimate!

Watching the tides cause an hydraulic jump in the Irish Sea!

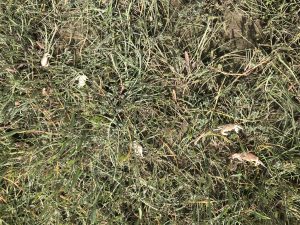
Looking at the picture above, taken in the South Walney Island Nature Reserve on our walk yesterday, what is the first thing you notice?

For me, it is not the cute little hide which is a perfect spot for seal and bird watching, for me it is — obviously! — what is going on with the waves! So much so that I spent the better part of an hour looking at the opposite direction of where all the seals were frolicking in the waves (except for one that came and played in the most fun part of the sea — more about that later).

Looking at the picture below, do you notice how different the different areas of water surface look? To the left of the wave breaker and going offshore from there, the surface is quite rough, with many waves of different wavelengths. But then going directly offshore from the wave breaker, the surface is smooth(er)! Followed by a rougher stripe, before it becomes smooth again, and a couple of well-defined wave crests reach the shore.

Zooming in on that area right off the wave breaker, you see that there are actually waves breaking towards the smoother area, away from the beach. Any idea what’s going on here, what might be causing those waves? (Hint: Even though there is a boat in the background, it is not some ship’s wake!)

What we can observe here is actually a pretty cool phenomenon, called a hydraulic jump. Due to the tide going out, there is a current developing around the tip of Walney Island, going from left to right in the picture above. This current goes over the still-submerged part of the wave breaker. Since the cross section through which the water has to squeeze is all of a sudden a lot smaller than before and after, the water has to accelerate. And it accelerates so much that waves traveling on it are just flushed downstream and the surface looks smooth(er). Only when the cross section is wider and the water has slowed down, waves become visible again.

The spot where waves are exactly as fast as the current, but running against it, is called “hydraulic jump”. You can spot it right where the waves are breaking: They are trying to go back upstream but don’t manage to, so they stay locked in one place (see here for an analogy of people running up and down escalators to explain this phenomenon). You do see hydraulic jumps “in the wild” quite often, for example in rapids in rivers (and even more so in regulated rivers, very nice example here!). In case of the hydraulic jump right here, there was a seal playing in the current, clearly enjoying the wave action (and quite possibly also feeding on poor fish that suddenly get swept away with the current).

And indeed, 20 minutes later, the same spot looks like this: the surface roughness is a lot higher towards the right of the wave breaker, but all in all there are much fewer, and much smaller waves.

And another 20 minutes later, the formerly submerged wave breaker is revealed!

I find it always so cool when you see a wave field and just from what that wave field looks like, you can deduce what the ground underneath has to be like! In this case from seeing the hydraulic jump, you know that the wave breaker has to continue on offshore.

Wanna see the whole thing in action? Then here is a movie for you!

And the coolest thing is that this spectacle will repeat with every outgoing tide, so pretty much twice a day! And I am fairly confident that it will also happen halfway between, again, when the tide comes in and the current goes in the opposite direction. I would love to go back and check!

Tides themselves don’t induce (a lot of) mixing, only tides hitting topography do. An experiment.

As you might have noticed, the last couple of days I have been super excited to play with the large tanks at GFI in Bergen. But then there are also simple kitchen oceanography experiments that need doing that you can bring into your class with you, like for example one showing that tides and internal waves by themselves don’t do a lot of mixing, and that only when they hit topography the interesting stuff starts happening.

So what we need is a simple 2-layer system and two different cases: One with topography, one without. And because we want to use it to hand around in class, the stratification should be indestructible (-> oil and water) and the container should be fairly tightly sealed to prevent a mess.

Here we go:

There definitely is a lot to be said for kitchen oceanography, too! Would you have thought that using just two plastic bottles and some oil and water could give such a nice demonstration?

Let’s guess tides!

Actually, there is no need to guess. If you tilt your head 45 degrees to the left, you are looking at Hamburg the way it would be shown on a map, North up. The Elbe river, which you see in the foreground, flows east-to-west into the North Sea. And now there are at least two spots in the image below where you can see fronts in the water, more turbid water in the main river bed, clearer water in side arms and bays. Those fronts always start at upstream headlands and go downstream from there, therefore it must be ebb tide, with the water going out into the North Sea. Easy peasy :-)


Funny how “upstream” and “downstream” make so little sense in a tidal river, yet everybody knows what I mean…

Would be interesting to see if you can see fronts when the tide is coming in, too, when the muddy river water is pushed into the more stagnant side arms and bays. I expect so but don’t actually know. Maybe I will be able to observe it on some future flight?

Tides

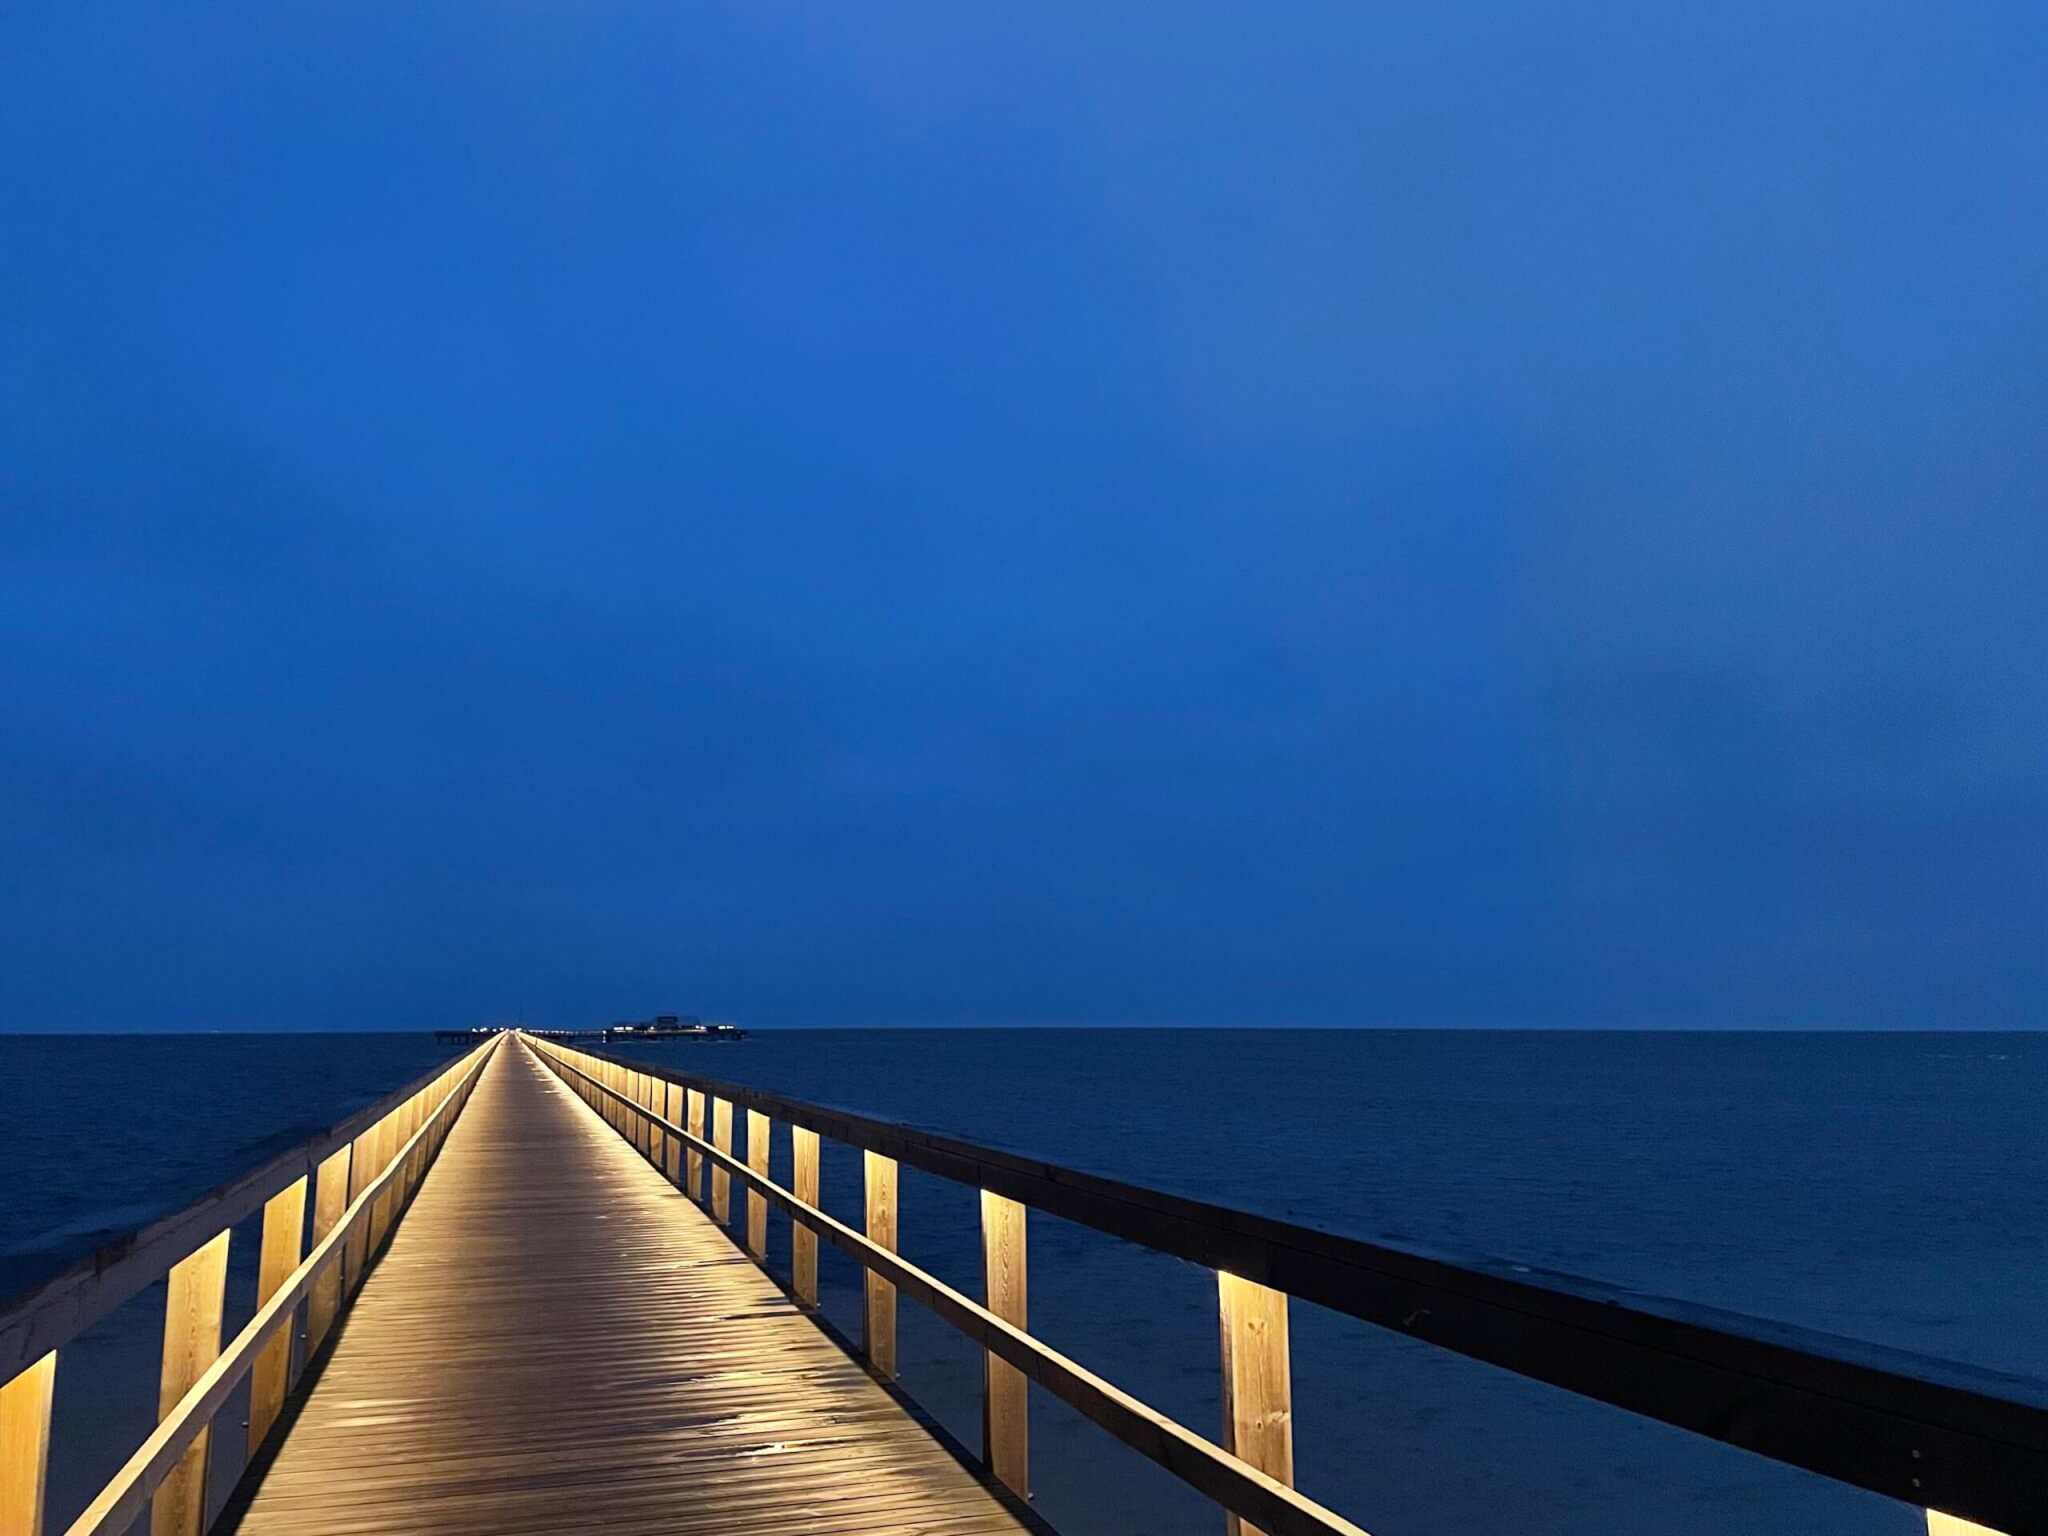
Another thing I can’t stop being fascinated by: Tides.

Sometimes you look towards Hastings Pier, and there is water all the way up to the sea wall. Those are the times I am too stunned to take pictures, unfortunately.

Other times, the sea retreats:

IMG_5732

Further and further.

IMG_5623

And then at some point I can’t zoom out enough to capture the building on the pier at the same time as the water’s edge…

IMG_5599

Learning about tides from art moored in a river

Disclaimer: This post might well be called “fun with tides” similar to Sheldon Cooper’s “fun with flags” — it is super nerdy, but at least I am having fun!

There is some really cool art around Hamburg, and the one I want to talk about today is called “four men on buoys” by Stephan Balkenhol: Four wooden statues of approximately live-sized men, standing on little floats, moored in four different spots all over Hamburg. One of them happens to be on the Elbe river, visible when you cross the bridge from where I work over to the city center. You ca see the scene below: The train going across the bridge, and the guy (in the white shirt) standing on the river.

IMG_5376

What you can sort of see in the picture above from the yellow buoy being tilted to the right: There is quite a strong current in that river. And what you can’t see in the picture, but will find out below: It’s a tidal current, hence its direction reverses regularly.

You can guess what that means for anything moored in the river: Yes, it will change its position following the tides!

This is where my nerdy self comes in. Whenever I take the train across that bridge, I try to snap a picture of the guy on the buoy. It is quite a difficult endeavour — the train usually goes pretty fast, and I never know where exactly the guy is going to be (well, I guess I could look at a tide table beforehand, but I’ve never done that) and taking pictures out of a train window is not that easy in itself. But sometimes it works out beautifully to show both the position of the guy and the currents:

3_32_nach_2016-05-09 10.47.55

The guy on the buoy 3 1/2 hours after high water that day

As you see in the image below, the wake is in the direction towards the viewer. This means that the water is flowing towards the viewer, i.e. downstream. You can see that the current is fairly strong because the wake is very pronounced (“very” at least relative to some other pictures you’ll see later).

For this post, I checked my phone and found a collection of 16 pictures of that guy. So clearly I had to see when they were taken relative to the time of high water that day. In the image below, each tick marks the time of one of my pictures relative to zero, the time of the nearest high water.

1_38_nach_2016-04-25 06.07.56 copy

The guy on the buoy, plus an eye-balled plot of my data points. 0==high water. This picture was taken 1 1/2 hours after high water that day.

As you can see, I seem to be on the train more when it’s close to high water than close to low water. Funny!

Now, when I show you all my 16 data points, let’s remember that we are now only looking at time before/after high water. We are neglecting important things like where exactly the picture was taken from (I’m excited to catch the guy on the buoy at all from a fast train!) or where we are in the spring / neap cycle. Plus the different times of day when the pictures were taken and the different weather conditions make comparison hard. Yet, it’s fun to see how the strength and even direction of the current (which you can see by looking at the wake and the position of the guy relative to the bridge) is changing!*

Before I show you the pictures, a CALL TO ACTION: If you happen to be on that train, snap a picture and send it to me! I’ll happily compile a better series with more data points! I’ll continue taking pictures, too, that’s for sure! :-) Imagine how you could use this kind of data in teaching! If I were to teach a class on tides at this university, I would have students collect this type of data and use it to say something about the tides on Elbe river. If there is enough data (which should be easy enough to get with many students commuting across this bridge every day), I am sure one could learn a lot from this case study! And working with data students collect themselves is always more fun than looking at some data set in a text book anyway. Plus how much more exciting would commuting get for those students once they start observing in this way, and starting to think about water, instead of just being bored on the train? There are actually a couple more times where you see the river quite well on the train journey between university and the city centre, so there might be many more case studies easily done if only people started looking for them…

And here are all 16 pictures, in the order going from low water to high water to low water. The caption includes the time before/after high water. Enjoy!

Guy on buoy. Picture taken 4h 50min before high water.

Guy on buoy. Picture taken 4h 50min before high water.

Guy on buoy. Picture taken 4h 02min before high water.

Guy on buoy. Picture taken 4h 02min before high water.

Guy on buoy. Picture taken 2h 34min before high water.

Guy on buoy. Picture taken 2h 34min before high water.

Guy on buoy. Picture taken 1h 14min before high water.

Guy on buoy. Picture taken 1h 14min before high water.

Guy on buoy. Picture taken 1h 06min before high water.

Guy on buoy. Picture taken 1h 06min before high water.

Guy on buoy. Picture taken 1h 02min before high water.

Guy on buoy. Picture taken 1h 02min before high water.

Guy on buoy. Picture taken 0h 27min before high water.

Guy on buoy. Picture taken 0h 27min before high water.

Guy on buoy. Picture taken 0h 26min before high water.

Guy on buoy. Picture taken 0h 26min before high water.

Guy on buoy. Picture taken 0h 25min before high water.

Guy on buoy. Picture taken 0h 25min before high water.

Guy on buoy. Picture taken 0h 12 min past high water.

Guy on buoy. Picture taken 0h 12 min past high water.

Guy on buoy. Picture taken 0h 48min past high water

Guy on buoy. Picture taken 0h 48min past high water

Guy on buoy. Picture taken 1h 17min past high water.

Guy on buoy. Picture taken 1h 17min past high water.

Guy on buoy. Picture taken 1h 38min past high water.

Guy on buoy. Picture taken 1h 38min past high water.

Guy on buoy. Picture taken 1h 48min past high water.

Guy on buoy. Picture taken 1h 48min past high water.

Guy on buoy. Picture taken 3h 32min past high water.

Guy on buoy. Picture taken 3h 32min past high water.

Guy on buoy. Picture taken 6h 05min past high water.

Guy on buoy. Picture taken 6h 05min past high water.

*Btw, sometimes you see that my mapping is clearly not right (for example, when the wake is in the direction away from the viewer, we cannot be past high water already, since the current is clearly still going up the river, so the tide hasn’t turned yet). These errors might be due to me not taking enough care when looking up the tidal data (yep.) or the tide tables that were used not accounting for factors that might have influenced the tides other than the classical tidal components, like for example wind conditions. I could, of course, go back and look at actual data and/or double-check, but I am happy with what I can see from the data already. If you are not, please knock yourself out and I’d be happy to host your guest post with corrections of my post! :-)

Ice on Elbe river in Hamburg. By Mirjam S. Glessmer

Reading ice on a river as tracer for flow fields

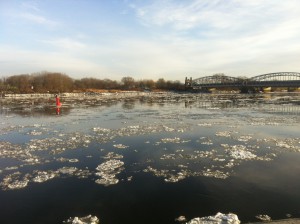
For most of my readers it might be pretty obvious what the movement of floating ice says about the flow field “below”, but most “normal” people would probably not even notice that there is something to see. So I want to present a couple of pictures and observations today to help you talk to the people around you and maybe get them interested in observing the world around them more closely (or at least the water-covered parts of the world around them ;-)).

For example, we see exactly where the pillars of the bridge I was standing on are located in the river, just by looking at the ice:

What exactly is happening at those pillars can be seen even more clearly when looking at a different one below. You see the ice piling up on the upstream side of the pillar, and the wake in the lee. Some smaller ice floes get caught in the return flow just behind the pillar. Now imagine the same thing for a larger pillar – that’s exactly what we saw above!

And then we can also see that we are dealing with a tidal river. Looking at the direction of the current only helps half of the time only, and only if we know something about the geography to know which way the river is supposed to be going.

But look at the picture below: There we see sheets of ice propped up the rails where the rails meet the ice, and more sheets of ice all over the shore line. As the water level drops due to tides, newly formed ice falls dry and that’s all the sheets of ice you see on land.

The bigger ice floes in the picture have likely come in from the main arm of the Elbe river.

Screen Shot 2016-01-13 at 06.26.57

Small port on a tiny bay on the Elbe river in Hamburg. Look at the sheets of ice on shore!

It is actually pretty cool to watch the recirculation that goes on in all those small bays (movie below picture). Wouldn’t you assume that they are pretty sheltered from the general flow?

Screen Shot 2016-01-13 at 09.40.53

Tidal elevations and currents in Fowey, Cornwall

Tides in Cornwall.

The other day we talked about a very simplistic models of tides in a glass, and how the high tide and low tide travel as a wave around an ocean basin. This isn’t really a news flash for people reading this blog, I know. But it is sometimes hard to imagine how big the differences between high tide and low tide actually are, since the water rises and falls so slowly it is hardly noticeable.

IMG_7708

Fowey harbor in Cornwall at high tide

On my most recent holiday (even though “most recent” means “some time during summer”, which is actually quite a while ago), A and I stayed in Fowey and had the best time. Anyway, we happened to stroll along the pier, and I happened to snap this picture.

Some more strolling happened (and we might or might not have had Cornish Cream Tea), and six or so hours later we were back in the same spot, to see this:

IMG_7765

Fowey harbor in Cornwall at low tide

The water was gone! And I still find it absolutely fascinating.

Especially since at first glance the tides don’t seem to result in alternating currents. Which is really not possible.

IMG_7893

Fowey harbor – incoming tide

But it took more than just a second look to realize that the tide in the picture above is coming in, whereas the one below is going out (Pictures taken from pretty much the same spot).

Screen shot 2014-08-17 at 8.29.59 PM

Fowey harbor – tide is going out

You can only see that if you look at the moored sailing ships far across the water. The colorful boats always face out towards the sea – because they are moored between two moorings and are not turning freely around a single mooring as I had assumed they would. Duh! But for the yachts in the background it is clear they are only moored in one spot: They face right on the upper, and left on the lower picture. Yep, those are the kind of things that fascinate me while I’m on vacation! :-)

Tides in a glass

A very simple experiment to show how waves can travel around an ocean basin.

I wrote these instructions for a book project that I was lucky enough to get involved in at the very last minute and figured I could just share them here, too. Why not try a new style every once in a while? You tidal purists out there – come up with a better experiment if you aren’t happy with this one! :-)

  • Age: 6 years and above
  • Group size: 1-3 per group
  • Time: 15 min
  • Topic: Tides in enclosed basins 

Resources and Materials:

  • 1 clear plastic cup
  • 1 waterproof pen
  • water

Introduction:

[In a previous experiment] we have learned how tides are caused by the sun and the moon. In the picture there, we see the two “mountains” of water that form on either sided of the earth. The earth rotates underneath those two “mountains” of water, which is what causes high tides twice a day.

But what happens when those “mountains” of water reach a coast? Clearly the continents are not flooded twice a day every day, so the “mountains” of water cannot travel all the way around the globe undisturbed. What does happen instead is that the tidal wave will propagate around the rim of an ocean basin, even in semi-enclosed basins like the North Sea, which we will show in the experiment below.

  1. Fill the plastic cup approximately half full with water.
  2. Mark the still water level with a permanent marker.
  3. Gently start twirling the cup and observe how the water level starts changing: On one side of the cup it rises, on the other side it falls.
  4. Continue twirling the cup and observe how the “mountain” of water moves all the way round the cup, leaning against the side of the cup, and how opposite of the “mountain” a “valley” forms that also travels around the cup.
  5. Mark those two new water levels: The higher one is the high tide line of your ocean in a cup, the lower one the low tide line.
Tides_MSB

Figure 1: Twirl a cup filled with water to see how tides propagate around an ocean basin

This is how high tide and low tide travel around an ocean basin. In the real world, though, coastlines are not as smooth as the walls of a cup, and also ocean basins are connected to each other, so tides in different basins interact. For a real world example, look at the tides in the North Sea, shown in Figure 2.

Tides2_MSB

Figure 2: Simplified timing of tides in the North Sea.