
One of the instruments that was used on our recent student cruise was the so-called MSS (“MicroStructure Sonde”, sometimes also called VMP, “Vertical Microstructure Profiler”) — an instrument that is used to measure how much mixing is going on in the ocean. Those measurements can help us figure out e.g. renewal rates of bottom water in fjords, which are interesting because of the very low oxygen concentrations found there, and their impact on biogeochemistry. And of course it’s also interesting from a purely physical oceanographic curiosity :-)
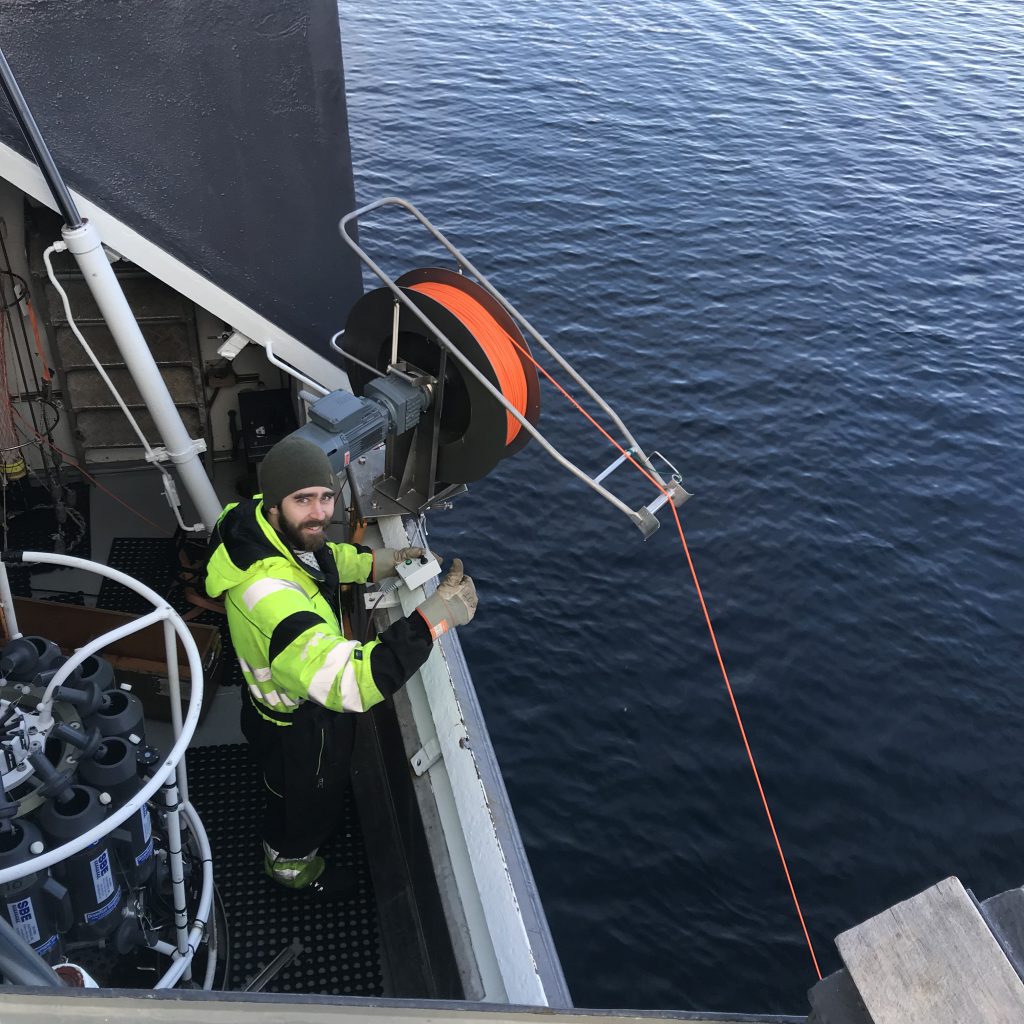
In the picture below, you see the MSS being deployed: It’s a slim instrument, maybe 1.5m in length, that is attached to an orange cable that runs on a small winch.
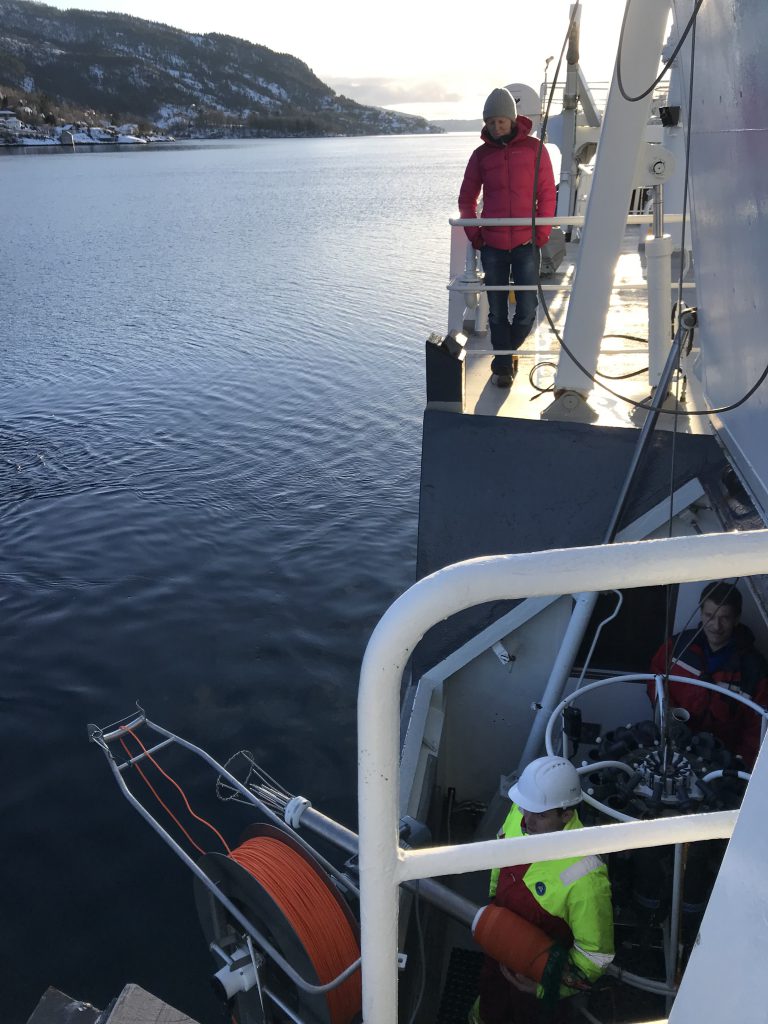
And a big THANK YOU to cruise leader Elin (observing from the upper deck) for bringing me along on this cruise! :-)
At the end of the instrument that sticks over the railing in the picture above, you can make out little pins, protected by a metal cage. Those are the sensors for both temperature and velocity shear, both measuring at very high frequency, many many times per second. They are also very sensitve, so in the picture below you see the wooden crate that is used for storing the instrument in between stations.
Once the instrument is deployed into the water, it is not just lowered down in the way a CTD is, but it has to be free-falling through the water. In order to achive that, the person running the winch has to constantly watch the cable going into the water to make sure there is some slack on the cable.
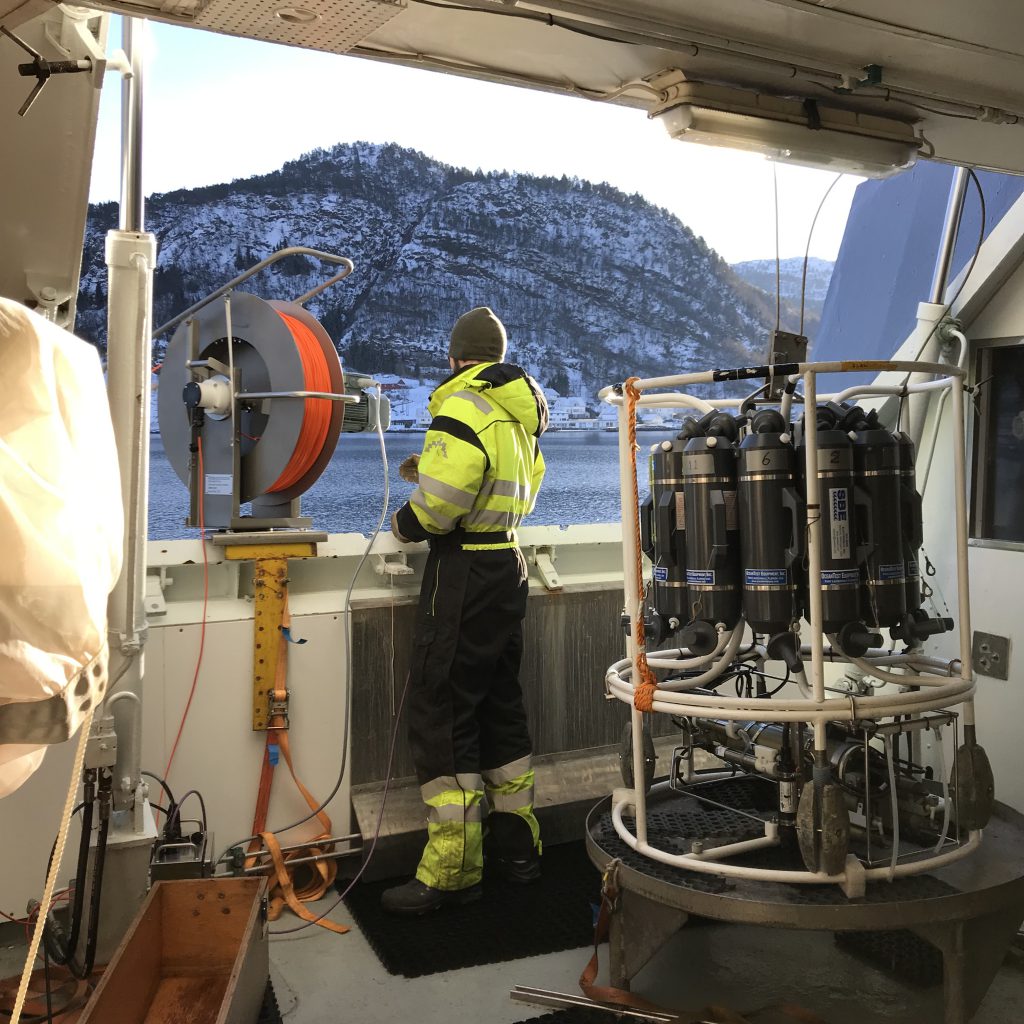
Algot is running the MSS winch
A second way to make sure the instrument is free-falling is to constantly monitor the incoming data on a PC onboard the ship.
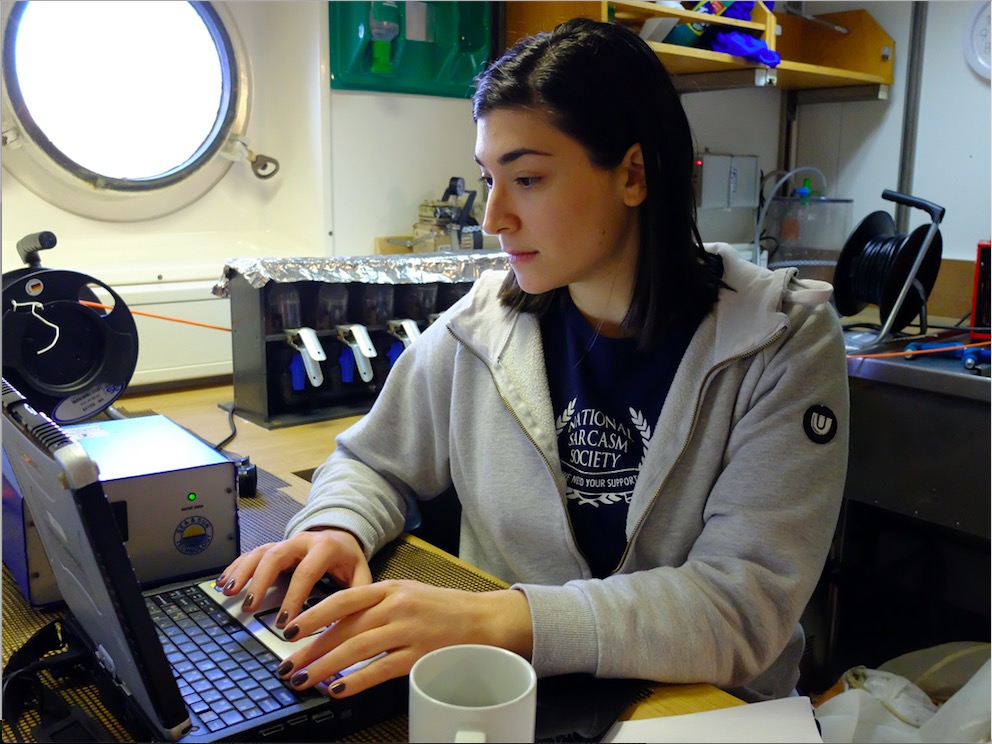
Elina is working the MSS “inside job” (Picture by Sonja Wahl)
While the data is being monitored, also the depth the instrument is at is being monitored, or rather its pressure. Since the instrument is free falling, it is not a simple feat to make sure it gets fairly close (approximately 10m) to the bottom, but does not hit the bottom and destroy the sondes. One way we’ve done that on the student cruise is by stopping the outgoing cable when the instrument was at 75% of the water depth and let it fall, and then once the instrument is within 20ish meters of the bottom to start hauling the cable back in (“panic” in the list below ;-))
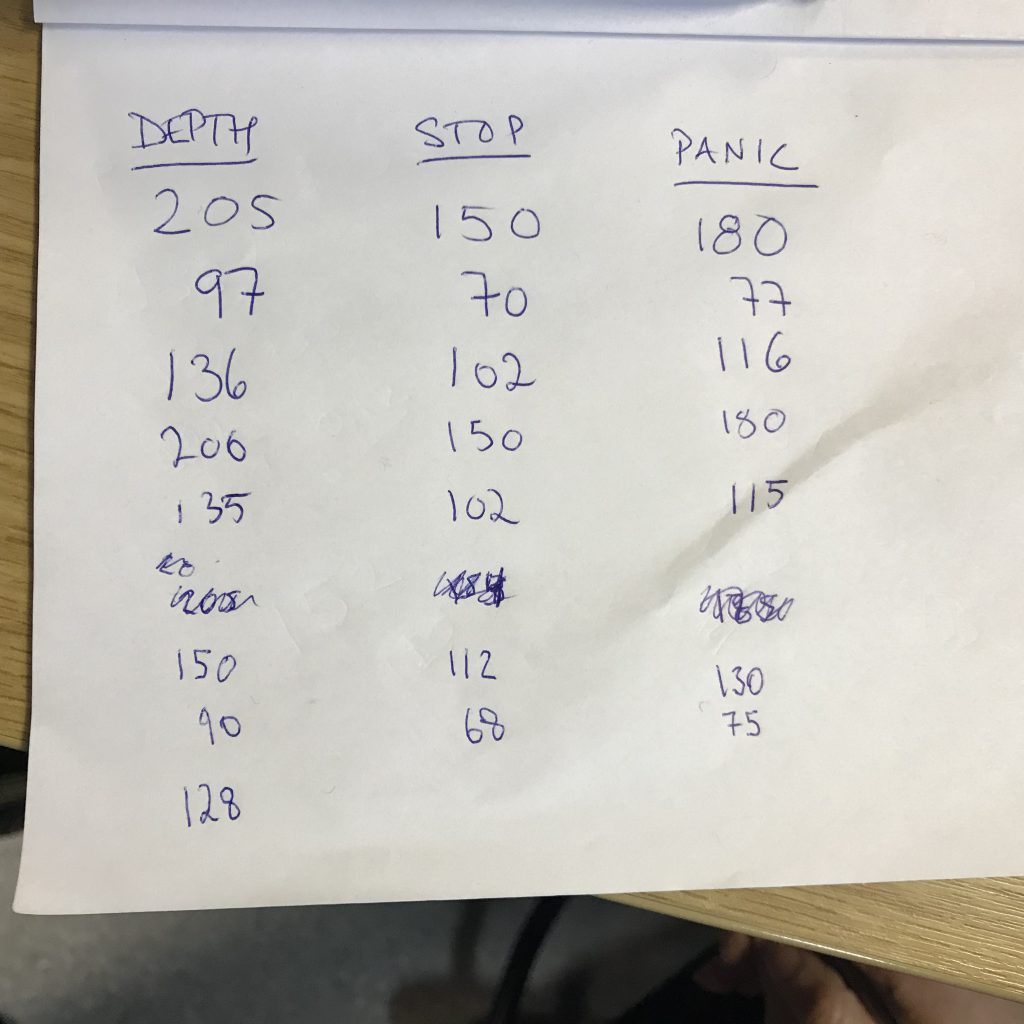
Snapshot of the piece of paper used to keep track of what’s going on at the current station
Looking at the picture of Algot below, you know that the instrument must be on its way up. Why? Because there is clearly no slack on the cable!
Algot is bringing the MSS back to the surface
In the picture below, do you see the green fringe on the instrument, as well as the rope slung around the metal protection cage thingy for the sondes? Those are there to make sure that no eddies (and especially no trains of eddies) develop while the instrument is falling, because if the instrument was vibrating or moving in some way other than just falling freely, that would influence the data we measure.
The instrument is then brought back on board, and we are ready for the next station!
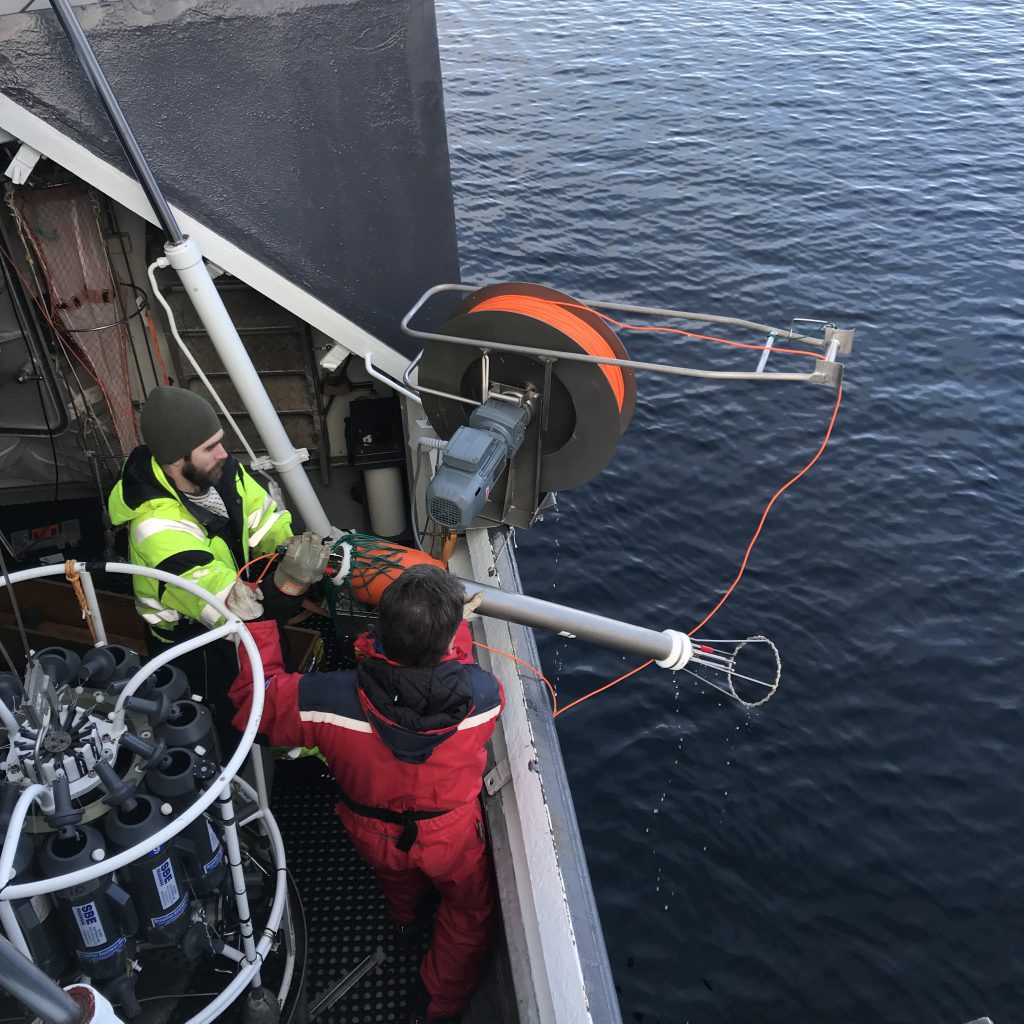
Algot and Arnt Petter bring the MSS back on board
And which spots did we measure turbulence in? In many, but especially on either side of the fjord’s sill, because that’s where we expect mixing due to tides going in and out (which we also saw in the fjord circulation tank experiment!).