Student cruises (part 4 of many – weird profiles)
When a CTD profile suddenly looks really weird.
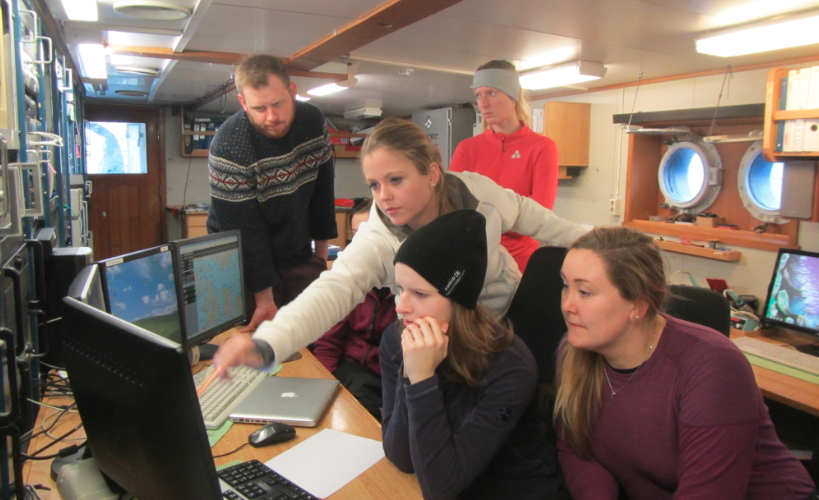
As mentioned before, student cruises seem to bring out the weird experiences with CTDs. My theory is that it’s the world testing us. It would be bad enough to deal with this stuff if we were on CTD watch in the middle of the night on our own, but dealing with it in front of a group of eager students, all asking questions when you just want to think, is the ultimate test of whether you know your stuff and have the nerves to deal with anything.
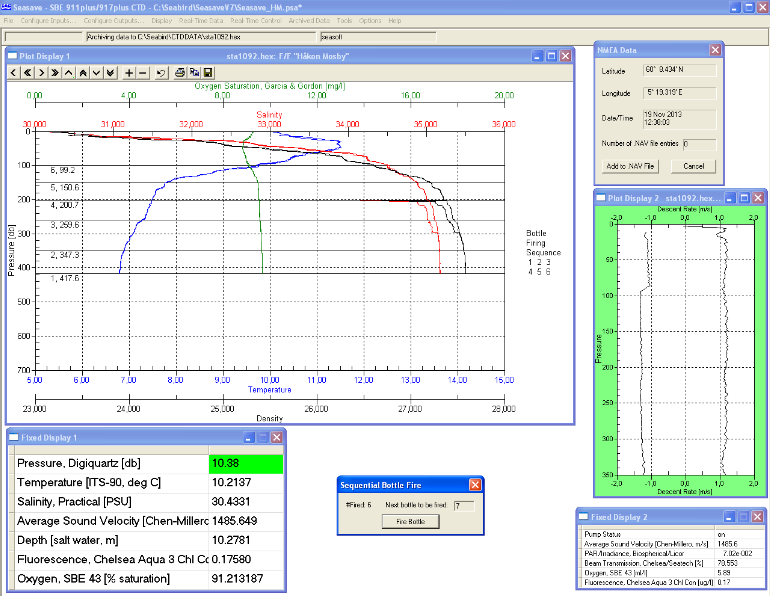
So, of course, this year’s GEOF130 student cruise couldn’t be an exception. After dealing with an unfortunate encounter of the CTD and the bottom about which we shall not say any more than this, the next profile looked like this:
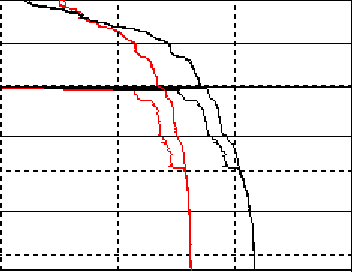
Not seeing it yet? Let me zoom in for you:
A really weird offset between downcast and upcast occurred in density and salinity, persisted for about 100m, ended with a huge spike and then disappeared.
So what happened? I have actually no idea. I’ve seen jellyfish being sucked into the pump, resulting in fresh spikes. And that salinity and density react very similarly even for anomalies is not that surprising, seeing that one is calculated from the other. But why would the shape of the profile stay the same, only shifted towards fresher values and lower densities? Ideas, anyone?


