An overturning experiment
A simple experiment that shows how the large-scale thermally-driven ocean circulation works.
Someone recently asked me whether I had ideas for experiments for her course in ocean sciences for non-majors. Since most of the experiments I’ve been showing on this blog were run in the context of Bachelor or Master oceanography-major courses, she didn’t think that the experiments were as easily transferable to other settings as I had claimed.
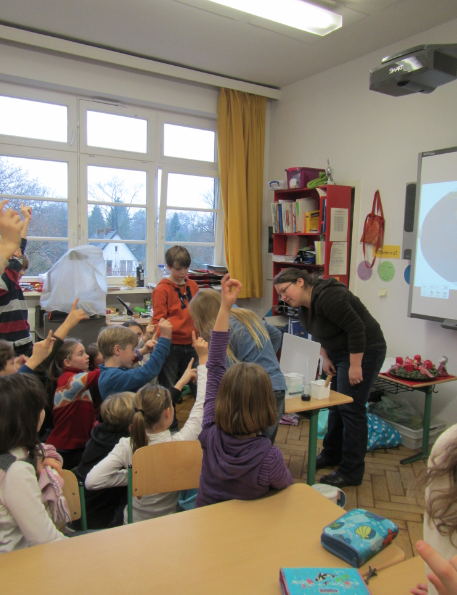
So here is proof: You can do pretty complex experiments with non-university level students. To prove my point, let’s go to a primary school.

Experimenting with a primary school class.
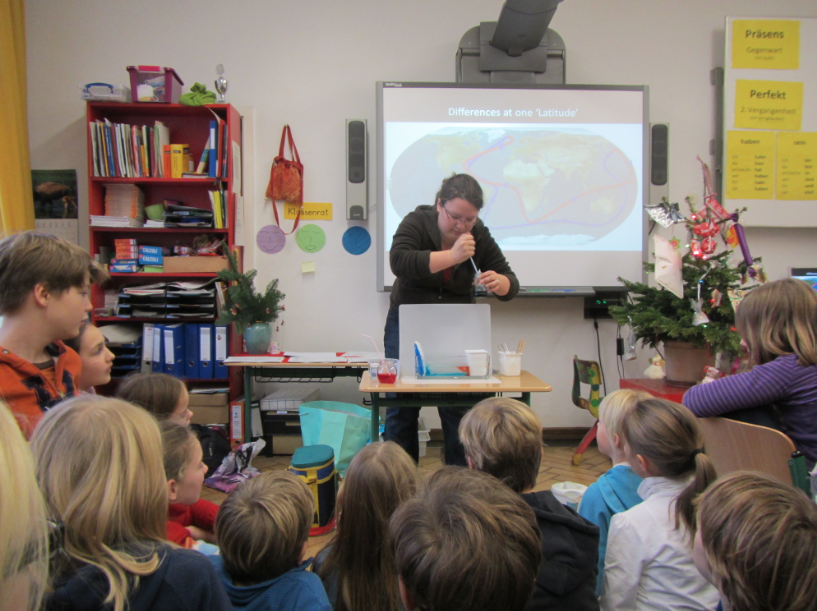
The experiment we are running here is the global (thermal) conveyor belt. In a long and narrow tank filled with water, a heating and a cooling element are inserted at either end. Dye is added onto the elements to visualize the flow of water.

Adding dye to visualize the thermally driven flow in the tank.
In the image above you see that there is something blue near the bottom of the tank, and I am adding red dye to the other side. Blue is used to track the cold water and red to track the warm water (intuitive color-coding goes a long way, no matter how old your students are!)

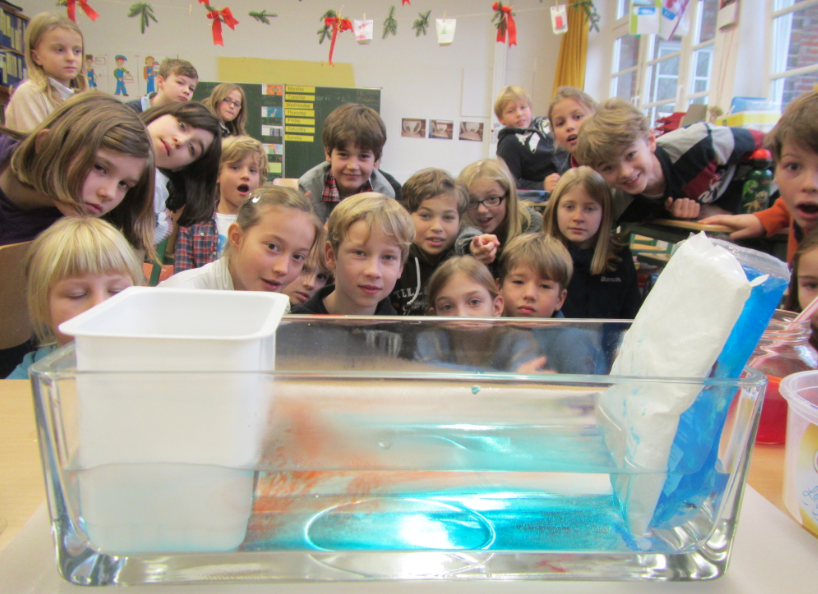
The experiment as seen by the teacher.
What you see here is the cold blue water sinking to the bottom of the tank and spreading, and the warm red water rising to the water’s surface and spreading there. As the warm water reaches the cooling pads, it gets cooled, becomes denser and sinks. Similarly, the cold water reaching the warming pads becomes less dense and rises, closing the loop.
#KitchenOceanography - Adventures in Oceanography and Teaching says:
[…] and any place, cheap to purchase or replace, as well as easily transportable to use for example in (primary!) school lessons, university classes, conference presentations, workshops, or skiing […]
What’s #kitchenoceanography all about? | Dr. Mirjam S. Glessmer says:
[…] and any place, cheap to purchase or replace, as well as easily transportable to use for example in (primary!) school lessons, university classes, conference presentations, workshops, or skiing […]
Separating signal from noise | says:
[…] in fact people [i.e. my parents] even told me). In my defense: The pictures of this experiment I shared on this blog are all less noisy, and I even explicitly addressed and discussed some of the noise! But still, […]
A very simple overturning experiment for outreach and teaching | says:
[…] one of my side-projects I needed higher-resolution photos of the overturning experiment, so I had to redo it. Figured I’d share them with you, […]
Thermally-driven overturning circulation | says:
[…] one of my favorite experiments – the overturning experiment (and more, and […]
An overturning experiment (part 2) | says:
[…] ← Previous Next → […]