Getting a “feeling” for ocean currents using adrift.org.au
It is very difficult to get a feeling of how fast and how far ocean currents can transport heat, plankton, plastic, or many other properties and things. Even looking at maps that depict the ocean currents it is hard to translate those lines into what that actually means in the real world. Here is an activity you can have your students do to help them get a feeling for the scales – both temporal and special – involved here.
Thanks to Dr. Erik van Sebille for creating such a great tool!
Here is the activity I would suggest:
On the website http://www.adrift.org.au [edit: now https://plasticadrift.org] you can release virtual rubber ducks and watch how they are transported by surface currents around the world oceans for the next 10 years.
Can you predict what the plastic distribution will look like 10 years after you released the plastic in the ocean?
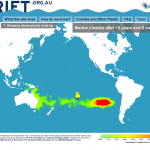
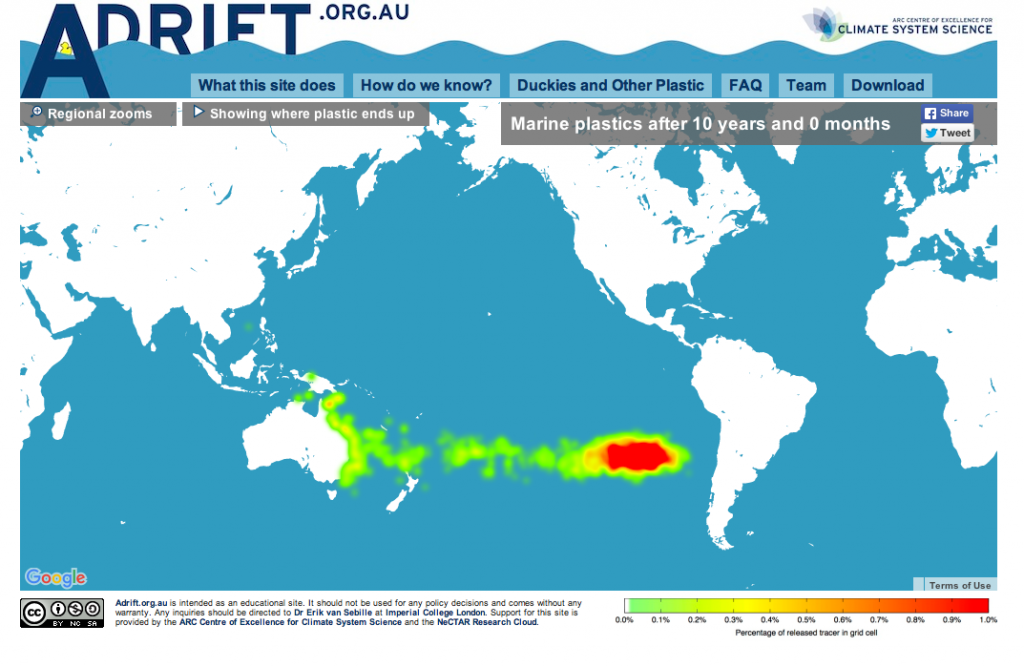
- Look at the image below. Plastic is distributed all throughout the South Pacific Ocean. Where would one have to release the plastic for the distribution to look like this 10 years later?
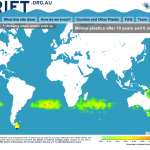
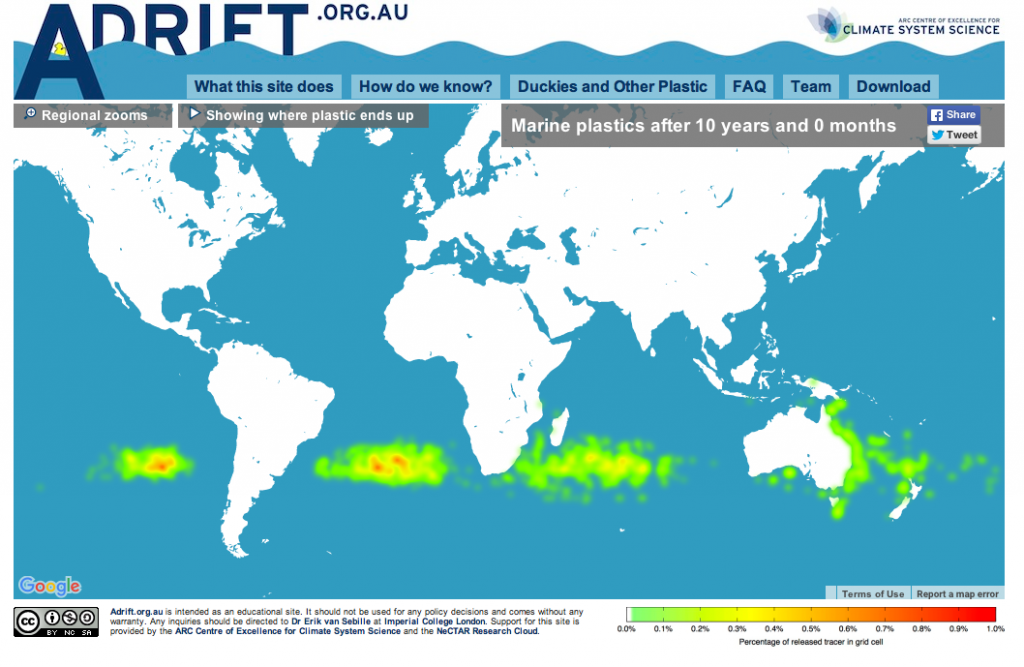
- In this image, the plastic is spread out throughout the Southern Hemisphere over all three oceans. Where would one have to release the plastic to find such a distribution 10 years later?
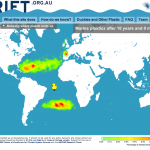
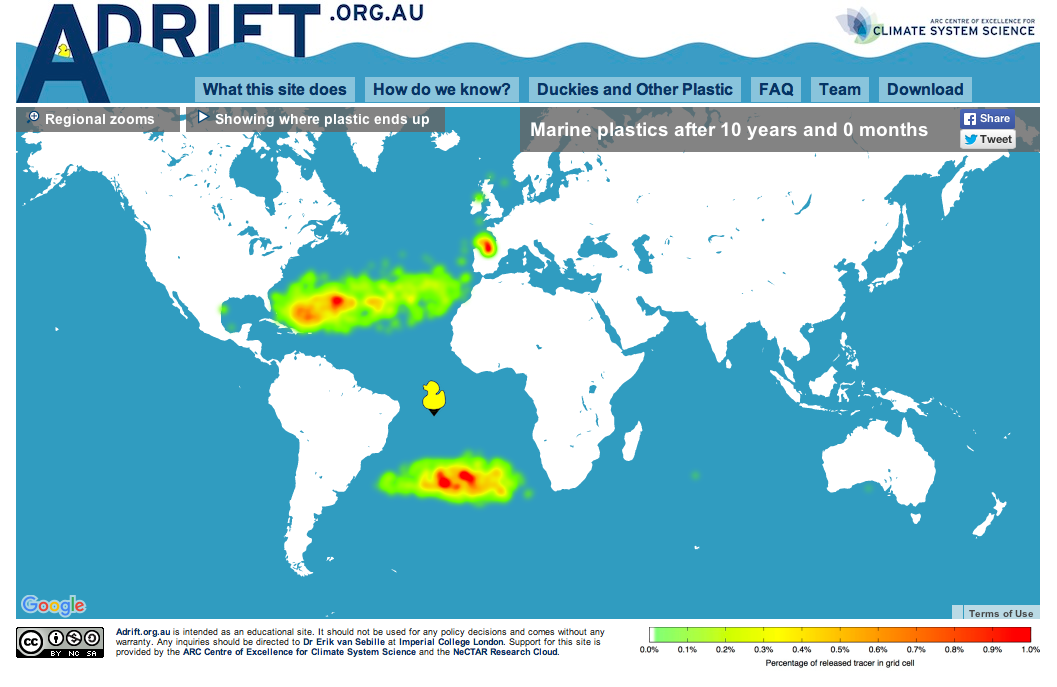
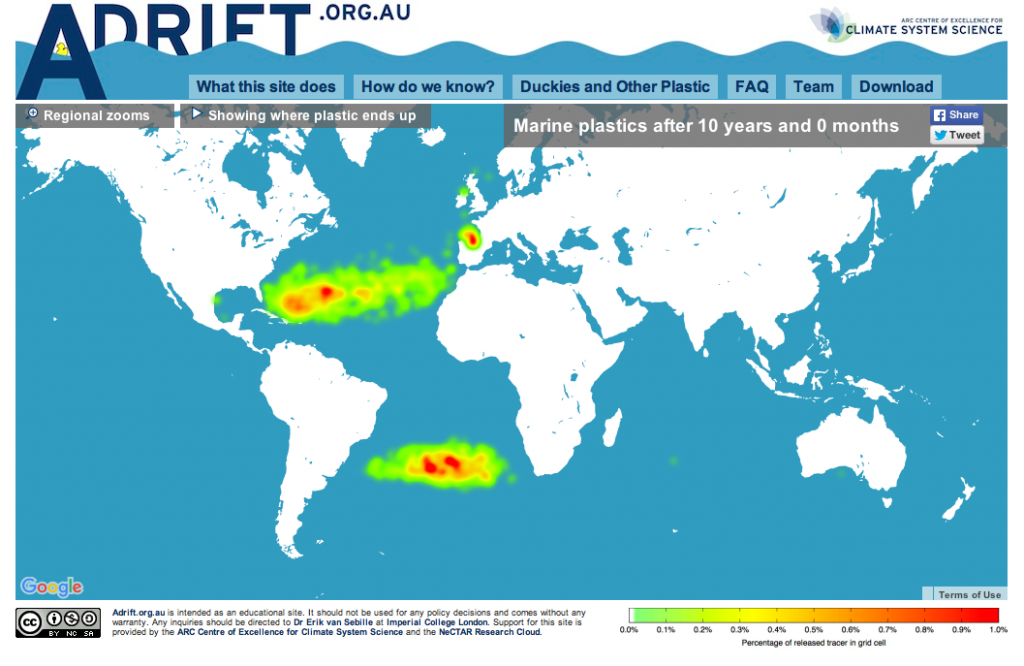
- Now, in the image below, plastic can be found in both subtropical gyres in the North and South Atlantic. Where would you have to dump the plastic trash to reproduce such a distribution?
P.S.: If you use this in teaching, it’s a good idea to bring the un-edited versions of the plots as a backup (so you still see the ducky where the tracer was initially released). Here they are:
