[Other languages: German | Norwegian | Portuguese]
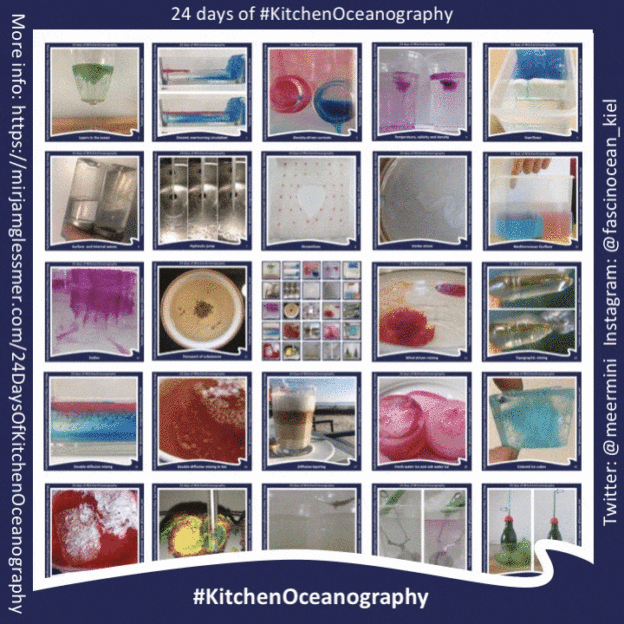
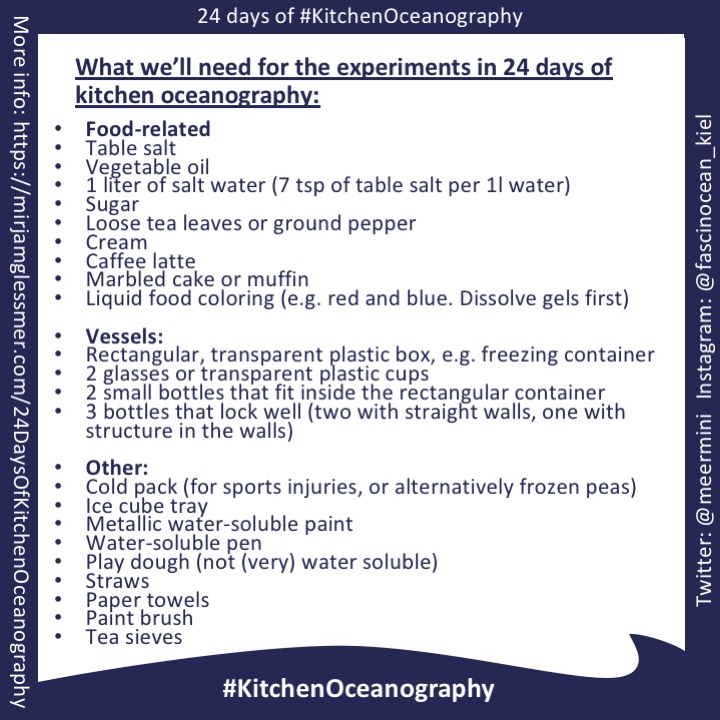
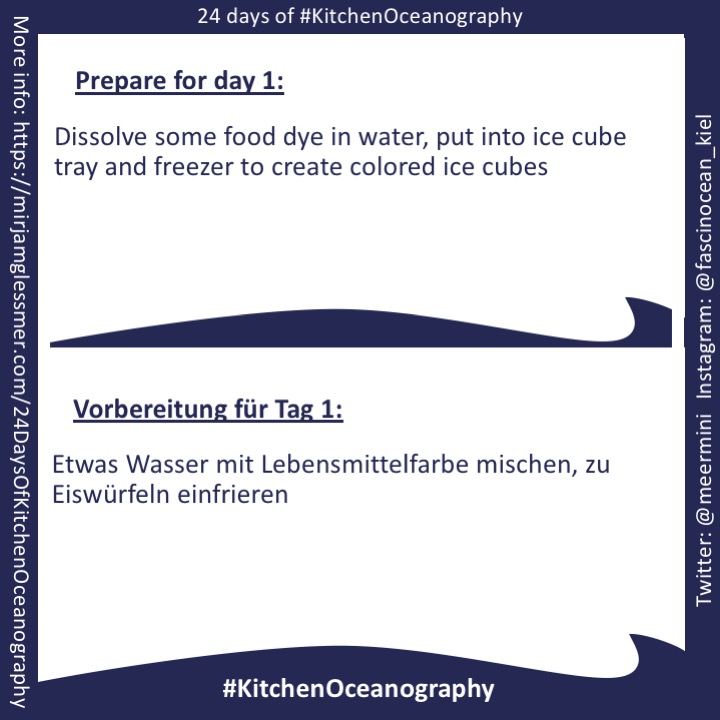
Welcome to 24 days of #KitchenOceanography! Below you find 24 easy experiments (all can be done using common household items!) that will come online, one by one, December 1st through December 24th. Here is a list of things that you need for all 24 experiments and specifically for day 1. Enjoy! :)
A story of 24 kitchen oceanography experiments — and lots of ocean physics!
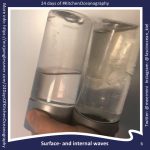
Usually, we only come into contact with the ocean’s surface or a few meters below it. But the ocean is on average 4km deep and consists of many different layers. When it is cold enough, ice floats on top. In warmer regions, the warmest water is closest to the surface. Underneath, there are many different layers: the colder and saltier the water, the further down the layer is located. Without any external influences, the layers of water rest stably on top of each other and only very slowly mix due to the movement of individual molecules.
Click on the picture to go to the experiment (Link will go live on December 1st)
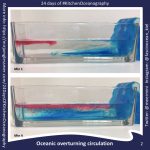
But above the water surface there is air, the atmosphere. The temperature of water at the sea surface, as well as its salinity, is constantly changing because of exchanges with the atmosphere. The atmosphere can cool water down or heat it up. In some regions, for example in the Greenland Sea, water becomes so cold – and thus heavy – that it sinks, away from the surface. To replace it, water from other regions is pulled in.
Click on the picture to go to the experiment (Link will go live on December 2nd)
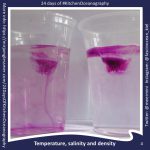
Water masses of different temperatures, and thus different densities, can partly explain the global oceanic circulation.
Click on the picture to go to the experiment (Link will go live on December 3rd)
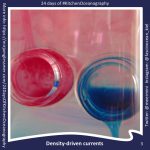
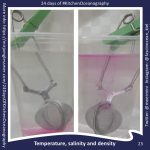
The density of seawater, and thus the movement of currents, is not only influenced by its temperature, but also by its salinity. Rain brings new freshwater into the ocean, which reduces salinity in areas where it rained. When seawater evaporates, it leaves behind the salt. Salt is also left behind when seawater freezes to ice. Both processes therefore locally increase salinity. Sometimes the influence of temperature dominates density, other times salinity does. Therefore, it is not immediately obvious which water mass is denser or less dense, and therefore what kind of currents will form.
Click on the picture to go to the experiment (Link will go live on December 4th)
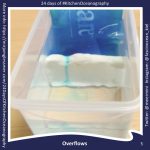
In addition, currents are influenced by the shape of coasts and the seabed. Sometimes, for example, ocean basins are separated by oceanic mountain ranges, called ridges. If a reservoir with dense water is formed on one side of such a ridge, it might eventually fill up the whole basin to the level of the lowest part of the ridge. If then any denser water is added, it spills over the ridge and creates an overflow of dense water.
Click on the picture to go to the experiment (Link will go live on December 5th)
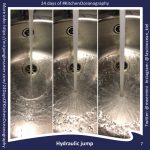
Overflows can happen either continuously as more dense water is formed, or in bursts. At the interface between the dense water that fills the reservoir to threshold level and the less dense water above it, internal waves can form. Waves propagate much slower on this interface than waves on the sea surface do, but otherwise they behave very similarly. When wave crests reach the threshold, dense water is flushed over. Wave troughs lower the level of dense water at the threshold so that little or none of the dense water spills over the ridge.
Click on the picture to go to the experiment (Link will go live on December 6th)
The overflow itself is “hydraulically controlled”. This means that it only depends on the upstream conditions because the current in the overflow itself is so fast that information about changes in the downstream conditions can’t travel upstream fast enough to have an effect there. Any disturbances are simply flushed away, similarly to a person that is always being brought back down when trying to walk up a downwards running escalator.
Click on the picture to go to the experiment (Link will go live on December 7th)
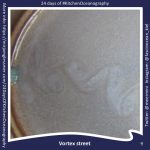
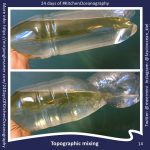
Another way in which the shape of a basin can have an effect on flows is through obstacles within a flow. Where exactly and how fast a current is flowing, for example when it flows around obstacles, can be described by streamlines.

Click on the picture to go to the experiment (Link will go live on December 8th)
Streamlines work best for flows that do not change over time, but they can also show the average conditions for flows that change over time. This is often the case, for example when there are eddies that detach and migrate.
Click on the picture to go to the experiment (Link will go live on December 9th)
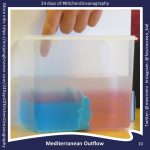
Eddies occur in the ocean for example where the very warm and salty Mediterranean water flows into the Atlantic at mid-depth. There it forms a layer according to its density, between colder and less salty water masses above and below.
Click on the picture to go to the experiment (Link will go live on December 10th)
These eddies, rotating lenses of water, are called “meddies” (from Mediterranean and eddies) and can transport water (of certain temperature and salinity) over long distances. Eddies can also transport other properties, for example dissolved substances like gases or nutrients, but also plankton or plastic. Due to the fact that eddies rotate around their own axis, a shear flow is created by friction with surrounding water masses, which slowly mixes the inner and the outer bodies of water.

Click on the picture to go to the experiment (Link will go live on December 11th)
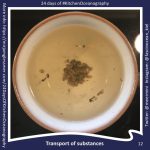
Some substances are transported by ocean currents but have a different density than the water. Therefore, they either float on top (like plastic garbage) or stay near the bottom (like sediment). They accumulate in areas when water rises or sinks, when they can’t keep up because of their different density.
Click on the picture to go to the experiment (Link will go live on December 12th)
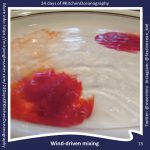
But for dissolved substances, there are many processes that cause mixing. In addition to the “stirring” caused by eddies, for example wind waves on the surface also contribute to mixing.
Click on the picture to go to the experiment (Link will go live on December 13th)
In the ocean’s interior, mixing between two water masses often occurs when internal tidal waves run at the interface between water masses and hit submarine ridges and break.
Click on the picture to go to the experiment (Link will go live on December 14th)
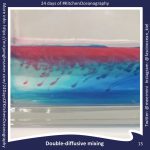
Mixing can also happen due to other processes, for example double-diffusive mixing. In the case of double diffusive mixing, two substances mix, because the molecular diffusion of different components happens at different rates. Temperature equilibrates about 100 times faster than salinity. This can lead to unstable density stratifications and therefore vertical movements, which lead to mixing.
Click on the picture to go to the experiment (Link will go live on December 15th)
Double-diffusive mixing has for example been observed at the lower boundary of the Mediterranean outflow, where warm and salty water is layered above colder and fresher. There, so-called “salt fingers” form, which mix water masses much faster than molecular diffusion could.

Click on the picture to go to the experiment (Link will go live on December 16th)
A second type of double-diffusive mixing is observed at the upper boundary of the Mediterranean outflow, where colder and less salty water is found above warm and very salty water. Here the process is called “diffusive layering” and convection forms homogeneous layers.
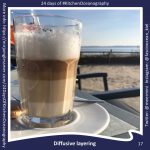
Click on the picture to go to the experiment (Link will go live on December 17th)
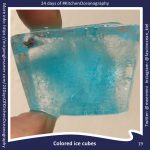
This type of stratification, with colder and fresher water over warmer and saltier water also occurs in the Arctic. There, the stratification is formed by both, precipitation and when sea ice melts during summer. Sea ice, even though originally formed from salty seawater, consists almost exclusively of fresh water.
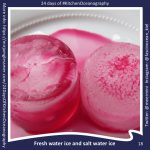
Click on the picture to go to the experiment (Link will go live on December 18th)
In the freezing process, the salt is “rejected”. The freezing water molecules create a uniform crystal structure, and the remaining salt water is forced into pores and to the edge of the ice, where it is released into the surrounding water and sinks. Sometimes however, small reservoirs of concentrated salt water are trapped in the ice. Sea ice therefore has a sponge-like structure.
Click on the picture to go to the experiment (Link will go live on December 19th)
Ice does not only form from liquid water but also from water vapor. The phase transition from gaseous to solid state is called “resublimation” and occurs, for example, in the formation of hoarfrost or snowflakes.
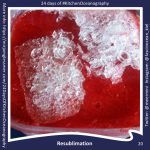
Click on the picture to go to the experiment (Link will go live on December 20th)
In regions where temperatures are always below freezing, snow deposits in layers over many years, and over centuries develop into a glacier. The layers of a glacier become a climate archive because with every snowfall also information, for example about gas concentrations in the atmosphere or to pollen of the flowering plants, are deposited.

Click on the picture to go to the experiment (Link will go live on December 21st)
When glaciers melt, as is currently happening due to climate change, water that hasn’t been part of the hydrological cycle of precipitation and evaporation for many years, is returned into this cycle and ends-up in the ocean. This means that “new” water is being added which causes the sea level to rise.
Click on the picture to go to the experiment (Link will go live on December 22nd)
Ice that already floats in the ocean also melts faster due to the increasingly warmer temperatures of the atmosphere. And not only that, additionally warmer currents gnaw on the ice from below and contribute to the increased melting.
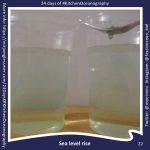
Click on the picture to go to the experiment (Link will go live on December 23rd)
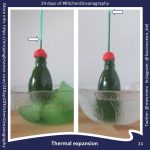
Melting of sea ice does not contribute to sea level rise by adding additional water as does melting of glaciers. But even warming of already existing water alone contributes to sea-level rise, as warming of water causes an expansion.
Click on the picture to go to the experiment (Link will go live on December 24th)
Fancy even more #KitchenOceanography? Follow me on Twitter (@meermini) and Instagram (@fascinocean_kiel) or subscribe to my blog (https://mirjamglessmer.com/), then you will be informed about all new experiments when they come!
P.S .: Want even more #KitchenOceanography than that? You can book me for the development or execution of experiments! Contact me via any of the three channels above, I am looking forward to it!