Using the Monash Simple Climate Model as first exposure to “real” climate models
When talking to the “general public” (which sometimes just means friends or relatives) about working in climate sciences, it is sometimes really difficult to explain what it is we do every day. I have described a very simple way of explaining how climate models work before. But while this might help provide a general idea of what a model does, it does not show us what climate models actually do. But there is a great tool out there that does exactly that!
The Monash simple climate model is a real climate model. When I was still in Kiel, almost 10 years ago, my sailing buddy Janine was working on implementing the first version of that model! And now the DKRZ (the German Climate Computing Center) hosts an web-based interface that lets anyone access the model.
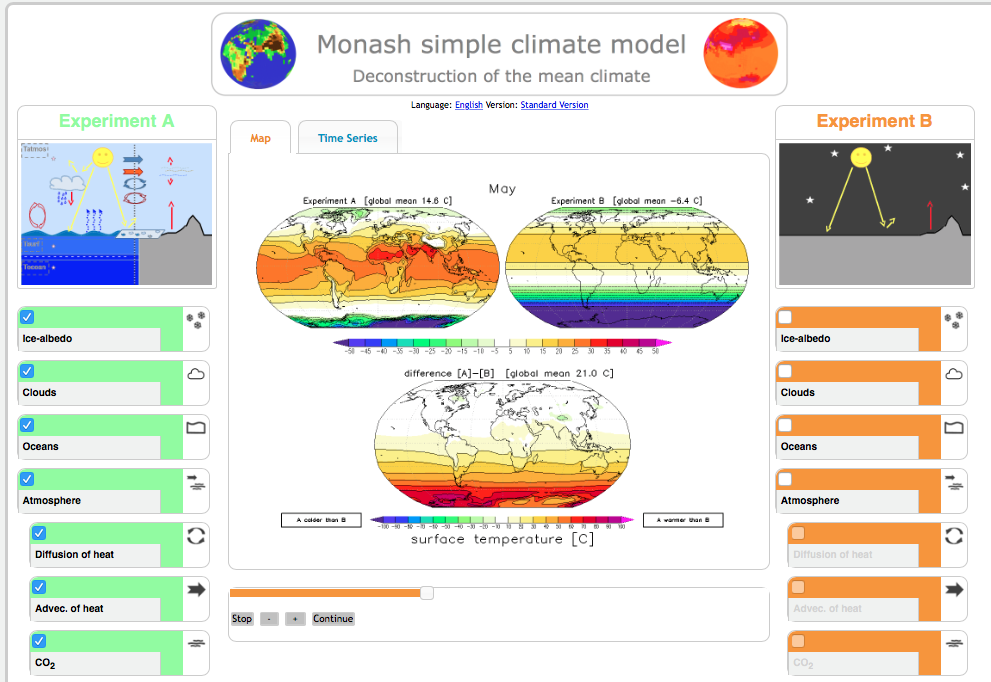
You can build up the climate model step by step, adding representations of processes like ice albedo, clouds, or many other and then compare model runs including those processes with those runs without. You are even shown the difference between those two runs to see how properties like surface temperatures are affected by the process under investigation! And really awesome feature? The visualization of which processes are switched on and off. See below: On the left, in experiment A, all processes are switched on (and therefore shown in the picture on the top left). In Experiment B, on the right, almost all processes have been switched off, only incoming solar radiation and outgoing radiation are active. Looking at the temperatures below, this shows how Experiment B is only influenced by the sun and temperatures are the same along lines of constant latitude. In Experiment A, though, the temperatures are modified by many more processes, and therefore the distribution is a lot more messy.
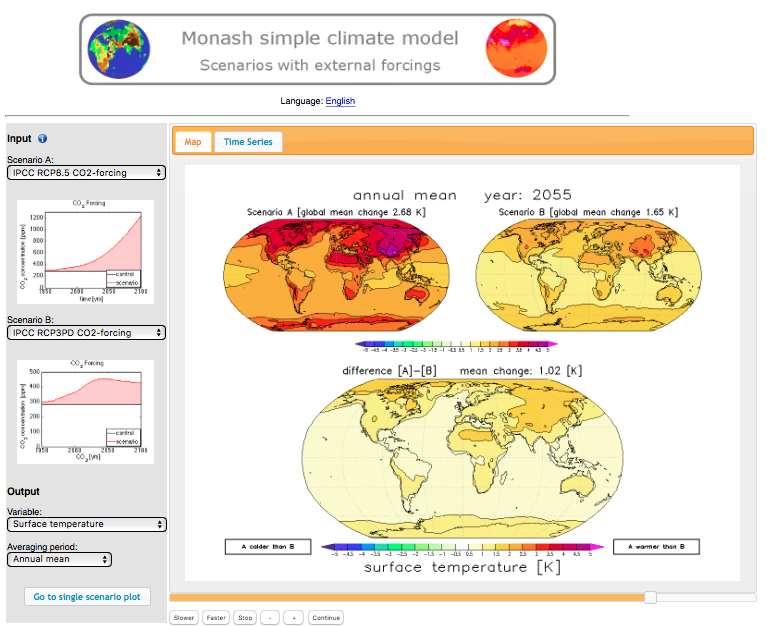
You can also look at different climate change scenarios, and you always get to see the CO2 forcing of the respective scenario. You can also compare scenarios with each other (see below). Doing this, you can vary parameters, too, to investigate their impact. You can always look at different model fields like surface and subsurface ocean temperatures, atmospheric temperatures, atmospheric water vapor or snow/ice cover.
There are very nice video tutorials for a quick start, and puzzles where you can test how well you understand the model.
I absolutely love this tool, and I wish I was teaching anything related to ocean and climate so I could use it in my teaching. This opens up so many possibilities for inquiry-based learning. Or basically just interest-driven exploration, which would be so fun to initiate and then support! You should definitely check it out! http://mscm.dkrz.de/


My workshop at MeerKlima.de | Mirjam S. Glessmer says:
[…] workshop by a colleague, who used the Monash Simple Climate Model (which I have talked about here) and I have got to say: That is such an awesome tool for teaching about models and/or the climate […]
My new school lab on energy in the climate system has been launched! :-) – Mirjam S. Glessmer says:
[…] the Monash Simple Climate Model! I’ve written before about how great it is in teaching (see here), and I am still a big […]
Presenting our new school lab on “energy in the climate system” at a conference – Mirjam S. Glessmer says:
[…] phase, and the expert puzzle which we use together with the MSCM model (more about that here) to bring the experts to a common understanding of the […]
#SciCommChall: 10 pictures to illustrate my work – Mirjam S. Glessmer says:
[…] then come together into teams to combine their expertise and use it to explain things going on in a simple climate model. I really like how hands-on experiments complemented with the climate model give students an idea […]
10 pictures illustrating Mirjam’s professional identity for #SciCommChall. How would you illustrate yours? – #SciCommChall says:
[…] then come together into teams to combine their expertise and use it to explain things going on in a simple climate model. I really like how hands-on experiments complemented with the climate model give students an idea […]