Tag Archives: chemical oceanography

Measuring the concentration of dissolved oxygen in sea water – Part 3 of 3 – finding the titration volume by looking at the change in color

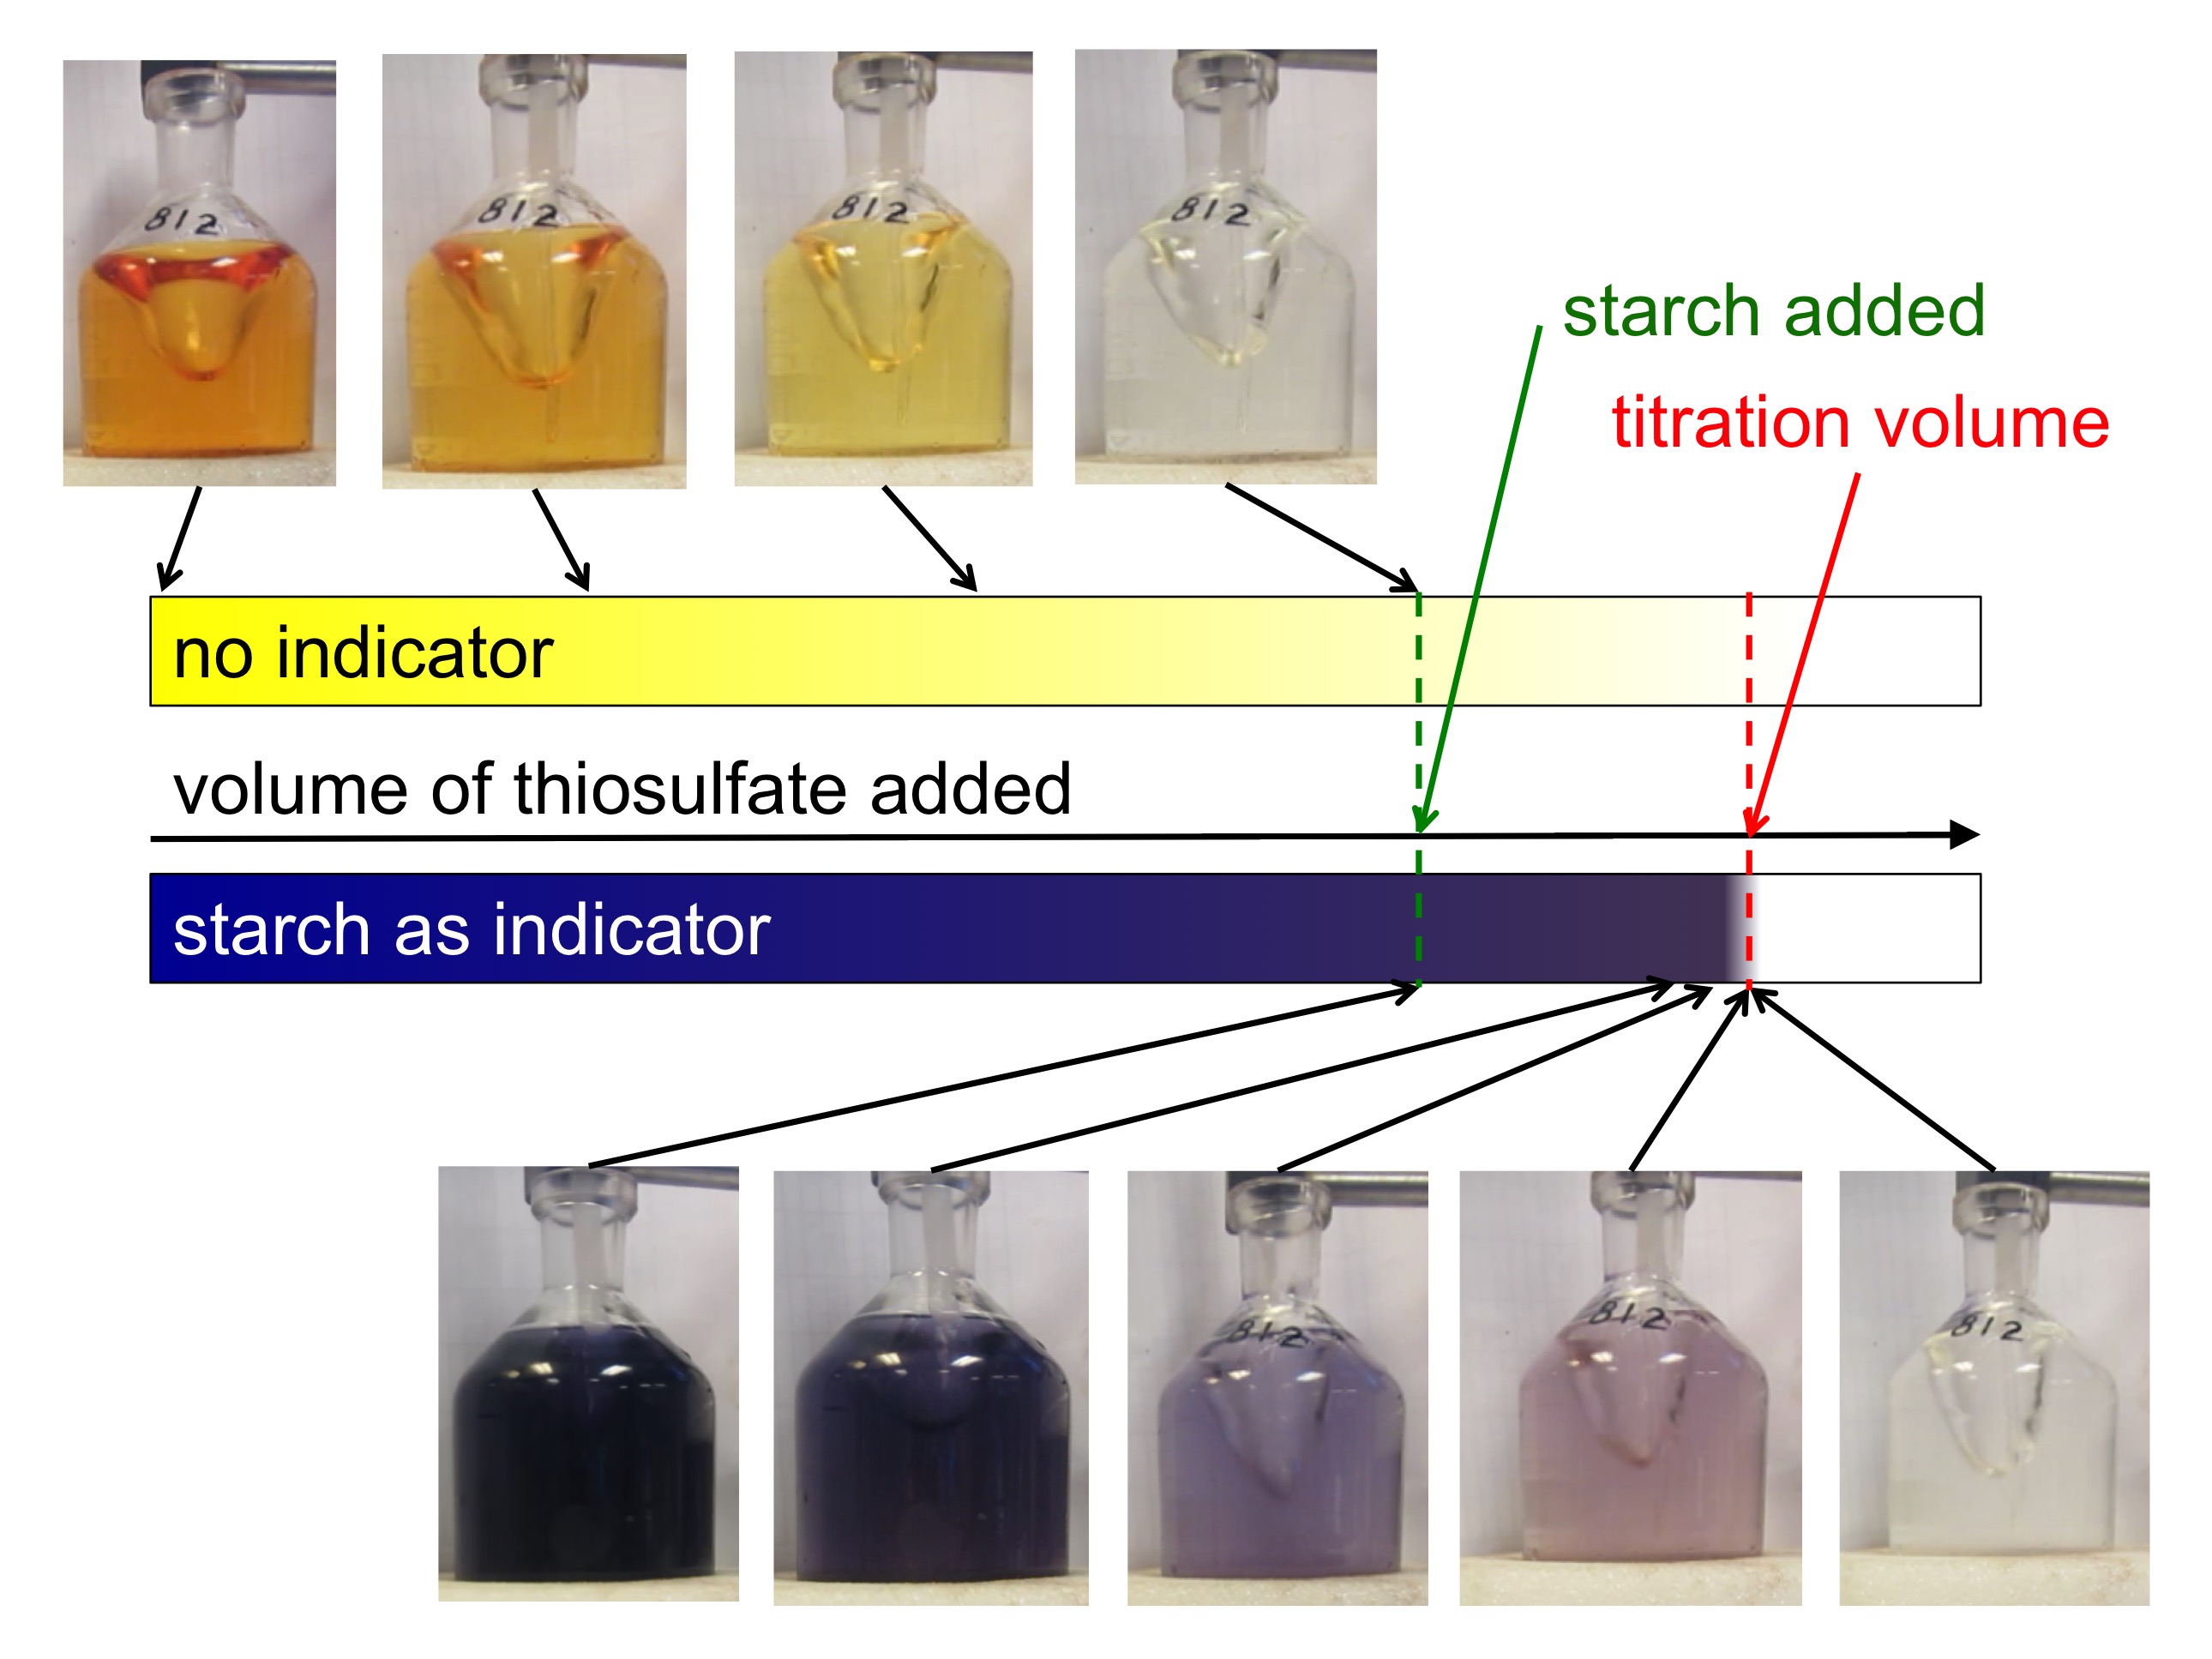
So now we have prepared our sea water sample and are ready to start titrating to figure out the concentration of dissolved oxygen. The sample itself changes color with added thiosulfate, it goes from yellow to lighter yellow to clear over a wide range of added thiosulfate. But determining the titration volume just based on this is a pain.

When measuring dissolved oxygen with automatic titration, the instrumentation that I used previously used a UV lamp and a detector: After each tiny volume of the titrant was added, the amount of UV light that made it through the sample as it changed it color from its original apple juicy-color to clear was measured and noted. Two lines were fitted to those data points: One while the color of the sample was still changing, the other when it wasn’t any more. The titration volume is found at the intersection of those lines.

slide1

Winkler titration: What an automatic titration system measures


When measuring oxygen with manual titration, like I did on this cruise, we can’t take all those individual data points and then fit lines, we can just take one single reading the moment we think the titration volume has been reached (well, we can note down volumes when we think we are close, and then just use the one we think was closest to something actually happening. But we don’t have a good account of how close we were at each of those volumes, and we can’t go back in time to compare values, so it still comes down to either getting it right or not). Having a good indicator that clearly shows when the titration volume (I.e. the point at which the amount of thiosulfate solution added to the sample is proportional to the concentration of dissolved oxygen in the original sample) is reached is key.

Luckily, Kristin prepared an awesome starch mixture which I got to use that makes it a lot easier to determine the point when titration is done. You add it when the yellow of the sample has become so light that it gets difficult to see whether it is still yellow or clear already, and the sample turns a deep, dark purple. As you come closer to the titration point, color changes little until you are very close, when it changes very rapidly (that’s why you only put it in once you are fairly close, otherwise the looooong time with no changes would likely lead to you becoming too impatient, adding too large volumes at a time, and over-titrating [at least if you are like me at all]). Adding starch late and then having it change very sensitively to added thiosulfate makes it very easy to determine the exact volume of thiosulfate needed.

slide2

Winkler titration: Sketch of the color changes of just the sample, or a sample with an added starch solution, during titration. Note how it is a lot easier to find the titration volume when starch is added at the right moment!

And here are a couple of impressions of what it looks like for real:


Winkler titration: Sketch + photos of the color changes of just the sample, or a sample with an added starch solution, during titration. Note how it is a lot easier to find the titration volume when starch is added at the right moment!

Winkler titration: Sketch + photos of the color changes of just the sample, or a sample with an added starch solution, during titration. Note how it is a lot easier to find the titration volume when starch is added at the right moment!

When writing this post and showing it to people, I have been warned repeatedly to not make myself redundant by making it too easy for other people to just print this blog post and go take my spot on the next cruise to measure oxygen. So I just want to state: Clearly there is more to measuring oxygen than what was shown here! For example, you need to measure standards to calibrate your measurements, which I am too lazy to write about right now. And most importantly: If something goes wrong, you need to be able to figure out how to fix things. And that’s not always a piece of cake, I can tell you… So please don’t use this as a manual. But I’m happy to talk about my experiences if anyone is interested!

And Kjetil and Emil, I really want to go on that winter cruise! :-)

Measuring the concentration of dissolved oxygen in sea water – Part 2 of 3 – the measuring part

So how do we actually measure dissolved oxygen concentrations from the samples we took in the last post?

We are using a method called “titration” to determine the unknown concentration of dissolved oxygen in our sea water sample. And this is how titration works in general: During titration, we add known volumes of a chemical, called “titrant”, to the sample until all of our unknown amount of the substance we want to measure has reacted with the second chemical. The volume of the titrant that we needed to add until all of the substance-to-be-measured is used up is called the “titration volume” and it is proportional to the volume of the substance-to-be-measured we had in the sample and that we want to figure out. Since the chemical reactions of the substances are well known, the factor that needs to be used to convert one substance into the other is known, too.

Unfortunately, when attempting to measure oxygen, we can’t add the titrant directly to the water sample, but a couple of other steps have to happen before. Remember the last post? We ended by adding reagents to the sample:

img_7987

To be precise, we add manganese sulfate first and then a mixture of sodium iodide and sodium hydroxide. This is shaken really well to mix everything. A white manganese hydroxide precipitate forms but is quickly oxidized by the oxygen in the sample. When this happens, the sample turns the color of brownish cloudy apple juice. This is where it is important that we don’t have air bubbles in the sample – the oxygen contained in those would also take part in the reaction which would later look like there had been a higher concentration of dissolved oxygen in the sample.

After a little while, a yellowish-brownish precipitate falls out. This is what we later want to measure, as the dissolved oxygen is bound in there and can’t take part in any further reactions for the time being.

A sample then looks like this:

img_6740

Or, for a full crate of samples:

img_6831

Next, using a syringe, we need to carefully, take about 20ml of water off of the top of the sample flask (because we will measure inside the sample flask and need to make room for the magnet stirrer and chemicals to be added later). This works surprisingly well without disturbing the precipitate at the bottom of the bottle!

img_6741

Next, we add acid (sulfuric acid in our case) to the sample to dissolve the precipitate back into solution.

img_6742

Where in contact with the acid, the apple juice becomes clear.

img_6743

It will become clear everywhere once the magnet stirrer starts mixing the acid and the rest of the sample.

And now we are ready to start titrating!

In titration, we add known amounts of the titrant, thiosulfate solution in our case, to our sample until we reach the “titration volume”, where all oxygen has reacted. The task is figuring out the titration volume. This can be done for example by adding an indicator that changes color when the sample changes from acidic to basic. Then we need to note down the volume of the titrant, the titration volume, at the exact point that happens. The titration volume of thiosulfate solution is then proportional to the concentration of dissolved oxygen in the original sample (again, provided there were no air bubbles trapped in the sample).

We’ll talk about what this looks like in practice in the next blog post :-)