Depending on how strong a current we introduce in the 13-m-diameter rotating tank to simulate the strength of the coastal current in Elin et al.’s 2016 article (link on our blog, link to the article), it takes different pathway along and across our topography.
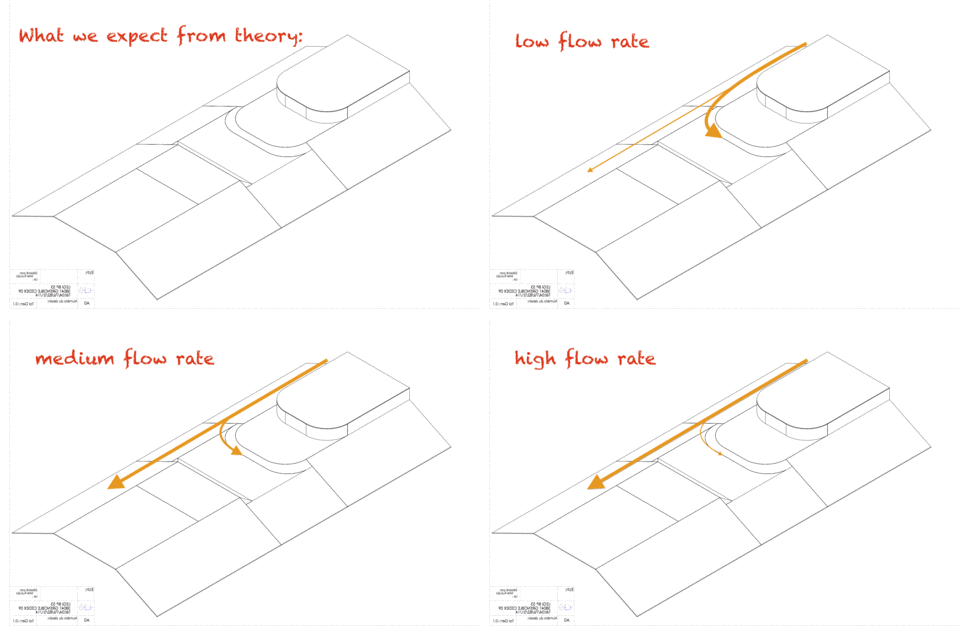
According to theory, we expected to see something like what I sketched below: The stronger the current, the more water should continue on straight ahead, ignoring the canyon that opens up perpendicular to the current’s path at some point. The weaker the current, the more should take a left into the canyon.
We have now done a couple of experiments, and here you get a sneak preview of our observations!
Small disclaimer beforehand: What you see below are pictures taken with my mobile phone, and the sketched pathways are what I have observed by eye. This is NOT how we actually produce our real data in our experiments: We are using cameras that are mounted in very precisely known positions, that have been calibrated (as described here) and that produce many pictures per second, that are painstakingly analysed with complex mathematics and lots of deep thought to actually understand the flow field. People (hi, Lucie!) are going to do their PhDs on these experiments, and I am really interpreting on the fly while we are running experiments. Also we see snapshots of particle distribution, and we are injecting new particles in the same tank for every experiment and haven’t mixed them up in between, so parts of what you see might also be remnants of previous experiments. So please don’t over-interpret! :-)
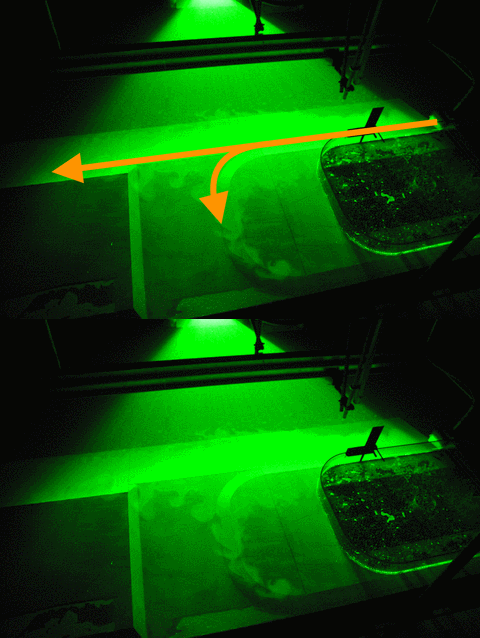
So here we go: For a flow rate of 10 liter per minute (which is the lowest flow rate we are planning on doing) we find that a lot of the water is going straight ahead, while another part of the current is following the shelf break into the canyon.

First observations – low flow rate (10l/min)
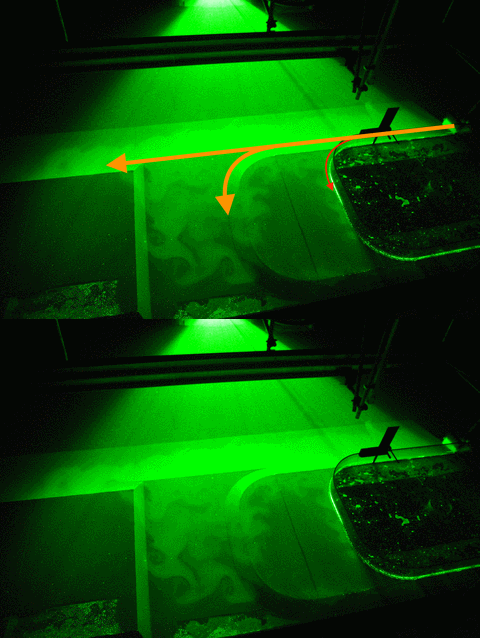
For 20 liter per minute, our second lowest flow rate, we find that parts of the current is going straight ahead, parts of it is turning into the canyon, and a small part is following along the coastline (Which we didn’t expect to happen). However it is very difficult to observe what happens when the flow is in a steady state, especially when velocities are low, since what jumps at you is the particle distribution that is not directly related to the strength of the current which we are ultimately interested in… So this might well be an effect of just having switched on the source and the system still trying to find its steady state.
The more experiments we run in a day after only stirring the particles up in the morning, the more difficult it gets to observe “by eye” what is actually happening with the flow. But that’s what will be analysed in the months and years to come, so maybe it’s good that I can’t give away too many exciting results here just yet? ;-)

