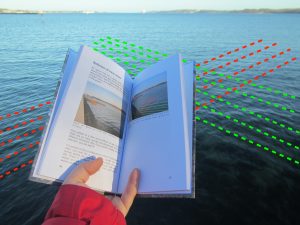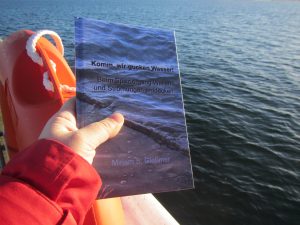
A #scicommbookforkids for #scicommchall

I hope by now you have heard about my pet project of the moment: #scicommchall! For #scicommchall, I give myself (and quite a few other people by now) monthly challenges related to trying out new science communication formats. And this month, we are doing science communication books for kids! (For more instructions, see #scicommchall’s post. And everybody is welcome to join!).

My book deals with learning to observe where the wind is coming from (English version at the end of this post, too).

I think it turned out quite nicely!

I did struggle a little with the very short format — only six pages inside the book, plus a cover — but quite liked the challenge of having to come to the point.

The flag on the cover, in case you were wondering, is that of my hometown Hamburg.

I hope this book is actually useful and fun for kids (I did include some kids’ humor, or at least I tried ;-))

And I know what I would include if I wasn’t too lazy to re-draw the images: A question about on which side of some kind of structure one would sit down if one wanted shelter from the wind. Bummer I forgot to include that!

Anyway, here is the download (German & English). Please let me know what you think, I’d love to get some feedback!

Click to download

Interview on #scicommchall! (in german)

I recently gave an interview on my current pet project, #scicommchall. The interview was done by Anne Weißschädel, and published on THE German website on science communication research and practice, wissenschaftskommunikation.de. Quite an honor!

I’m reprinting it here with permission:

Frau Gleßmer, für die #SciCommChall stellen Sie jeden Monat eine neue Herausforderung an Forschende, die ihre Wissenschaft kommunizieren möchten. Was ist Ihr Ziel für das Projekt?

Heutzutage müssen beinahe alle Wissenschaftlerinnen und Wissenschaftler in irgendeiner Form Wissenschaftskommunikation machen. Viele müssen daran aber erst herangeführt werden und es ist ihnen gar nicht bewusst, dass sie nicht von vorneherein auf ein bestimmtes Format oder eine bestimmte Zielgruppe festgelegt sind. Die #SciCommChall gibt einen niedrigschwelligen und spielerischen Impuls, jeden Monat ein neues Format auszuprobieren: Mein Forschungsthema in einem Bild oder meine Forschung in den 1.000 meist genutzten Wörtern. So kann man einerseits ein Format ausprobieren, auf das man vielleicht selbst nicht gekommen wäre und andererseits sehen, wie andere das Format interpretieren. Ich möchte damit spielerisch zum Austausch und Austesten anregen.

Wie sind Sie auf die Idee gekommen?

Ich habe als Ozeanografin schon früher Wissenschaftskommunikation gemacht. Dabei habe ich gemerkt, dass es Spaß macht, ab und zu mal ein neues Format auszuprobieren. Mit einem vollen Terminkalender macht man das aber nicht einfach so, ohne Anlass oder Deadline. Also habe ich mir selbst am Anfang jedes Monats ein Ziel gesetzt – zum Beispiel ein Gedicht über meine Forschung zu schreiben. Nach und nach wurden dann Freundinnen und Freunde und auch das Kollegium darauf aufmerksam und wollten mitmachen. Außerdem habe ich die Promovierenden am Kiel Science Outreach Campus (KiSOC) motiviert, sich zu beteiligen. So wächst das Netzwerk langsam. Wir freuen uns über jede und jeden, die mitmachen möchte: Einfach unseren Blog besuchen, eine E-Mail schicken oder @scicommchall auf Twitter oder Facebook folgen!

Wer macht mit und wie viele?

Das ist schwierig zu sagen, das Format ist ja noch neu und im Wachstum. Ich kriege nur mit, wenn Leute tatsächlich Produkte einreichen oder Feedback geben. Ich nehme an, dass es zusätzlich einige gibt, die sich einfach inspirieren lassen und dann vielleicht doch nichts einreichen. Unter den Einreichenden sind auch jeden Monat andere Leute. Zuerst habe ich mich stark darauf fokussiert, unsere Promovierenden zu motivieren und das Projekt dann nach und nach geöffnet.

Warum finden Sie es wichtig, dass die Promovierenden ihre Forschung kommunizieren?

Wissenschaftskommunikation ist ein Thema, das uns im KiSOC speziell am Herzen liegt. Nicht nur, weil es unser eigener Forschungsgegenstand ist, sondern auch, weil wir die Praxis verbessern und gerne mit gutem Beispiel vorangehen möchten. Pro Wissenschaftskommunikation gelten natürlich die typischen Argumente, etwa, dass wir mit öffentlichen Mitteln finanziert werden und dass gesellschaftliche Unterstützung und Teilhabe an der Forschung wünschenswert sind. Außerdem glaube ich, dass es auch der Forschung zu Gute kommt, wenn die Leute schon während der Promotion Wissenschaftskommunikation machen. Da bekommt man einen ganz anderen Blick auf das Feld. Abgesehen davon, dass es natürlich auch motiviert, wenn man Feedback von außen für seine Arbeit bekommt, und dass es Spaß bringt.

Wie ist die Resonanz aus der Community der Wissenschaftskommunikation?

Bisher gibt es nur vereinzeltes Feedback. Eine tolle Rückmeldung kam aber zum Beispiel von Sam Illingworth. Er arbeitet in Großbritannien und hat viel im Bereich Wissenschaftsgedichte gemacht. Als er dann bei uns angefragt hat, ob er eine Monatsaufgabe stellen darf, war das natürlich ein tolles Feedback. Die Oktoberchallenge kommt dann von ihm.

Haben Sie am KiSOC noch weitere Motivationsprojekte zur Wissenschaftskommunikation neben der #SciCommChall?

Ja, der Großteil unserer Promovierenden hat Instagram-Accounts, in denen es darum geht, den persönlichen Alltag in der Forschung darzustellen, und deren Highlights sammeln wir auf dem Account @kisoc_kiel. Dabei stellen wir beispielsweise vor, was wir inhaltlich machen und welche Methoden wir dafür anwenden. Das ist für uns intern ein wichtiges Projekt. Zwar haben wir noch nicht besonders viele Follower, aber wir haben es zum Beispiel geschafft, dass sich auch andere Kolleginnen und Kollegen am IPN, darunter auch eine Professorin, eigene Instagram-Accounts zugelegt haben und jetzt aktiv online Wissenschaftskommunikation machen. Der Impact ist also auf institutioneller Ebene da und wir stehen auch mit anderen Leibniz-Zentren in Kontakt, die uns einladen, um sie zu beraten. Wir erreichen so also unser eigenes Netzwerk und das ist für uns erfolgreich.

Wave watching at the Kiel Holtenau locks

So many people are surprised when I speak of wave watching as of a “real activity”. But to me it is! So I am going to talk you through a couple of minutes I spent looking out on the water where the Kiel Canal meets the Kiel fjord, right outside the locks at Kiel Holtenau.

A light breeze across the fjord

The “light breeze” part is fairly easy to observe: There are ripples on the water, but no actual waves. “Across the fjord” is also fairly obvious if you look at either side of the wave breaker: On the fjord side, there are ripples, on the shore side, there are none (or hardly any), indicating that the wave breaker is sheltering the shore-side from the wind (and dampening out the waves that come across the fjord).

And then: A ship sails into view!

We watch the ship sail past, dreaming of foreign countries and exciting adventures.

A ship leaving a wake

Behind the ship, the water looks very different from what it looks like everywhere else. The wake is turbulent and waves radiate outwards like a V, with the ship always at its tip.

Then, the ship is gone. But we can still see where it went.

There are no waves in the tubulent wake

The ship’s path is completely smooth. No waves have invaded the turbulent waters of the wave just yet, claimed them back. However, the waves the ship created in that V are about to reach the wave breaker.

Also the wind has picked up a little, as evident from the less smooth water surface shore-ward of the wave breakers.

Diffraction at a slit

Right after the waves from the V reach the wave breaker, they reach the opening at the end between the pylons. And what happens now is that the waves get diffracted at a “slit”: they propagate outwards as semi circles, even though the wave fronts were straight when they reached the slit.

How awesome is that? And all of this happening in a matter of minutes!

The weather changes

I said earlier that there was hardly any wind. Later that afternoon, it still wasn’t very windy, but the wind direction had changed: now the smooth and sheltered part has moved to the other side of the wave breakers. There are a lot more waves on the shore side of the wave breaker now, the ones with crests parallel to the wave breaker due to it moving, and the ones with crests perpendicular to it generated by wind. And you see gusts of wind on the sea side of the wave breakers in the different surface roughness.

So if you were wondering, too: That’s the kind of stuff I look at when I am wave watching. And I still find it super fascinating and relaxing at the same time! :-)

“Liquid art” by Wlodek Brühl, and how it could be used in physics teaching

Do you sometimes feel that wherever you go, you just happen to observe something that makes you think about physics? I definitely do, and that’s what happened to me again this Sunday.

#diwokiel — one week full of exciting events related to digitalization of the world

It’s currently #diwokiel, a week-long event on all kinds of aspects of digitalization. I went to a talk on his “liquid art” by Wlodek Brühl. Mr. Brühl forms sculptures out of water drops and documents those sculptures through photography. But “forming sculptures” really doesn’t begin to convey  the process through which this happens and the level of expertise and precission that is needed. Below, you see an example of one of his sculptures on the projection (for more of his absolutely breath-taking art, check out the portfolio on his website!), and the apparatus with which this kind of art is generated on the left.

As you might been guessing from the kind of setup already, there is an enormous amount of physics that goes into creating this kind of sculptures!

Using art as a hook to talk about physics

And we are back to a favorite topic of mine: How to use art in science communication!

One challenge that science communiction faces is how to reach audiences that aren’t already interested in what you want to talk about. Yes, school kids are often exposed to all kinds of topics in science communication events whether they are interested in them or not, just because their teacher decided they had to go there. But what about adults? There are a lot of people that would never knowingly attend an event that will deal with physics. Attracting them with something they are interested in — art, in this case — might be a great way to spark their interest in physics topics!

What’s the physics behind “liquid art”?

But where exactly is the physics that can be talked about? There are two main areas that jump at me: The physics of the water that is used to form the sculptures, and then the physics of capturing pictures and everything related to that.

Physics of water

As you might have guessed, my main interest lies in the physics of the water. How do you manipulate water to design exactly the kind of sculpture you want? This is not only about the exact size of drops, falling from the correct height, hitting a reservoir in the correct spot, at exactly the time you think it will, potentially additional drops with precisely calculated time lags…

In the following, I am going to give you three examples of the kind of physics I would talk about if I were to use “liquid art” in a science communication context. For all of these, there are so many nice hands-on experiments that could be offered to let people experience the effect of various parameters to show how and why it is important to consider them when creating drop sculptures. So exciting! :-)

Viscosity, or how to control the behaviour of drops

Firstly, viscosity. Having a handle on viscosity doesn’t only determine the size of the drops, but also the kind of behaviour that is displayed when the drop hits the reservoir — how deep will a drop sink, what kind of bubble will be formed, how high will the stem rise from the reservoir when surface tension drives it back up, all the good stuff.

Viscosity can be manipulated several ways: By manipulating the viscosity of water by adding starch or other substances, by using different fluids than water (which comes with additional problems, e.g. cleaning the apparatus afterwards), and by using different fluids and adding stuff to them. And then viscosity is also a function of temperature, so temperature of the whole lab (or studio) has to be controlled.

Hydrostatic pressure “plus”

The size of drops is also determined by another factor: By the hydrostatic pressure in the reservoir that feeds the drip (or valve) in combination with the opening time of said valve. There are very interesting ways to control the pressure in the reservoir that I could (and probably will ;-)) write several blog posts on!

And then it’s not only the hydrostatic pressure that is relevant: If several valves are used because water is coming from several reservoirs (for example because the water is dyed in different colors or because fluids of different viscosities are combined in one sculpture), adding pressure to a valve that is moved slightly out of the vertical lets you manipulate the parabolic trajectory the drop takes when falling, thus making it possible to drop on the spot exactly underneath a valve that just lets drops fall out vertically.

Waves, or symmetry of sculptures

And then, of course, you have to consider the vessel the water drops into. If that reservoir isn’t circular and the drop doesn’t hit it right in the middle, it is very difficult to create symmetric sculptures because the waves radiating from the point of impact (both on the surface and as pressure waves in the water) will, after being reflected by the rims of the reservoir, reach the mid point at different times, leading to an asymmetrical pressure field which will skew the whole sculpture.

Liquid art by Wlodek Brühl

Liquid art: Wlodek Brühl manipulating the apparatur he uses to create the amazing drop sculptures. Used with permission.

Physics of capturing images

And then, of course, there is all the physics of actually capturing the images. For example, Mr. Brühl mentions that the picture isn’t made by the camera, it’s made by the flash light. The way the pictures are taken that the camera’s exposure is actually fairly long, but the sharp definition is achieved because the flash only lights the sculpture for an extremely short time. And then there are things to consider like at what angle the flash lights the sculpture, how to achive the desired color effects, and many more. And of course writing the software that controlls all this!

More about this in a future post!

When not the fetch but a funnel shapes the wave field

As you know we are currently preparing for future wave riddles. So this afternoon I went out for a wave hunt again and found something beautiful for you!

The ship coming out of the Kiel-Holtenau locks into the Kiel Canal is making waves, but although those are pretty exciting, too, there are more things going on in the picture above…

Many processes can create waves

In addition to waves made by ships, seagulls, the locks opening and closing, and those waves being shaped by reflection, refraction, and all those other processes, most waves look actually pretty similar, and they are all formed by the same process.

Most waves are wind waves

In almost all situations it’s a safe guess that most of the waves you see are caused by the wind. Either locally, or by storms far away. Of course, the waves might look very different from day to day and location to location. But as a rule of thumb, the stronger the wind, and the longer it has been blowing, and the longer its way over water without any obstacles in its way, the higher the waves.

Usually the length of the fetch shapes the wave field

This uninterrupted stretch that the wind can blow over the water is called the “fetch”. And it explains why you don’t have really large waves on small ponds: if the fetch isn’t long enough, waves just don’t have enough time to build up from when they are generated at the upwind side of the pond until they have reached the downwind side.

Sometimes obstacles shape the wind field

Sometimes though, there are obstacles in the wind field that cause interesting wave phenomena. Below you see that the wind that has been coming across Kiel Canal is interrupted by those pylons. Upwind of the pylons the waves are fairly regular and pretty boring.

But remember your Bernoulli? If the area across a flow decreases, for continuity reasons the flow speed has to increase.

Since air is “flowing” in that sense, too, it’s accelerated where it goes in between and around those pylons since it has to squeeze through a smaller cross section than it had to its deposal further upwind.

The wind field is mirrored in the wave field — well, kind of

Do you see how the faster wind causes all these nice little ripples? Maybe “mirroring” the wind field isn’t quite the right way to express it, but you can definitely see where the wind speeds are different from the rest of the Kiel Canal just by looking at the waves! From there the waves then propagate as sectors of circles outwards and leave the areas of the high wind speed, but they quickly dissipate and vanish again.

Wave watching is awesome. Can you think of anything better to do on a Saturday afternoon? :-)

What makes and destroys waves

Today I have a couple of photos for you to prepare you for upcoming wave riddles. Since, in those riddles, I usually ask what might have caused the wave on that picture to look a certain way, let’s today look at a couple of relevant processes.

A lot of processes can make or destroy waves

In previous riddles, I have often chosen pictures where waves were made by ships or other objects, or shaped by topography. Today, I want to focus on wind-generated waves, and how the wave field changes without interactions with the bottom or other boundaries.

Well, unless you think of surface films as boundaries, that is. Which, I guess is a valid way to look at them. What do you think?

Surface films act as filter on short wave lengths

Below, you see wind waves running into some sort of surface film. I am not quite sure if “film” is the best way to describe the case you see below: It’s not like an oil film, it’s a lot of tiny objects floating so close to each other that they rub against each other when moved, and since the rubbing eats up more energy than the movement of a completely free surface, waves get dampened. And, as you see below, the dampening happens selectively depending on wave lengths: Short waves are dampened out as soon as they run into the area covered by the surface film, while longer wavelengths propagate into that area without being affected too much.

Dispersion also acts as filter on small wave lengths

But surface film aren’t the only thing that changes a wave field’s spectrum. It can change all by itself: Since the velocity of deep-water waves (meaning that the water depth is large compared to the wave length, which is the case in all the pictures in this post) depends on their wave length, and longer waves move faster than shorter ones, a gust of wind that ripples the surface in one place will not make a ripple pattern that propagates “as is” over the water, but the spectrum of different wave lengths will separate, with the longer, faster waves overtaking the shorter, slower waves.

That’s what you see above: The shorter, slower waves can’t keep up with the longer ones. And then the longer ones run into the area covered by the surface film, and again only the longest ones manage to propagate into that area while the rest is filtered out.

Wind causes ripples which then grow into waves

I’ve kind of assumed that everybody knows this, but here is a nice example of how wind causes waves in the picture below. Just out of the upper edge of the picture below, there is a pier that shelters the down-wind water from the wind, causing a flat and smooth surface close to it.

After the wind has had the opportunity to interact with the water surface for a little while, ripples form. They then grow, and yada yada yada, we are back in the situation shown in the picture above the one above this one.

Growth and destruction of waves

Would you have been able to explain the four different zones shown in the picture above? Would you recognize what’s going on if you happen to observe it “out in the wild”? Then you are well prepared for upcoming wave riddles! ;-)

Stuff you can (and should!) observe in your kitchen: circulation in the water when boiling eggs

Now that I have introduced the new tag “kitchen oceanography: food related” to my blog, it’s time to add a couple new posts to that category. And today I have a fun post for you!

But first, what does “kitchen oceanography” even mean?

Kitchen oceanography

/ˈkɪtʃɪn ˌəʊʃəˈnɒɡrəfi/
noun

The benefits of “kitchen oceanography”

It’s pretty apparent why “kitchen oceanography” is a great alternative to regular tank experiments: because you can do it with stuff you have at home rather than needing access to a lab with a tank, and then a lot of water, salt, dye, other resources to conduct the experiments. Doing kitchen oceanography, we use a minimal amount of resources.

But the second, even larger benefit to me is that you can do these kinds of experiments and observations basically everywhere and at any time. So you can fit in a quick session of kitchen oceanography while sitting in front of the fire place on a skiing trip with friends, or while doing the dishes with your godchild. And you can inspire others who might not have access to labs to still do cool oceanography experiments, at home or wherever they like!

Kids who have cooked with their parents are more likely to be interested in STEM

Apparently, the biggest predictor of future interest in STEM topics is whether people as kids often cooked with their parents! No literature source for this, but that’s what my educational research colleagues next door told me… So playing in the kitchen, whether on kitchen oceanography or with food, is a good thing!

It’s not like watching paint dry: Observing boiling eggs

Observing boiling eggs might not sound like a super exciting activity to engage in, but sometimes it is. Last year we did observe interesting foam pattern when boiling eggs (I still can’t explain where the foam is coming from! Can you?).

Foam pattern in a pot of boiling eggs

Foam pattern in a pot of boiling eggs. P.S.: The “black egg” sings different songs to let me know how hard-boiled my eggs are at any given moment. I love this because they are songs I learned from my godson and it always reminds me of him and his family :-)

Foam pattern show circulation within the pot

The pattern in the foam show the convection pattern of the boiling water around the eggs which act as obstacles. Water is raising from the bottom of the pot to its surface, bringing up foam. But the eggs are located so close below the water’s surface that the circulation above them (if there is one) is pretty much disconnected from the convection happening all around the eggs.

But then if you throw out the water…

Limescale deposits at the bottom of an empty pot after boiling eggs in it

Limescale deposits at the bottom of an empty pot after boiling eggs in it

Even the empty pot still shows you what the circulation pattern must have been like!

But then the next cool thing happens when you throw out the water: There are limescale crystals on the bottom of the pot! And, interestingly enough, they show the former locations of the eggs. And I think they are forming in exactly those spots because just as there is (hardly any) circulation above the eggs, the circulation below is also inhibited, water has longer residence time (because it isn’t whipped away by convection) and those crystals can form.

An alternative explanation might be that there is more limescale below the eggs because calcium carbonate gets dissolved from the egg shells and gets deposited as limescale right below the eggs because the concentration is highest closes to the eggs.

Which explanation do you think is more likely? Or do you have another one entirely?

5 years of blogging on “Adventures in Oceanography and Teaching” today!

5 years of “Adventures in Oceanography and Teaching”!

Today I am celebrating my blog’s 5th Birthday! 5 years of documenting my “Adventures in Oceanography and Teaching”. That feels both like an enormous amount of time, while at the same time it feels like only yesterday that I started one evening on the spur of the moment while sitting on the couch at my friend A&I’s former apartment, babysitting (Happy anniversary, A&I!).

When I started, I did not really have much of a plan of what I wanted to do with the blog, in the beginning I didn’t even plan on sharing it with anyone. I had, at that point, been teaching and doing science communication in oceanography for several years, and had done some pretty cool and innovative stuff (if I say so myself). Only trouble: I did not remember what I had done from one year to the next!

Kitchen oceanography

The main thing I wanted to archive were “kitchen oceanography” experiments: Experiments on processes related to the ocean that can be done using only household items. In honour of my blog’s 5th Birthday I have gone through some 700 posts introduced the new category, “kitchen oceanography“, to bring together all the blog posts that match that description. And it’s quite impressive how much cool science stuff you can do using only things you have in your home anyway!

I am a big fan of those experiments that can be done impromptu — for using them in teaching and outreach as planned features, as well as just whipping something out when the opportunity presents itself (for example on a skiing trip using our last drops of red wine as dye tracer). Once people get over the initial “what kind of kindergarden trick are we about to be presented with here?” reluctance, they ALWAYS get so engaged and want to start experimenting themselves. Those are the best moments!

Observations everywhere: from my sink to rivers to the sea

Another kind of teaching resource I wanted to archive on my blog were observations that I was making every day but didn’t have a good way to store: Oceanography in my kitchen sink, on puddles at the bus stop, in drains during a huge downpour (I was still living in Bergen back then), and when looking at the sea. There is so much physics everywhere that most people don’t notice, and as a proud, semi-new-ish smartphone owner, I had so many examples of what people could observe if they knew what to look for. I wanted to collect all those pictures together, have them searchable by keyword, and have them at hand whenever I wanted to show them to someone, whether in teaching or any other occasion.

Literature on teaching, learning, science communication

And then I had started reading literature on teaching and learning, and later on science communication. And while a good system to archive your literature is necessary in any case, I liked the idea of summarising relevant literature for the readers of my blog (and for my own reference, too). So that became the third main “genre” of blog posts on my blog.

Building an archive

So yes, the main idea when starting this blog was that I needed some way to archive pictures of experiments I had done together with short descriptions in a way that was easily searchable. For a while I had used Facebook (and I did like all the positive feedback I got when I posted pictures of experiments!) but in the end I wanted something I could customise to meet my needs and that would stay “mine” independent of what happened to other platforms.

Maintaining curiosity

But there were so many other benefits to this blog that I came to realise over time! The biggest one for me personally is that I now have a “reason” to get out my phone, snap a picture of the layers in my latte or other interesting features I come across in my daily life, and think about them more than just in passing. And it makes me so happy when I bake cupcakes with my sister just to use them for a blog post on ice coring or borrow a huge set for experiments on venturi tubes. I don’t think I would have gone to all that trouble if I didn’t have a blog to post the pictures on, and I would have missed out on so much fun! To me, doing those things is really rewarding and something I definitely want in my life.

Building a portfolio

But since the blog sometimes make me go to more trouble that I would without, and since I want it to be an archive of all this stuff, it has become a great portfolio. Going back over those 700-ish blogposts to tag all the “kitchen oceanography” ones, I noticed different phases related to different employers and places I lived at, but also in how much effort I put into blogging. And my blog has definitely become an asset: Based on what I put online here, I am fairly regularly contacted by people who ask for advice on teaching and especially experiments, or by people who found my blog for other purposes, for example for finding out how much salt there is in seawater in order to use it to beak bread! And I really value the interactions that have risen from people reading things on my blog and then getting in touch with me. I would never have been able to build such a diverse and fascinating network of people around me had it not been for my blog!

Professional development

And then this blog has had a huge influence on my professional development. Not only have I gotten over the fear of writing and publishing things online completely. I have also, by building this portfolio, created opportunities for myself that might not have been possible otherwise: I changed from a traditional postdoctoral career in oceanography research into providing advice to oceanographers and climate scientists on their teaching and science communication! And this is the career I have been dreaming of long before I was able to put it into words, and then long before realising that I had already put it into words, because it lets me combine the best of both exciting worlds: Oceanography and teaching!

Reading the water — a new mystery picture for you! Today: Kiel Holtenau edition

Do you sometimes like to play detective when looking at water and figure out who or what caused certain pattern on the surface? Then I’ve got a nice riddle for you today!

Where do all those lines parallel to the pontoon come from?

Look at the picture below. Do you see all those parallel lines this side of the pontoon? Any idea what might have caused them?

Hint: The pontoon is floating on the water, and sometimes this happens: Ships pass by.

And when ships come by, they make waves, and then it looks like this:

(full disclosure: As you might or might not see from the waves on the far side of the pontoon in the picture above is that the ship that caused those waves was going into the locks (so right to left) in contrast to the ship in the picture above this one, where the ship went out of the canal and into the Kiel fjord…)

But yes! Ships make waves, which then move the floating pontoon, and with its edge the pontoon generates those long straight wave fronts, one after the next, so they propagate out as parallel lines, following each other!

Sometimes also this happens:

Going the wrong way round without any issues! I like tugs, they are just really really cool and I want to drive one some day.

But even without tugs in sight, Kiel is a super nice place to live in…

Happy Sunday evening, everybody! :-)

Layered latte: A great real-life example of double-diffusive mixing!

Sometimes sitting in a café for a work meeting with #lieblingskollegin Julia can lead to unexpected discoveries of oceanographic processes — in my latte! It’s those little things that inspire blog posts…

“Kitchen oceanography” brings the ocean to your house or class room!

Oceanography is often taught in a highly theoretical way without much reference to students’ real life experience. Of course a sound theoretical basis is needed to understand the complexity of the climate system, but sometimes a little “kitchen oceanography” — doing experiments on oceanographic topics with household items — goes a long way to raise interest in the kind of processes that are not easily observed in the real world. I’ve previously written a lot about simple experiments you can perform just using plastic cups, water, ice cubes, and a little salt. But sometimes it’s even easier: Sometimes your oceanography is being served to you in a cafe!

Oceanic processes can be observed in your coffee!

Have you ever looked at your latte and been fascinated by what is going on in there? Many times you don’t just see a homogenous color, but sometimes you see convection cells and sometimes even layers, like in the picture below.

Layers in a latte.

Layers in a latte.

But do you have any ideas why sometimes your latte looks like this and other times it doesn’t?

When you prepare latte in the right way, many layers form

Layers forming in latte (and in the ocean or in engineering applications) are an active research field! In the article “laboratory layered latte” by Xue et al. (2017), the authors describe that the “injection velocity” of espresso into the warm milk has to be above a critical value in order for these pretty structures to form in a latte. They even provide a movie where you can watch the layers develop over a period of several minutes.

The homogeneous layers with sharp boundaries are caused by double-diffusive mixing

Double-diffusive mixing, which is causing the formation of these layers, is the coolest process in oceanography. In a nutshell, double diffusive mixing is caused by two properties influencing density having different rates of molecular diffusion. These different rates can change density in unexpected ways and an initially stable stratification (high density at the bottom, low density on top) can, over time, become statically unstable. And static instability leads to adjustment processes, where water parcels move in order to reach the position in the fluid where they are statically stable — the fluid mixes.

Layers in half a glass of latte.

Layers in half a glass of latte.

But there are more fascinating things going on with the latte. Would you expect this stratification to remain as clearly visible as it is in the picture above even though the glass is now half empty? I did not! And then check out what happens when you move the glass: Internal waves can travel on the boundaries between layers!

You can use this in class to teach about mixing!

Mixing in the ocean is mostly observed by properties changing over time or in space, and even though (dye) tracer release experiments exist, they are typically happening on scales that provide information on the large-scale effects of mixing and not so much on the mixing itself. And they are difficult to bring inside the classroom! But this is where kitchen oceanography and experiments on double-diffusive mixing come in. If you need inspiration on how to do that, I’ve recently published an article on this (unfortunately only in German), but there are plenty of resources on this blog, too. Or shoot me an email and we’ll talk!

P.S.: Even though the coffee company is displayed prominently in the pictures above, they did not pay for my coffee (or anything else). But if they’d be interested and make me a good offer, I’d definitely write up some fun stuff on learning oceanography with coffee for them ;-)