Blog post no 500 or: My book has just been published! #superproud
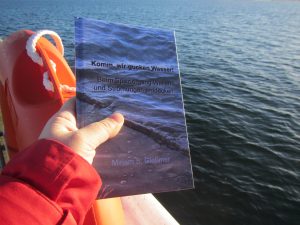
I wrote “Let’s go wave-watching! Discovering oceanography on every stroll” (available in both german and English!) for my god-daughter Pauline and her parents. Pauline wasn’t even six months old then, but I wanted her parents to learn to see everything I see when I look at water, to get as excited about it as I get, and to get Pauline addicted to wave-watching, too, as she grows up. We’ll see how that works out, but now you have the chance to be fascinated and have your eyes re-opened to all the things you theoretically learned about but forgot again :-)
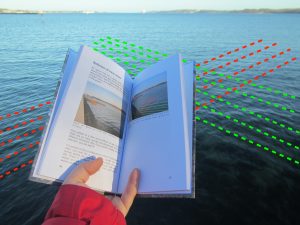
If you are interested, you can find more information on my book HERE. Weren’t you still looking for a christmas present for your niece, your nerdy friend, anyone who should spend more time looking at water?
And also how exciting is it that this announcement also marks the 500th post on this blog? My baby just had a baby ;-)
P.S.: Buy it here: amazon.de (english | deutsch) or amazon.com (english | deutsch). Unfortunately, amazon.com only sells the e-book version and not the print version, but get in touch if you’d like a print version and can’t buy from amazon.de!