Student evaluations of teaching are biased, sexist, racist, predjudiced. My summary of Heffernan’s 2021 article

One of my pet peeves are student evaluations that are interpreted way beyond what they can actually tell us. It might be people not considering sample sizes when looking at statistics (“66,6% of students hated your class!”, “Yes, 2 out of 3 responses out of 20 students said something negative”), or not understanding that student responses to certain questions don’t tell us “objective truths” (“I learned much more from the instructor who let me just sit and listen rather than actively engaging me” (see here)). I blogged previously about a couple of articles on the subject of biases in student evaluations, which were then basically a collection of all the scary things I had read, but in no way a comprehensive overview. Therefore I was super excited when I came a sytematic review of the literature this morning. And let me tell you, looking at the literature systematically did not improve things!

In the article “Sexism, racism, prejudice, and bias: a literature review and synthesis of research surrounding student evaluations of courses and teaching.” (2021), Troy Heffernan reports on a systematic analysis of the existing literature of the last 30 years represented in the major databases, published in peer-reviewed English journals or books, and containing relevant terms like “student evaluations” in their titles, abstracts or keywords. This resulted in 136 publications being included in the study, plus an initial 47 that were found in the references of the other articles and deemed relevant.

The conclusion of the article is clear: Student evaluations of teaching are biased depending on who the students are that are evaluating, depending on the instructor’s person and prejudices that are related to characteristics they display, depending on the actual course being evaluated, and depending on many more factors not related to the instructor or what is going on in their class. Student evaluations of teaching are therefore not a tool that should be used to determine teaching quality, or to base hiring or promotion decisions on. Additionally, those groups that are already disadvantaged in their evaluation results because of personal characteristics that students are biased against, also receive abusive comments in student evaluations that are harmful to their mental health and wellbeing, which should be reason enough to change the system.

Here is a brief overview over what I consider the main points of the article:

It matters who the evaluating students are, what course you teach and what setting you are teaching in.

According to the studies compiled in the article, your course is evaluated differently depending on who the students are that are evaluating it. Female students evaluate on average 2% more positively than male students. The average evaluation improves by up to 6% when given by international students, older students, external students or students with better grades.

It also depends on what course you are teaching: STEM courses are on average evaluated less positively than courses in the social sciences and humanities. And comparing quantitative and qualitative subjects, it turns out that subjects that have a right or wrong answer are also evaluated less positively than courses where the grades are more subjective, e.g. using essays for assessment.

Additionally, student evaluations of teaching depend on even more factors beside course content and effectiveness, for example class size and general campus-related things like how clean the university is, whether there are good food options available to students, what the room setup is like, how easy to use course websites and admission processes are.

It matters who you are as a person

Many studies show that gender, ethnicity, sexual identity, and other factors have a large influence on student evaluations of teaching.

Women (or instructors wrongly perceived as female, for example by a name or avatar) are rated more negatively than men and, no matter the factual basis, receive worse ratings at objective measures like turnaround time of essays. Also the way students react to their grades depends on their instructor’s gender: When students get the grades they expected, male instructors get rewarded with better scores, when their expectations are not met, men get punished less than women. The bias is so strong that for young (under 35 years old) women teaching in male-dominated subjects, this has been shown to have an effect of up to 37% lower ratings for women.

These biases in student evaluations result in strengthening the position of an already privileged group: white, able-bodied, heterosexual, men of a certain age (ca 35-50 years old), who the students believe to be heterosexual and who are teaching in their (and their students’) first language get evaluated a lot more favourable than anybody who does not meet one or several of the criteria.

Abuse disguised as “evaluation”

Sometimes evaluations are also used by students to express anger or frustration, and this can lead to abusive comments. Those comments are not distributed equally between all instructors, though, they are a lot more likely to be directed at women and other minorities, and they are cummulative. The more minority characteristics an instructor shows, the more abusive comments they will receive. This racist, sexist, ageist, homophobic abuse is obviously hurtful and harmful to an already disadvantaged population.

My 2 cents

Reading the article, I can’t say I was surprised by the findings — unfortunately my impression of the general literature landscape on the matter was only confirmed by this systematic analysis. However, I was positively surprised to read the very direct way in which problematic aspects are called out in many places: “For example, women receive abusive comments, and academics of colour receive abusive comments, thus, a woman of colour is more likely to receive abuse because of her gender and her skin colour“. This is really disheartening to read on the one hand because it becomes so tangible and real, especially since in addition to being harmful to instructors’ mental health and well-being when they contain abuse, student evaluations are also still an important tool in determining people’s careers via hiring and promotion decisions. But on the other hand it really drives home the message and call to action to change these practices, which I really appreciate very much: “These practices not only harm the sector’s women and most underrepresented and vulnerable, it cannot be denied that [student evaluations of teaching] also actively contribute to further marginalising the groups universities declare to protect and value in their workforces.”.

So let’s get going and change evaluation practices!


Heffernan, T. (2021). Sexism, racism, prejudice, and bias: a literature review and synthesis of research surrounding student evaluations of courses and teaching. Assessment & Evaluation in Higher Education, 1-11.

An overview over what we know about what works in university teaching (based on Schneider & Preckel, 2017)

I’ve been leading a lot of workshops and doing consulting on university teaching lately, and one request that comes up over and over again is “just tell me what works!”. Here I am presenting an article that is probably the best place to start.

The famous “visible learning” study by Hattie (2009) compiled pretty much all available articles on teaching and learning, for a broad range of instructional settings. Their main conclusion was that the focus should be on visible learning, which means learning where learning goals are explicit, there is a lot of feedback happening between students and teachers throughout the interactions, and the learning process is an active and evolving endeavour, which both teachers and students reflect on and constantly try to improve.

However, what works at schools does not necessarily have to be the same that works at universities. Students are a highly select group of the general population, the ones that have been successful in the school system. For that group of people, is it still relevant what teaching methods are being used, or is the domain-specific expertise of the instructors combined with skilled students enough to enable learning?

The article “Variables associated with achievement in higher education: A systematic review of meta-analyses” by Schneider & Preckel (2017) systematically brings together what’s known about what works and what doesn’t work in university teaching, and their main findings.

Below, I am presenting the headings of the “ten cornerstone findings” as quotes from the article, but I am providing my own interpretations and thoughts based on their findings.

1. “There is broad empirical evidence related to the question what makes higher education effective.”

Even though instructors might not always be aware of it because literature on university teaching has been theoretical for a long time (or they just don’t have the time to read enough to gain an overview over the existing literature), but these days there is a lot of empirical evidence of what makes university teaching effective!

There is a HUGE body of literature on studies investigating what works and what does not, but results always depend on the exact context of the study: who taught whom where, using what methods, on what topic, … Individual studies can answer what worked in a very specific context, but they don’t usually allow for generalizations.

To help make results of studies more generally valid, scientists bring together all available studies on a particular teaching method, “type” of student or teacher in meta studies. By comparing studies in different context, they can identify success factors of applying that specific method across different contexts, thus making it easier to give more general recommendations of what methods to use, and how.

But then if you aren’t just interested in how to use one method, but what design principles you should be applying in general, you might want to look at systematic reviews of meta-studies. Systematic review of meta-studies bring together everything that has been published on a given topic and try to distill the essence from that. One such systematic review of meta-studies is the one I am presenting here, where the authors have compiled 38 meta-analyses (which were found to be all available meta-analyses relevant to higher education) and thus provide “a broad overview and a general orientation of the variables associated with achievement in higher education”.

2. “Most teaching practices have positive effect sizes, but some have much larger effect sizes than others.”

A big challenge with investigations of teaching effectiveness is that most characteristics of teaching and of learners are related to achievement. So great care needs to be taken in order to not interpret the effect one measures for example in a SoTL project as the optimal effect, because some characteristics and their related effects are much larger than others: “The real question is not whether an instructional method has an effect on achievement but whether it has a higher effect size than alternative approaches.”

This is really important to consider especially for instructors who are (planning on) trying to measure how effective they or their methods are, or who are looking in the literature for hints on what might work for them — it’s not enough to just look if a method does have a positive effect, but to consider whether even more effective alternatives might exist.

3. “The effectivity of courses is strongly related to what teachers do.”

Great news! What we do as teachers does influence how much students learn! And often times it is through really tiny things we do or don’t do, like asking open-ended questions instead of closed-ended ones, writing keywords instead of full sentences on our slides or the blackboard (for more examples, see point 5).

And there are general things within our influence as teachers that positively contribute to student learning, for example showing enthusiasm about the content we are teaching, being available to students and being helpful, and treating the students respectfully and friendly. All these behaviours help create an atmosphere in which students feel comfortable to speak their minds and interact, both with their teacher and among each others.

But it is, of course, also about what methods we chose. For example, choosing to have students work in small groups is on average more effective than having them learn both individually or as the whole group together. And small groups become most effective when students have clear responsibilities for tasks and when the group depends on all students’ inputs in order to solve the task. Cooperation and social interaction can only work when students are actively engaged, speak about their experiences, knowledge and ideas, discuss and evaluate arguments. This is what makes it so successful for learning.

4. “The effectivity of teaching methods depends on how they are implemented.”

It would be nice to know that just by using certain methods, we can increase teaching effectivity, but unfortunately they also need to be implemented in the right way. Methods can work better or not so well, depending on how they are done. For example, asking questions is not enough, we should be asking open instead of closed questions. So it is not only about using large methods, but to tweak the small moments to be conductive to learning (examples for how to do that under point 5)

Since microstructure (all the small details in teaching) is so important, it is not surprising that the more time teachers put into planning details of their courses, the higher student achievement becomes. Everything needs to be adapted to the context of each course: who the students are and what the content is. This is work!

5. “Teachers can improve the instructional quality of their courses by making a number of small changes.”

So now that we know that teachers can increase how much students learn in their classes, here is a list of what works (and many of those points are small and easy to implement!)

  • Class attendance is really important for student learning. Encourage students to attend classes regularly!
  • Make sure to create the culture of asking questions and engaging in discussion, for example by asking open-ended questions.
  • Be really clear about the learning goals, so you can plan better and students can work towards the correct goals, not to wrong ones that they accidentally assumed.
  • Help students see how what you teach is relevant to their lives, their goals, their dreams!
  • Give feedback often, and make sure it is focussed on the tasks at hand and given in a way that students can use it in order to improve.
  • Be friendly and respectful towards students (duh!),
  • Combine spoken words with visualizations or texts, but
    • When presenting slides, use only a few keywords, not half or full sentences
    • Don’t put details in a presentation that don’t need to be there, not for decoration or any other purpose. They are only distracting from what you really want to show
    • When you are showing a dynamic visualization (simulation or movie), give an oral rather than a written explanation with it, so the focus isn’t split between two things to look at. For static pictures, this isn’t as important.
  • Use concept maps! Let students construct them themselves to organize and discuss central ideas of the course. If you provide concept maps, make sure they don’t contain too many details.
  • Start each class with some form of “advance organizer” — give an overview over the topics you want to go through and the structure in which that will happen.

Even though all these points are small and easy to implement, their combined effect can be large!

6. “The combination of teacher-centered and student-centered instructional elements is more effective than either form of instruction alone.”

There was no meta-analysis directly comparing teacher-centered and student-centered teaching methods, but elements of both have high effects on student learning. The best solution is to use a combination of both, for example complementing teacher presentations by interactive elements, or having the teacher direct parts of student projects.

Social interaction is really important and maximally effective when teachers on the one hand take on the responsibility to explicitly prepare and guide activities and steer student interactions, while on the other hand giving students the space to think for themselves, choose their own paths and make their own experiences. This means that ideally we would integrate opportunities for interaction in more teacher-centered formats like lectures, as well as making sure that student-centered forms of learning (like small groups or project-based learning) are supervised and steered by the instructor.

7. “Educational technology is most effective when it complements classroom interaction.”

We didn’t have a lot of choice in the recent rise of online learning, but the good news is that it can be pretty much as effective as in-person learning in the classroom. Blended learning, i.e. combining online and in-class instruction, is even more effective, especially when it is used purposefully for visualizations and such.

Blended learning is not as successful as in-person learning when used mainly to support communication; compared to in-person, online communication is limiting social interaction (or at least it was before everybody got used to it during covid-19? Also, the article points out explicitly that instructional technologies are developing quickly and that only studies were included that were published before 2014. Therefore MOOCs, clickers, social media and other newer technologies are not included).

8. “Assessment practices are about as important as presentation practices.”

Despite constructive alignment being one of the buzzwords that is everywhere these days, the focus of most instructors is still on the presentation part of their courses, and not equally on assessment. But the results presented in the article indicate that “assessment practices are related to achievement about as strongly as presentation practices”!

But assessment does not only mean developing exam questions. It also means being explicit about learning goals and what it would look like if they were met. Learning outcomes are so important! For the instructor to plan the whole course or a single class, to develop meaningful tests of learning and then actually evaluating it, in order to give feedback to students. Students, on the other hand, need guidance on what they should focus on both in reflecting on what they learned during past lessons, preparing for future lessons, and preparing for the exam.

Assessment also means giving formative feedback (feedback with the explicit and only purpose of helping students learn or teachers improve teaching, not giving a final evaluation after the fact) throughout the whole teaching process. 

Assessment also doesn’t only mean the final exam, it can also mean smaller exercises or tasks throughout the course. Testing frequently (more than two or three times per semester) helps students learn more. Requiring that students show they’ve learnt what they were supposed to learn before the instructor moves on to the next topic has a large influence on learning. And the frequent feedback that can be provided on that basis helps them learn even more.

And: assessment can also mean student-peer assessment or student self-assessment, which agree on average fairly well with assessment by the instructor but have the added benefit of explicitly thinking about learning outcomes and whether they have been achieved. Of course, this is only possible when learning outcomes are made explicit.

The assessment part is so important, because students optimize where to spend their time based on what they perceive as important, which is often related to what they will need to be able to do in order to pass an exam. The explicit nature of the learning outcomes (and their alignment with the exam) are what students use to decide what to spend time and attention on.

9. “Intelligence and prior achievement are closely related to achievement in higher education.”

Even though we as instructors have a large influence on student achievement by all the means described above, there are also student characteristics that influence how well students can achieve. Intelligence and prior achievement are correlated to how well pupils will do at university (although both are not fixed characteristics that students are born with, but formed by how much and what quality of education students attended up to that point). If we want better students, we need better schools.

10. “Students’ strategies are more directly associated with achievement than students’ personality or personal context.”

Despite student backgrounds and personalities being important for student achievement, even more important are what strategies they are using to learn, to prepare for exams, to set goals and regulate how much effort they put on what task. Successful strategies are frequent class attendance as well as a strategic approach to learning, meaning that instead of working hard non stop, students allocate time and effort to those topics and problems that are most important. But also on the small scale, what students do matters: Note taking, for example, is a much more successful strategy when students are listening to a talk without slides. When slides are present, the back-and-forth between slides and notes seems to distract students from learning.

Training strategies works best in class rather than outside in extra courses with artificial problems.

So where do we go from here?

There you have it, that was my summary of the Schneider & Preckel (2017) systematic review of meta-analyses of what works in higher education. We know now of many things that work pretty much universally, but even though many of the small practices are easy to implement, it still doesn’t tell us what methods to use for our specific class and topic. So where do we go from here? Here are a couple of points to consider:

Look for examples in your discipline! What works in your discipline might be published in literature that was either not yet used in meta-studies, or published in a meta-study after 2014 (and thus did not get included in this study). So a quick literature search might be very useful! In addition to published scientific studies, there is a wealth of information available online of what instructors perceive to be best practice (for example SERC’s Teach the Earth collection, blogs like this one, tweets collected under hashtags like #FieldWorkFix, #HigherEd). And of course always talk to people teaching the same course at a different institution or who taught it previously at yours!

Look for examples close to home! What works and what doesn’t is also culture dependent. Try to find out what works in similar courses at your institution or a neighboring one with the same or a similar student body and similar learning outcomes?

And last not least: Share your own experiences with colleagues! Via twitter, blogs, workshops, seminars. It’s always good to share experiences and discuss! And on that note — do you have any comments on this blog post? I’d love to hear from you! :)


Schneider, M., & Preckel, F. (2017). Variables associated with achievement in higher education: A systematic review of meta-analyses. Psychological bulletin, 143(6), 565.

Why students cheat (after Brimble, 2016)

Recently, one topic seemed to emerge a lot in conversations I’ve been having: Students cheating, or the fear thereof. Cheating is “easier” when exams are written online and we don’t have students directly under our noses, and to instructors it feels like cheating has increased a lot (and maybe it has!). We’ve discussed all kinds of ways to avoid cheating: Asking questions that have answers that cannot easily be googled (but caution — this tends to make things a lot more difficult than just asking for definitions!). Putting enough time pressure on students so they don’t have time to look up things they don’t know (NOT a fan of that!!!). Using many different exams in parallel where students get assigned exercises randomly so that they would at least have to make sure they are copying from someone trying to answer the same question. But one question that has been on my mind a lot is why do students cheat in the first place, and is there anything we can do as instructors to influence whether they will want to cheat?

I read the chapter “Why students cheat: an exploration of the motivators of student academic dishonesty in higher education” in the Handbook of Academic Integrity by Brimble (2016) and here are some of the points, all backed up by different studies (for references, check back to that chaper), that stood out to me:

Students are under an enormous pressure to succeed academically, yet at the same time they are real people with lives, families, responsibilities, possibly jobs, and more. Whether its because of financial considerations, expectations of parents or peers, or other reasons: Cheating might sometimes feel like it’s the only solution to survive and finish a course among competing priorities.

Since students are under such a pressure to succeed, it is important to them that the playingfield is level and others don’t get an unfair and undeserved advantage over them. If students feel like everybody else is cheating, they might feel like they have to cheat in order to keep up. Also if the workload is so high they feel like they cannot possibly manage in other ways or content is so difficult, they feel like cheating is their only way out.

Students also feel that cheating is a “victimless crime”, so no harm done, really. Especially helping other students, even if that counts in fact as cheating, isn’t perceived as doing anything wrong. Especially if courses feel irrelevant to their lives or if students don’t have a relationship with the instructor, it does not feel like they are doing anything wrong by cheating.

Also in other cases, students might not even be aware that they are cheating (for example if they are new at university, or studying in interdisciplinary programs where norms differ between programs, or in situations that are new to them (like for example in open-book online exams, where it isn’t clear what needs to be cited and what’s common knowledge?).

Students report the actions of their role models in their academic field, their instructors, are super important in forming an idea of what is right and acceptable. If instructors don’t notice that students cheat, or worse, don’t react to it by reporting and punishing such a behavior, this feels almost like encouragement to cheat more, both to the original cheater and to others who observe the situation. Students then rationalize cheating even when they know it’s wrong.

Cheating is also a repeat offense — and the more a student does it, the easier it gets.

So from reading all of that, what can we do as instructors to lower the motivation to cheat?

First: educate & involve

If students don’t know exactly what we define as cheating, they cannot be blamed if they accidentally cheat. It’s our job to help them understand what cheating means in our specific context. We can probably all be a little more explicit about what is acceptable and what is not, especially in situations where there is a grey area. Of course it’s not a fun topic, but we need to be explicit about rules and also what happens when rules aren’t adhered to.

Interestingly, apparently the more involved students are in campus culture, the more they want to protect the institution’s reputation and not cheat. So building a strong environment that includes e.g. regularly communicated honor codes that become part of the culture might be beneficial, as well as helping students identify with the course, the study program, the institution.

Second: prosecute & punish

It’s not enjoyable, but if we notice any cheating, we need to prosecute it and punish it, even though that might come at high costs to us in terms of time, conflict, admin. The literature seems to be really clear on this one: If we let things slide a little, they become acceptable.

Ideally we would know what the rules and procedures are like at our institutions if we see something that we feel is cheating, and who the people are that can support us in dealing with the situation. If not, maybe now is a good time to figure this out.

Third: engage & adapt

Cheating is more likely to occur when there are no, or only weak, instructor-student relationships. Additionally, if students don’t feel engaged in a course, if they don’t receive enough guidance by the instructor, or if a course feels irrelevant or like they aren’t learning anything anyway, students are more likely to cheat. Similarly if a course feels too difficult or too time-consuming, if the workload is too high, or if they feel treated unfairly.

So the lesson here is to build strong relationships and make the courses both engaging and relevant to students. Making sure that the learning outcomes are relevant in the curriculum and for students’ professional development is, of course, always good advice, but in the light of making students want to learn and not have them feel like they just need to tick a box (and then do it by cheating because it really doesn’t matter one way or the other). Explaining what they will be able to do once they meet the learning outcomes (both in terms of what doors the degree opens, but also what they can practically do with the skills they learned) is another common — nevertheless now particularly useful — piece of advice. And then adjusting level of difficulty and workload to something that is managable for students — again, good advice in general and now in particular!

Of course, doing all those things is not a guarantee that students won’t cheat. But to me it feels like if I’ve paid attention to all this, I did what I could do, and that then it’s on them (which makes it easier to prosecute? Hopefully?).

What do you think? Any advice on how to deal with cheating, and especially how to prevent it?


Brimble, M. (2016). Why students cheat: an exploration of the motivators of student academic dishonesty in higher education. Handbook of academic integrity, 365.

#WaveWatchingWednesday

Haven’t posted a #WaveWatchingWednesday in a while — but I am very regularly posting over on my Instagram @fascinocean_kiel. Check it out if you fancy a more regular supply of pics!

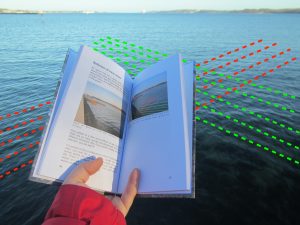
Finally a sunny day again! Which means that I HAVE to get outside. And voila: awesome #WaveWatching! See the waves radiating as half circles from a point source from the lower right corner? That’s a dog drinking!

This morning, there was only a super thin layer of ice on the pond — enough to trap small air bubbles in some spaces, but still flexible — and on it, the fern-like structures in which the ice grew were still visible. So pretty!⁠

Do you see the large ring waves on the left, where a duck is riding on the edge of the wave? It was caused by the three ducks reaching the “ice edge” (well, the edge of super thin ice floes that weren’t even connected) and the first duck deciding to fly to the next spot of open water, where it landed with a splash in the center of that wave, and then flew another wing flap or two to where it is sitting now, while the wave spread. But the ice the duck was avoiding explains why the wave looks so much smaller on its right side than on the left where the duck is! The ice also explains why it’s really difficult to see the wakes of the other two ducks on the right — all the waves are dampened away by the ice.⠀

Ice looks differently depending on the conditions it formed in. Here, supercold & calm water recently froze in long needles. If there had been waves, needles wouldn’t have been able to grow so long, slush would have formed and then pancakes. If there had been salt in the water, it would look more milky and less clear. If the ice had started melting and then refrozen, the structures of the needles would have gotten destroyed. Fascinating how much ice can tell us about what conditions must have been prevalent!⁠⠀

Ice needles are a prominent feature of freshly formed ice on calm puddles or lakes when the water is supercooled. They form all over, growing longer and longer, until they meet another needle. Only then do the spaces between needles start to fill.

No waves? No problem! (Thanks to these amazing #GreatWave mittens by @kjersti.daae ) And what looks like melt ponds on the ice here is snow falling on a more-or-less intact ice sheet. The more intact, the more snow. The wetter, the better — for wave watching Good thing it’s the weekend now!

There is enough water in this pic — in frozen form in the snow, and as tiny droplets in the fog — to warrant an appearance here. What a beautiful day!

Wet snow is definitely better than no snow. And even better when work meetings can happen on the phone and we can at least do virtual walk & talk meetings :)

This picture shows a puddle, that froze and got snowed on, then someone broke that snowy ice sheet and bits of ice got pushed into the water while others were pushed out (see for example the grey thing on the right). The puddle then froze again (all the clear ice you see) and hoar frost grew on some of the old pieces of ice (those needles you see. The long ones are longer than a centimeter!). And all of this in just one puddle!

I am fascinated with phase transitions at the moment. Here, snow fell on this bush. It then partly melted in the sun the next day, and the next night the liquid water refroze, forming an icicle.

Hoarfrost grew on a puddle the froze, broke open again, froze again⠀

Very distracting to work under a skylight… Turns out it is pretty difficult to take pics because they melt so quickly and it’s super difficult to focus on the right depth in between all the melt water puddles that have a much higher contrast!

More snowflakes! Here the same ones with slightly different tilt of the camera — against the bright sky vs thr dark tree. Such different results!

Too much snow on the skylight above my desk to look outside, so I had to actually go outside to look at snow. And it was so fluffy that one could really see individual snow flakes! How cool is that???

Albedo effects: where there is snow, it’s easier for more snow to accumulate because the white surface reflects incoming sunlight and stays relatively cold. Darker surfaces warm up faster, snow melts, surfaces remain darker, snow still melts more easily than on white surfaces… In this pic we see this both on a larger scale and on the micro scale in some animal’s footprints! Where the animal compacted the snow, it melted less than around it, so new snow accumulated on the old footprints but not around them. Therefore they stay visible for days!

More pretty snowflakes spotted “in the wild” <3⠀

Coffee in #KitchenOceanography

For some reason my workflow regarding all things #KitchenOceanography and #WaveWatching changed at the beginning of this year. I started editing frames on the pictures I’m posting on Instagram, and, since I was most likely doing this on my computer anyway, scheduling the posts through a program on my computer, which meant that I was typing captions on the computer, too, writing a little more. But somehow that meant that I had already written everything I wanted to write about the pics and didn’t feel the urge to blog later, so … I didn’t. Until now, that is!

Here is a collection of my Instagram posts on coffee in #KitchenOceanography!

[photo] Coffee cup in which two counter-rotating eddies form because Mirjam @meermini is blowing across the cup. The eddies become visible because the circulation disrupts a surfsce film caused by cream in the coffee

Enjoying your lazy first morning coffee of the year (or already back from your New Year’s morning walk, but forgot to take pictures — what’s wrong with you, 2021?)? Then it’s a perfect opportunity to look at wind-induced currents in your coffee! Gently blow across the cup and observe how two counter-rotating eddies develop. This becomes especially clear if you take milk in your coffee (or something else that creates a surface film). Enjoy!

Maybe not The Best Thing about morning coffee, but definitely very important: Observing what happens when you pour milk or cream in! Here the cold milk is denser than the coffee, so it sinks down to the bottom of the glass (it would probably even shoot to the bottom of the glass if it was the same density as the coffee since it’s coming in with a lot of momentum). Hitting the bottom, it shoots along the curved rim of the glass and up in these cute little turbulent billows. But eventually, it will settle on the bottom of the glass, forming a denser layer under the less dense coffee — that’s what we call a stratification, both in density and in coffee&milk. And it’ll stay like that for a little bit, until other processes come into play. So stay tuned for those :-D⁠

Actually, not only internal waves, but also current shear!⁠ When you pour milk into coffee, the milk will form a layer at the bottom of the coffee. Similarly to when you poured the coffee in and it surface leveled out, the surface of the milk wants to level out. And similarly to the waves that you probably observed initially on the coffee when you poured it in, waves appear on the interface between milk and coffee. Except that these waves have larger amplitudes, move more slowly and persist for longer. That is because the density difference between milk and coffee is orders of magnitude smaller than that between coffee and air. Those waves are called “internal waves”.⁠ And what we see in the pic, too, is that the milk layer is moving relative to the coffee layer, therefore the wave crests are being pulled into these sweeping strands. Pretty awesome!⁠

My sister & nieces made this mug for me for Christmas. Isn’t it just perfect together with the swirl in the last bit of my coffee? I’m considering making this my logo and profile pic and EVERYTHING because I think it is Just. Perfect.⁠

I’ve been playing around with different glasses and different ways of lighting them in order to get clearer pictures of the things I want to point out: The behavior of the fluids, not reflections on the side walls of the tanks I am using. At least here there are only two stripes where the light is reflected? And the internal waves on the interface between milk at the bottom and coffee on top come out quite clearly. Even from this photo you can see how dynamic the system is!⁠

Again, there is a milk layer at the bottom of the coffee. And those mushroom-y milk fingers appear when the milk is warming up and its density is thus decreasing. As it gets less dense than the coffee, the stratification becomes unstable and milk starts rising until it reaches a level of its own density.⁠

Today there is some interesting surfactant on my coffee. It might be due to oils in last night’s tea that I didn’t clean off, or maybe it’s the cream (but I would think that that’s the little blobs of oil you see). In any case, the surface film behaves in very interesting ways: It is showing us a front in the coffee, with lots of small instabilities on the front! The front must be related to me drinking from the mug somehow, but I’m not sure how. Thanks to the surface film, we also see convection occuring in the top left, where we get all those small-scale structures in the color, lighter areas indicating convergence zones where the surface film gets pushed together, darker areas where it is pulled apart.

A little while ago I posted a picture of the front you see in my coffee here. And what I did then was twist the mug a little bit: I wanted the front to be in the picture more nicely together with the little boat. BUT: exciting things happened (predictably): As I was twisting the mug, it did not behave as a solid body together with the coffee. Rather, it twisted while the coffee was not! And this created shear between the sidewalls of the mug and the coffee, which is what we see all around the edge: shear instabilities breaking into eddies! And all that due to inertia of the coffee.

About #KitchenOceanography

At the end of last year, I did a poll on Twitter, asking what people would like to see more of in 2021: Kitchen oceanography, wave watching, teaching & scicomm tips, and other things. And 2/3rds of the respondents said they wanted more kitchen oceanography!

So obviously my strategy was to do a photo shooting and prepare … Instagram posts (did I mention I asked that question on Twitter? Yeah. Don’t ask me about the logic behind that). Anyway, below is the beginning of that series (which, on Instagram, is not posted consecutively, in case you are wondering about how often people want to see me grinning at the exact same experiment…). Enjoy!

[photo & text] Mirjam @meermini cheering with a glass filled with clear water, with a green ice cube floating in its green melt water on top of the clear layer. In the foreground a second glass with a green ice cube in it, this time floating in completely green water. Text on the photo says "Cheers to the new year" and "#KitchenOceanography"

So people tell me they want to see more #KitchenOceanography. Get ready for 2021, I come prepared! Carrying a non-alcoholic experiment with me (doesn’t look like it, does it?). Can you tell which of the glasses contains salt water and which fresh water? Both were at room temperature before I put in the (now mostly melted) ice cubes… Happy New Year! May your 2021 be full of curiosity and new experiences!

[Photo and text] Mirjam @meermini pointing at a glass in which a green melt water layer is spreading from a green ice cube over clear water. The text says "Observation. Discovering oceanography everywhere. #KitchenOceanography"

What do I love so much about #KitchenOceanography? Discovering oceanography EVERYWHERE. . When people think of oceanography, they think of endless oceans, weeks and weeks at sea on research ships, something that feels remote and unconnected to their everyday lives. But for me, it is anything but! And #KitchenOceanography is a great tool to bring the ocean and a normal everyday life closer together, both for myself and others. The concept of #KitchenOceanography is simple: you use what you find at home to simulate oceanic processes. Usually this involves some kind of “tank” (anything from a tupper ware container to the wine glass as in the picture), obviously water (usually varying temperature or salinity to change density), food dyes (or anything that can safely be used in food storage containers and that can act as coloring, e.g. dark red fruit juice, black coffee, …). And then you put it together, observe, and relate the physics happening in your kitchen to the things that happen on much larger scales in the ocean. Fun! #KitchenOceanography works really well as a fun activity at home, but is also a great tool in teaching, both in-person and remote. Over the next couple of posts I’ll tell you how and why to use it, and give you plenty of ideas for #KitchenOceanography experiments, so please check back!

[Photo & text] Photo of Mirjam, grinning stupidly at the camera while holding green ice cubes over two glasses full of water. Text in the photo says "Excitement. Right before the experiment. #KitchenOceanography

It might not be immediately obvious to you why I am grinning stupidly at the camera in the picture above, while holding green ice cubes over two glasses full of water, so let me explain. I am about to drop the two ice cubes into the two glasses of water. But those two glasses are not filled with the same stuff. Even though it’s water at room temperature in both, one is fresh water and the other one is salt water at approximately a typical oceanic salinity (e.g. 35g of salt per liter water, or 7 tea spoons per liter). When the ice cubes are dropped into the water, they’ll both melt (in fact, they have already started, which is why I had green finger tips for days after this picture was taken). But they won’t melt in the same way. I’ve done this experiment dozens of times, alone or with people from preschool age to professional oceanographers, so I know what will happen. But what I don’t know is what EXACTLY it will look like, and what I might discover for the first time, or see more clearly than before. Even though the experiments are simple, there is ALWAYS something new to discover, because even such a simple system is still chaotic. Plumes of melt water will never look exactly the same, nor will the condensation on the glass. Discovering all those small featuers and contemplating the physics behind them makes me happy, and it’s easy to engage most people once they get over the “you are looking at two ice cubes and two plastic cups!?” threshold and actually start observing, questioning, and trying to explain, which is why #KitchenOceanography is such a great tool in teaching & outreach!

Photo & text: Mirjam @meermini holding two green ice cubes over two glasses of water, grinning stupidly into the camera. Text says "Eliciting. What do you think will happen next? #KitchenOceanography"

Eliciting! . #KitchenOceanography is a great tool in teaching and outreach of ocean and climate topics, because we are using a simple system — one that people think should be easy enough to intuitively understand. But this is often not the case for many reasons, one being that many people have “misconceptions” about physical processes: ideas that they formed and that worked well to explain their observations until now, but that aren’t correct and that will break down in the context of the physics we are trying to teach. . But in order for those misconceptions to be changed into correct understanding of physics, they first need to be brought to light and be made conscious. . For example by asking: In front of me you see two glasses, one filled with salt water, the other with fresh water, both at room temperature. If I drop the ice cubes in, which one will melt faster, the one in fresh water or the one in salt water? . At this point, it is not important that students give the correct answer, but that they articulate their beliefs. And what happens next? Look out for my upcoming “confront” post!

Photo & text: Mirjam @meermini holding up two wine glasses which she looks critically at, both with green ice cubes floating in them. One glass contains clear water with a thin green layer on top, the other glass contains green water

Confronting! In my previous “eliciting” post, I talked about the importance of realizing WHAT it is that we believe about how the world works. But what if our beliefs are wrong? Then, #KitchenOceanography is a great tool to confront a prediction of what SHOULD happen with what actually DOES happen. It’s surprisingly difficult to observe something that is not what we expect to observe! But when we manage to make observations that contradict what we expected to see, we come to the “confronting” step: Realising that there is a conflict between our interpretations of the world and how the world really works. So what now? Look out for my upcoming “resolving” post!

Mirjam @meermini holding two wine glasses, filled with green ice cubes melting in water, towards the camera. Text says "Resolving! How can you explain your observations?"

Resolving! . In previous posts, we have eliceted a misconception by asking what we believe would happen in an experiment and making predictions about the outcomes. We then confronted our prediction with an actual observation. . Now we need to somehow resolve the cognitive dissonance — what we thought should happen did not happen — and build new, correct ideas about physics into our belief system. This happens best by explaining how things fit together, either to others or to ourselves (I think the main reason I like blogging and social media is because it forces me to explain things to myself, thus helping me to understand them better!). . So this is where we talk through what we observed, what did happen, how we can explain it, what might have happened if the boundary conditions had been different. Another thing that’s great about #KitchenOceanography is that in many cases, it is very easy to test what happens when you change the boundary conditions: You CAN force the ice cubes to the bottom of the glasses and observe what happens, you CAN add salt to the water before making the ice cubes, you CAN change the water’s temperature. And then observe what happens, and see if it fits with what we expected to see. . Of course, once we get playing with #KitchenOceanography, we easily get stuck with it, changing one thing, then the next. So if you use this in teaching, be aware that it will — and should! — take a lot longer than just running an experiment once, and then moving on. But, since the experiments are so easily done with household items, students can always continue discovering outside of class, too; no fancy lab needed! Perfect! :)

Insta takeover on snowflake formation

Back in December, I did a takeover of the Instagram account of WissKommSquad, a community of german science communicators. I translated it over new years, but somehow never published it. I have since taken tons of much better pictures of snowflakes, but the story I’m telling here is still interesting, I think: How snow and ice form through different processes and why they look the way they do. Have fun!

(First an embedded version directly from Canva, which I used to produce the story, and then below the cut the individual pictures)

Snow Story @SWissKommSquad by Mirjam Glessmer
Continue reading

Using #WaveWatching and #KitchenOceanography to prepare students for a one-day research cruise

When students have only one day at sea, it’s important to prepare them well for what will happen there so they get the chance to make the most of the experience. For example, let’s consider a one day student cruises just outside of Bergen. Students are divided in teams that use different types of instrumentation and that investigate different questions. After the cruise, students use the data they acquired during the cruise to write a report on the data.

There are several different aspects that I would like to prepare the students for:

  1. Recognizing and understanding the relevant physical processes they are supposed to investigate
  2. Dealing with the data both onboard and once they get back home

Below, I’m expanding on my thoughts on how to do that.

Recognizing and understanding the relevant physical processes

Let’s look at two typical teams on those student cruises: the “drifter” team that deploys surface drifters and interprets the trajectories later on, and the “CTD” team that takes profiles of temperature, salinity and other properties of the water column and then interprets those afterwards.

Interpreting surface drifter data

In the area investigated during the student cruise, there are several processes that influence which way a passive surface drifter will take, e.g. tidal currents, wind-driven currents, the circulation induced by fresh land run-off, wave-induced drift. Also there might be effects of wind on the drifter (although when designing the drifters, care was taken to minimize the effect) or of other processes. The relative importance of those processes is not necessarily clear beforehand (or even when looking at the data), and it is most likely neither constant in time nor in space. So even though it seems like it should be simple enough, it’s not an easy task!

Additionally, even though students are theoretically familiar with some of the processes, their familiarity is mostly restricted to theoretical considerations of ideal cases, not with messy mixtures and real-life cases. So my suggestion would be to help them familiarize themselves with these processes, for example like this:

First: help them realize that there are many many many processes happening simultaneously

One way to do this is to provide a picture that shows many different things at once and ask students to annotate it with a certain number of processes they can spot. Knowing that there are at least four (or however many) processes to discover in the one picture they are given gives them confidence to name at least that many, or to keep looking until they’ve found that numer.

I usually use a different example, but since tomorrow is #CTDappreciationday and I’ve been looking at old CTD pics, I thought I’d give you a new one:

In this picture of a submerged CTD, we see any different processes, for example looking at waves: a wake-like wave where the CTD wire has been cutting through the water as the ship moves relative to the water, the splashes that happen when drops from the crane fall into the water and the little crowns they form, how the waves spread as rings from the points of impact, how different waves are supperposed and the interference pattern they form. Or ALL the optics of light going in and out of water: how shapes appear deformed, how colors change, … And many more!

Obviously it would be advisable to chose a picture that shows processes related to what the students are supposed to investigate.

Second: ask them to observe a given location and observe and describe as many different (or three, or five) situations as possible

This task is similar to the first one, but not having the reassurance that there are so-and-so many processes visible at the same time makes it a little more difficult. But it’s a great exercise to try and find as many different things going on in a system, because it will later help them to think of processes that might influence their observations.

For location ideas, check out the #BergenWaveWatching series over on Elin’s blog!

Third: ask them to go & discover a process “in real life”

Now that students have seen that life is messy and processes aren’t usually occuring in isolation, but are superimposed on or interacting with others, they are ready to go find a process in real life. To prepare students of the drifter group, useful tasks could be to find (and document) instances of

  • a tidal current (and how do you know it’s a tidal current and not just a regular gravity-driven current like in a river? You might have to come back at a different time, or relate the current to tide tables)
  • wave propagation and current direction not being aligned (since surface waves are a lot easier to observe than current direction, it’s easy to assume they are always in the same direction. They are not!)
  • land run-off forming a buoyant (and possibly differently colored) plume in saltwater (or any other water forming a plume in a larger body of water, e.g. a storm drain going into a lake)

Even if students might not find the exact process you were hoping for, that’s ok! They will probably have an explanation for why their replacement is a good one, and that means that they put some thought into it, too.

Four: ask them to observe (some of) the relevant processes in real life and collect data

I find it a very useful exercise to try and collect data on a phenomenon without any proper equipment. For example, a tidal current can be related to the position of buoys within it, or the tidal elevations can be estimated by repeatedly taking pictures of the same pylon of a bridge. And then, of course, plot the data and discuss it!

It might seem like busywork, but I would argue that it really helps practicing observational skills. And they are going to appreciate instrumentation so much more once they get to work with it later on! :-)

Five: relate it to what to expect at sea

This is the really difficult part. From their short cruise, students will come back with a data file full of numbers, i.e. the positions at the drifter at a given time. How does that relate to what they’ve been observing until now?

Well, the idea is for them to come back with so much more than just the one data file with drifter positions. Ideally, since they know how messy the system is they are about to interpret, they’ll come back with data on the wind field (either from what the atmosphere group measured, or from the regional weather forecast), with data on the tides (from tidal gauges in the area, or models), with observations of wave height to calculate Stokes drift, with observations of anything unusual (like once when one of our drifters got caught by a ship and displaced). Ideally, all the practices we did beforehand prepared them to realize that they will want to have all this data, even if only to exclude the influence of one or several of those factors.

Ok, so much for our drifter group. Now on to the CTD group!

Interpreting temperature & salinity profiles

Temperature and salinity profiles have arguably been the most important type of oceanic data in the history of oceanography. They are also not something that is easy to come by, because you typically need a ship and some instrumentation to measure them. But there are still ways to help students familiarize themselves with the idea of temperature and salinity profiles in a practical way before their cruise.

First: help them realize that there are many many many processes happening simultaneously

Temperature and salinity profiles are really difficult to interprete because there are SO MANY things influencing them! A really good way to realize that is by asking students to do a simple overturning experiment and draw profiles over time in fixed location.

In the very simple overurning experiment, T and S profiles could look something like what’s sketched in above. The red dye is heated (in order to make it buoyant enough to stay on top and mark the surface flow). I’m writing “S” in quotation marks, because I’m lumping both red and blue dye together as “something dissolved in water”, which I abbreviate as “salinity” for this purpose… And of course, all the overshoots in S don’t make sense, as I realized when I couldn’t be bothered any more to draw it again… But a good point to discuss, maybe? :-D

Here we see that it’s not just the cooling driving a circulation, we also see salt fingering occurring as the red dye cools and thus becomes denser than the clear water at the same temperature. So even in such a simple experiment there are different processes happening at the same time!

Second: ask them to observe a given location and observe and describe as many different (or three, or five) situations as possible

Same as I suggested for the “drifter” group, possibly with a focus on processes that influence temperature and salinity (river runoff, rain, evaporation, mixing by surface waves, parts of the body of water that are in the sun vs shade). The point is not necessarily to find the most relevant process, but to recognize which processes might potentially have an influence (even if minuscule) and thus make interpretation of observations more difficult later on.

Three to five

The temperature and salinity profiles are influenced by similar processes as I described for the drifter group, because they are shaped by advection of water with different properties and from different directions. So trying to observe the processes described above makes a lot of sense here, too! As do the other steps I described above.

But now how do we prepare students to cope with the data once they are back from their cruise?

Dealing with the data

Students are provided with finished programs that read in and plot the data, that they only need to modify if they want to show things in a different way. Yet it’s surprisingly difficult for them to manage that when they come back from the cruise.

There are several aspects to dealing with data that we can help students prepare for:

  • getting data into the program you want to work with, and making plots
  • interpreting plots
  • interpreting data

Of course, all of this could be done just by using last year’s data (and actually maybe it’s not such a bad idea to ask students to re-run someone else’s analysis, because then they KNOW it worked a year ago, so unless they changed something, it should be working again now). After reproducing last year’s figures, students could read last year’s interpretations of those figures and discuss whether they agree with them or what they would do differently (obviously this works best if last year’s interpretations are somewhat helpful).

BUT it could also be done using new data that the students generate themselves as part of their observations earlier. For example for the temperature and salinity profiles in the easy overturning experiment, they could use some depth axis and assign numbers to the profiles that qualitatively represent the shape they drew earlier (or, if you wanted to get fancy, you could probably use temperature probes in the tank and get actual numbers). The idea here is not to get data that is as complex as they would get on the cruise, but to get a data file that is similarly structured to the ones they are expecting to get, to read it in, to plot it, and maybe practice to modify axes etc..

What do you think? Any suggestions, comments, feedback?