Learning about tides from art moored in a river
Disclaimer: This post might well be called “fun with tides” similar to Sheldon Cooper’s “fun with flags” — it is super nerdy, but at least I am having fun!
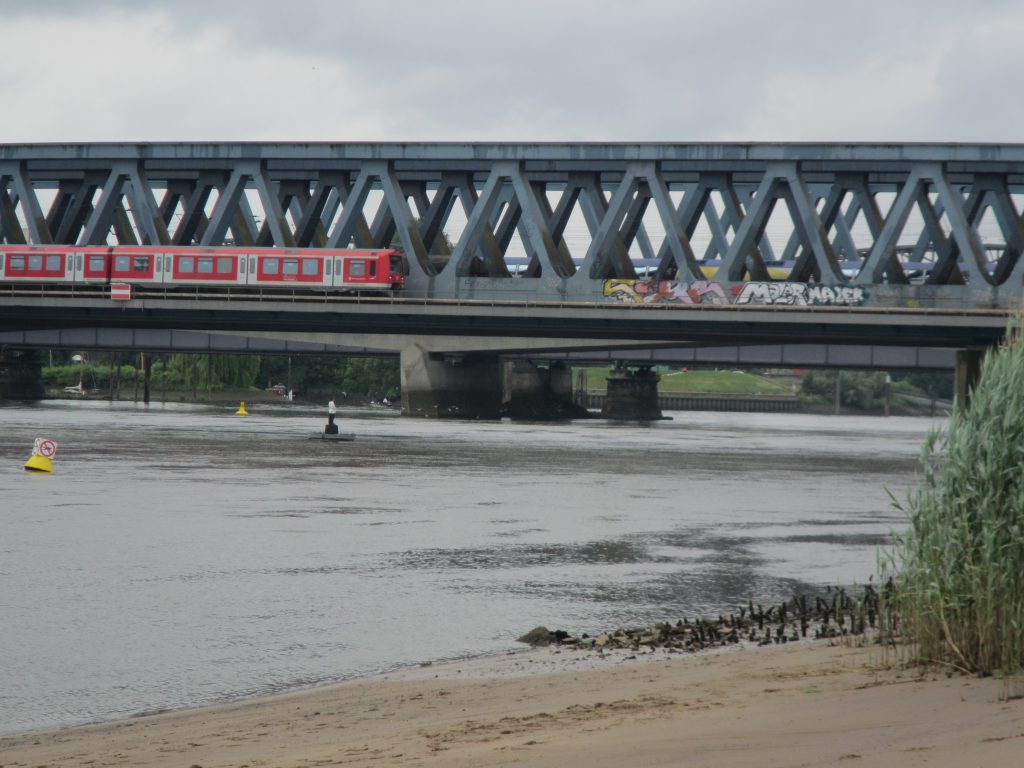
There is some really cool art around Hamburg, and the one I want to talk about today is called “four men on buoys” by Stephan Balkenhol: Four wooden statues of approximately live-sized men, standing on little floats, moored in four different spots all over Hamburg. One of them happens to be on the Elbe river, visible when you cross the bridge from where I work over to the city center. You ca see the scene below: The train going across the bridge, and the guy (in the white shirt) standing on the river.
What you can sort of see in the picture above from the yellow buoy being tilted to the right: There is quite a strong current in that river. And what you can’t see in the picture, but will find out below: It’s a tidal current, hence its direction reverses regularly.
You can guess what that means for anything moored in the river: Yes, it will change its position following the tides!
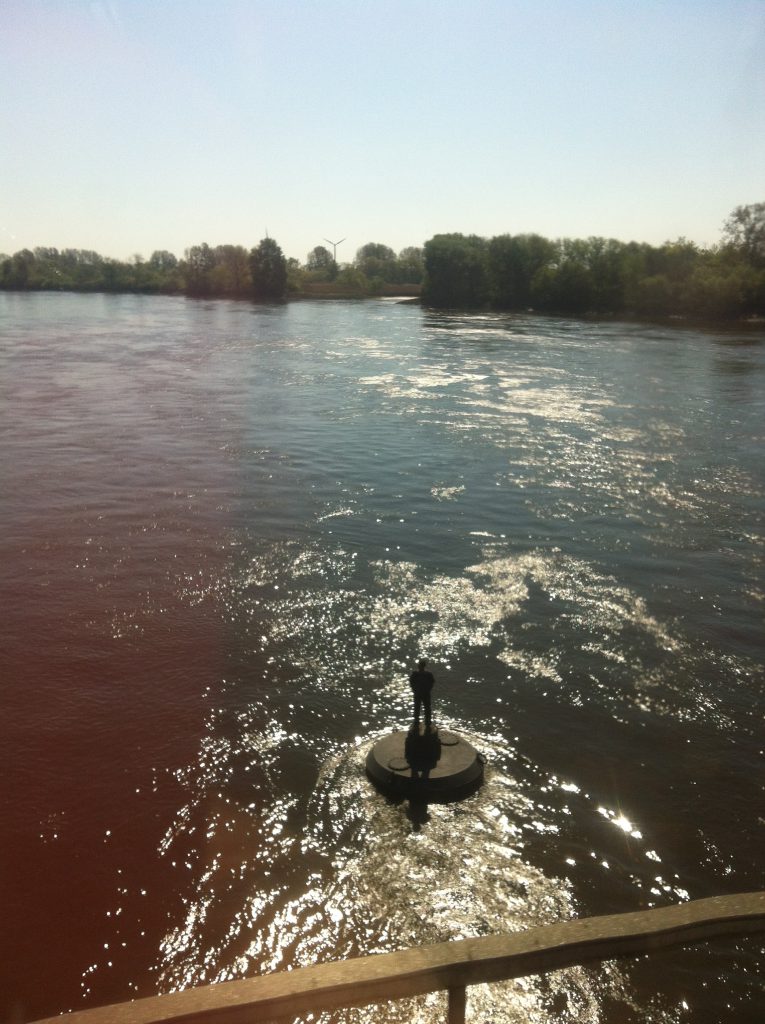
This is where my nerdy self comes in. Whenever I take the train across that bridge, I try to snap a picture of the guy on the buoy. It is quite a difficult endeavour — the train usually goes pretty fast, and I never know where exactly the guy is going to be (well, I guess I could look at a tide table beforehand, but I’ve never done that) and taking pictures out of a train window is not that easy in itself. But sometimes it works out beautifully to show both the position of the guy and the currents:
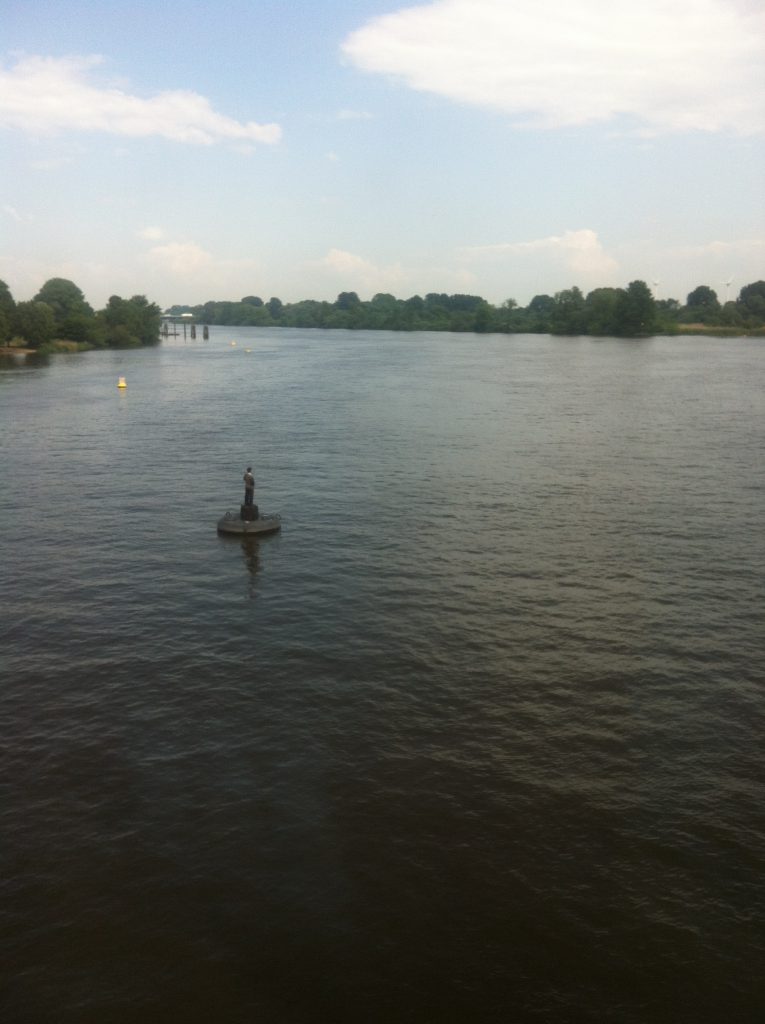
As you see in the image below, the wake is in the direction towards the viewer. This means that the water is flowing towards the viewer, i.e. downstream. You can see that the current is fairly strong because the wake is very pronounced (“very” at least relative to some other pictures you’ll see later).
For this post, I checked my phone and found a collection of 16 pictures of that guy. So clearly I had to see when they were taken relative to the time of high water that day. In the image below, each tick marks the time of one of my pictures relative to zero, the time of the nearest high water.
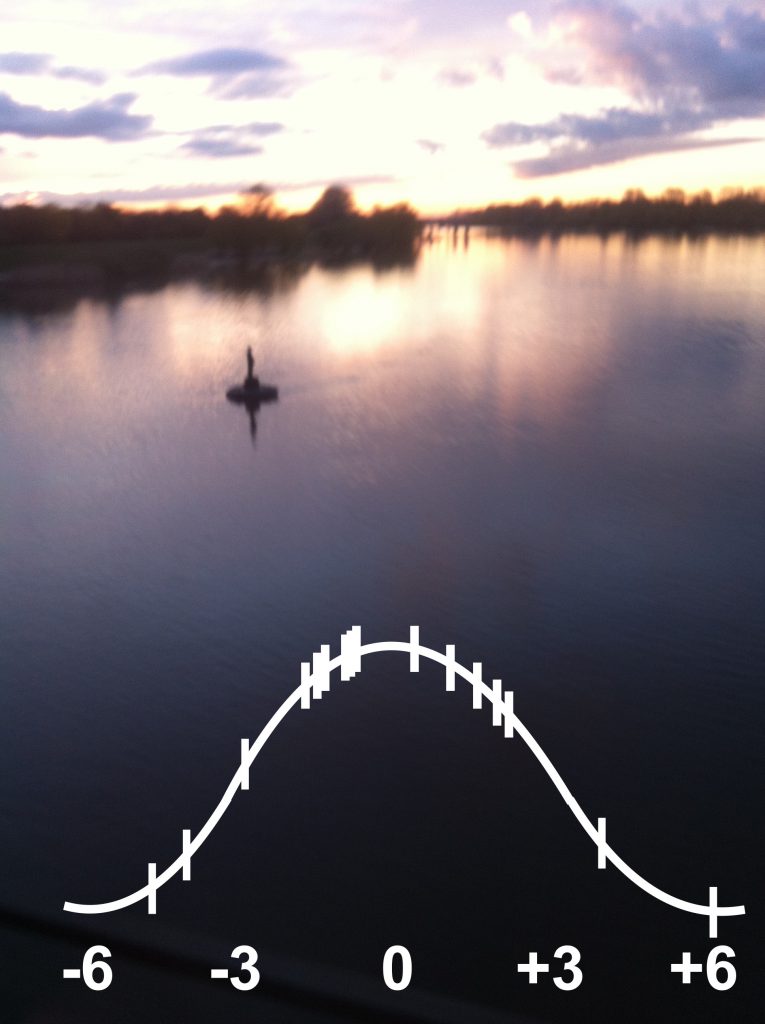
The guy on the buoy, plus an eye-balled plot of my data points. 0==high water. This picture was taken 1 1/2 hours after high water that day.
As you can see, I seem to be on the train more when it’s close to high water than close to low water. Funny!
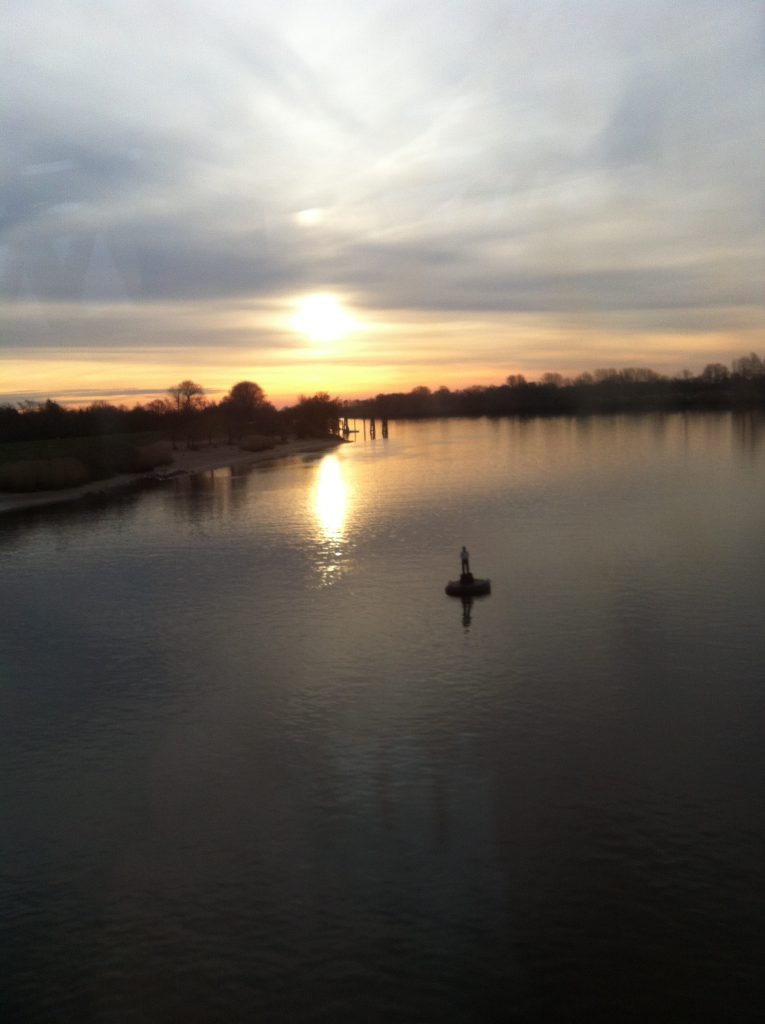
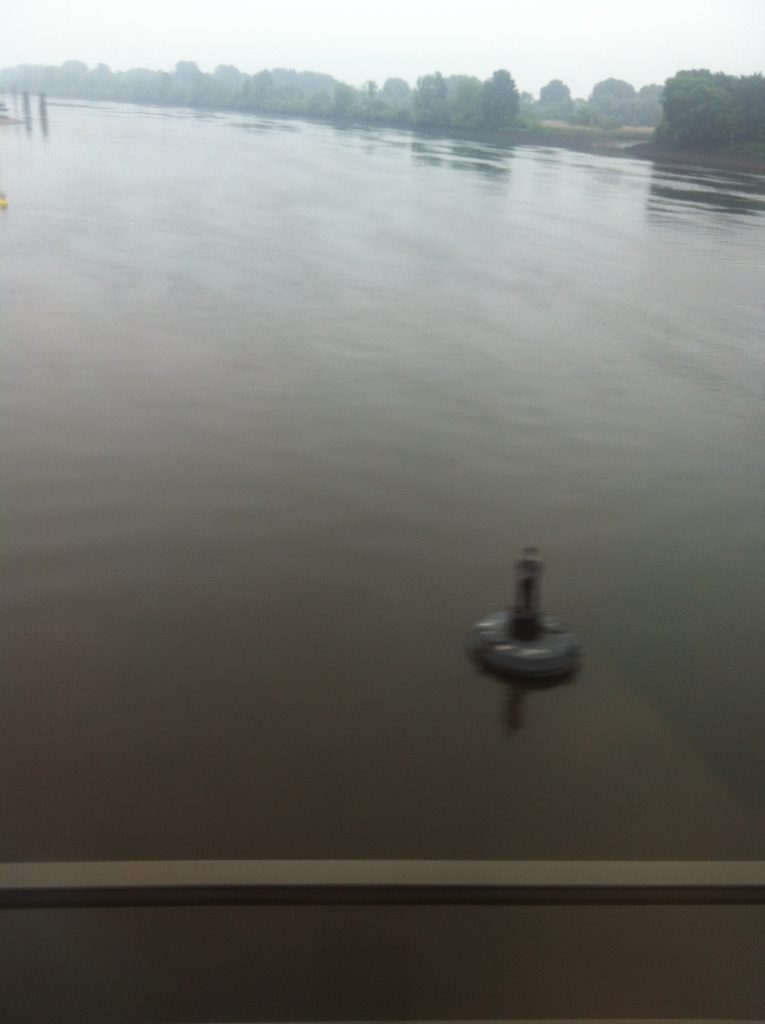
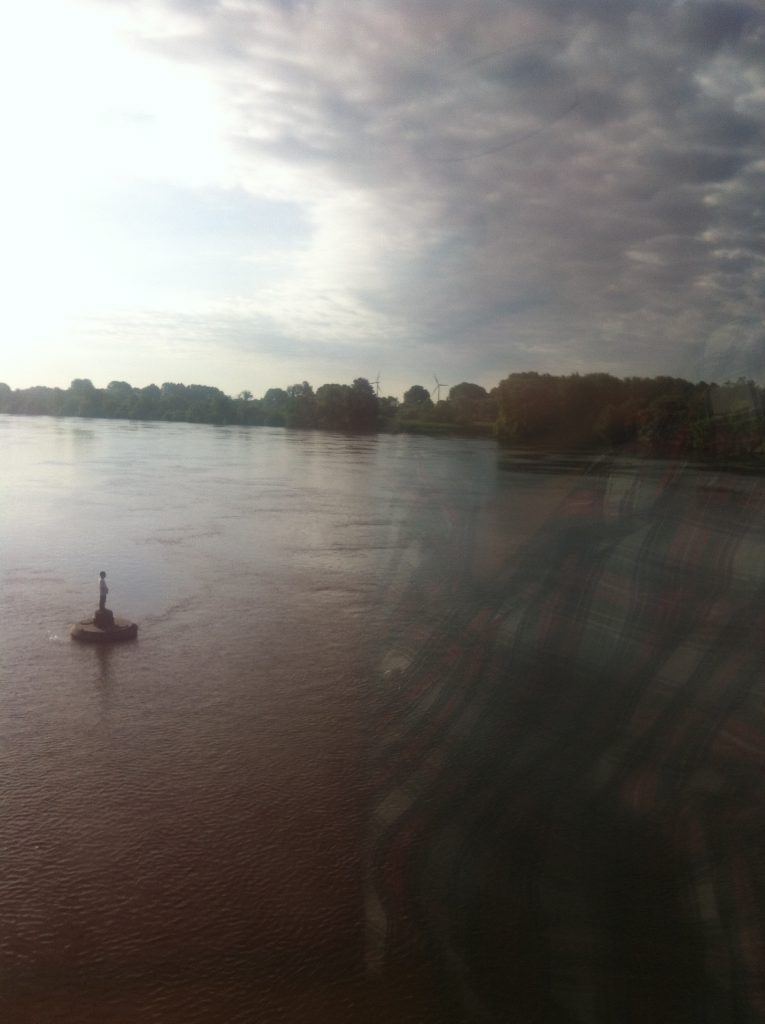
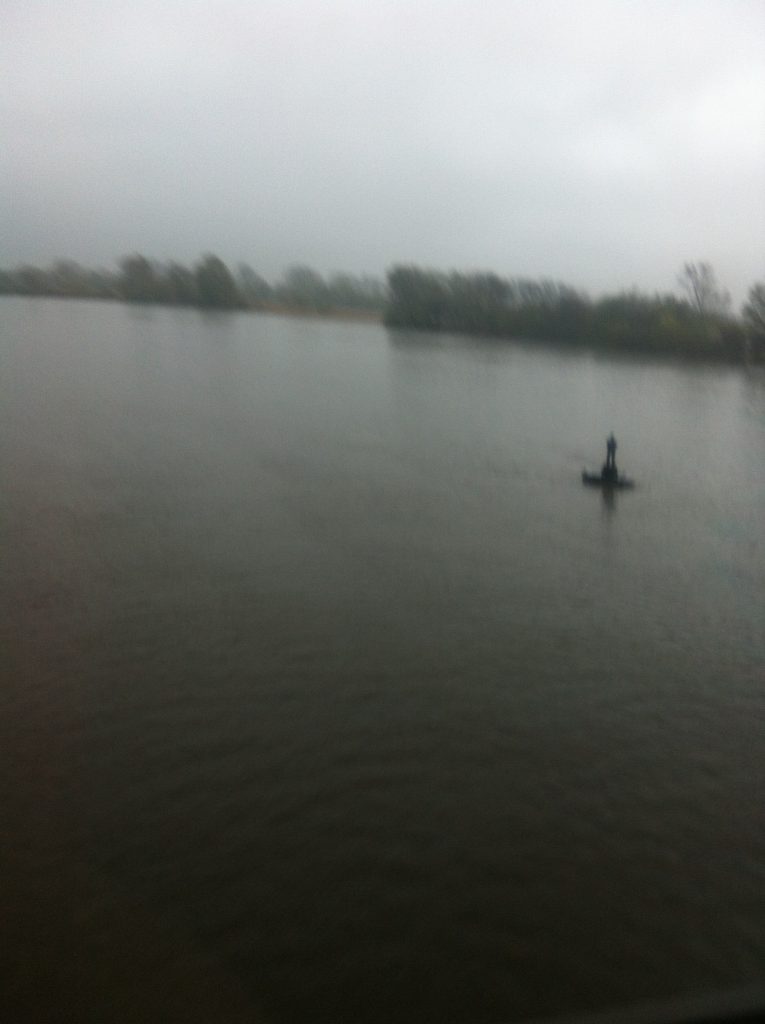
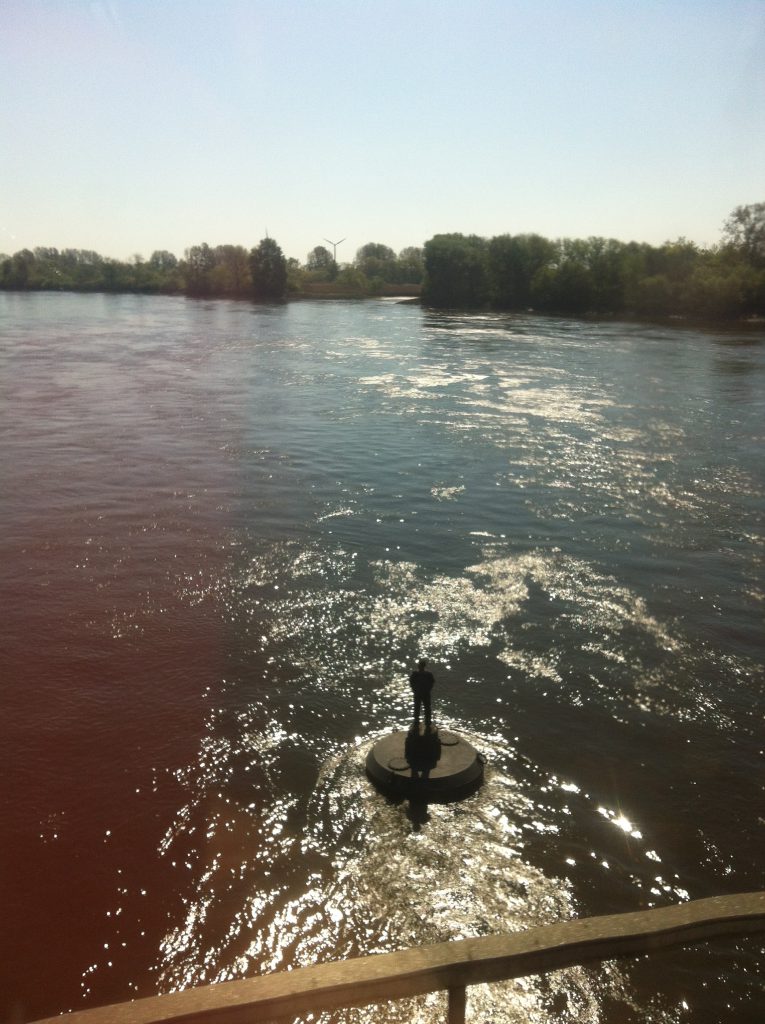
Now, when I show you all my 16 data points, let’s remember that we are now only looking at time before/after high water. We are neglecting important things like where exactly the picture was taken from (I’m excited to catch the guy on the buoy at all from a fast train!) or where we are in the spring / neap cycle. Plus the different times of day when the pictures were taken and the different weather conditions make comparison hard. Yet, it’s fun to see how the strength and even direction of the current (which you can see by looking at the wake and the position of the guy relative to the bridge) is changing!*
Before I show you the pictures, a CALL TO ACTION: If you happen to be on that train, snap a picture and send it to me! I’ll happily compile a better series with more data points! I’ll continue taking pictures, too, that’s for sure! :-) Imagine how you could use this kind of data in teaching! If I were to teach a class on tides at this university, I would have students collect this type of data and use it to say something about the tides on Elbe river. If there is enough data (which should be easy enough to get with many students commuting across this bridge every day), I am sure one could learn a lot from this case study! And working with data students collect themselves is always more fun than looking at some data set in a text book anyway. Plus how much more exciting would commuting get for those students once they start observing in this way, and starting to think about water, instead of just being bored on the train? There are actually a couple more times where you see the river quite well on the train journey between university and the city centre, so there might be many more case studies easily done if only people started looking for them…
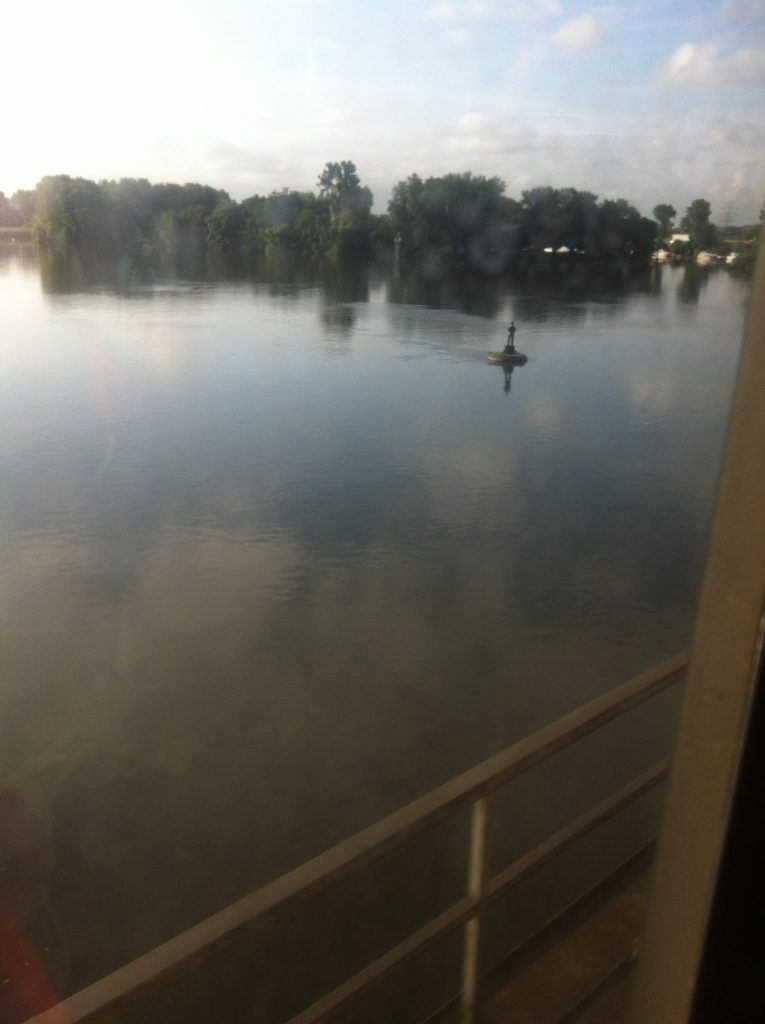
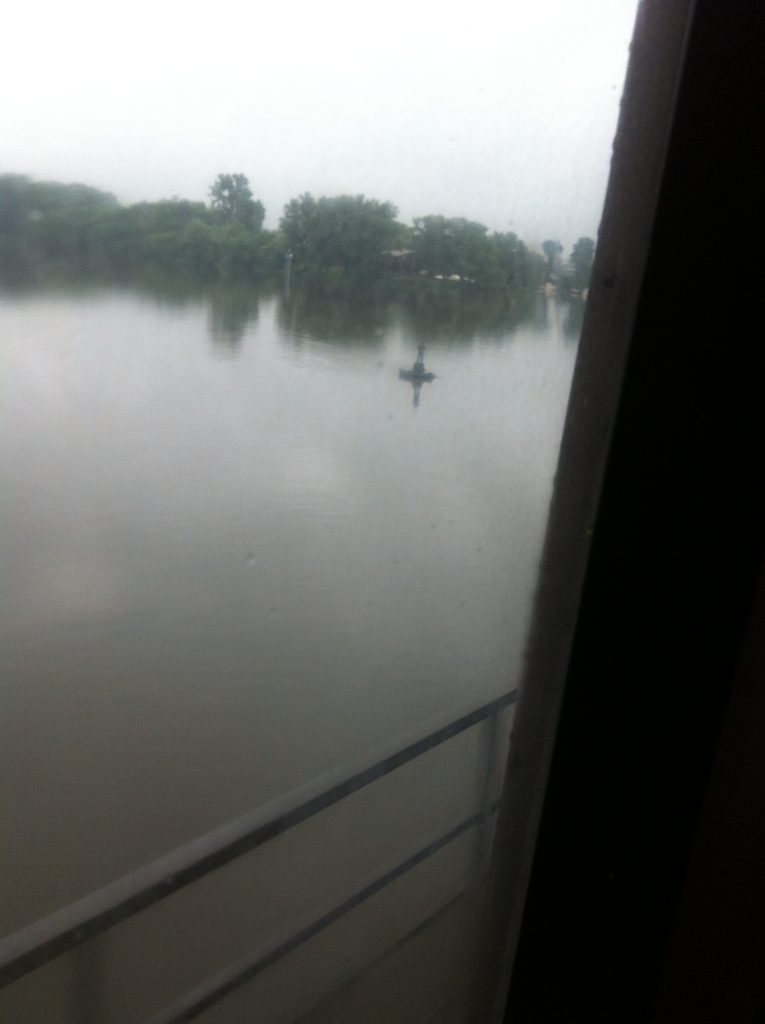
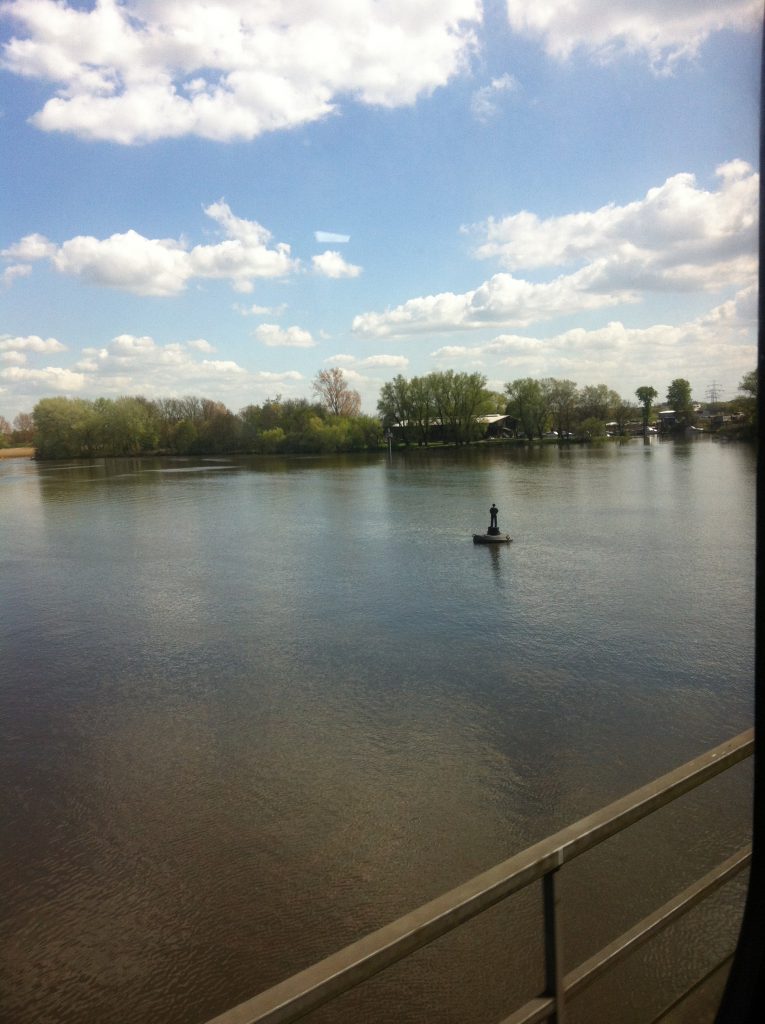
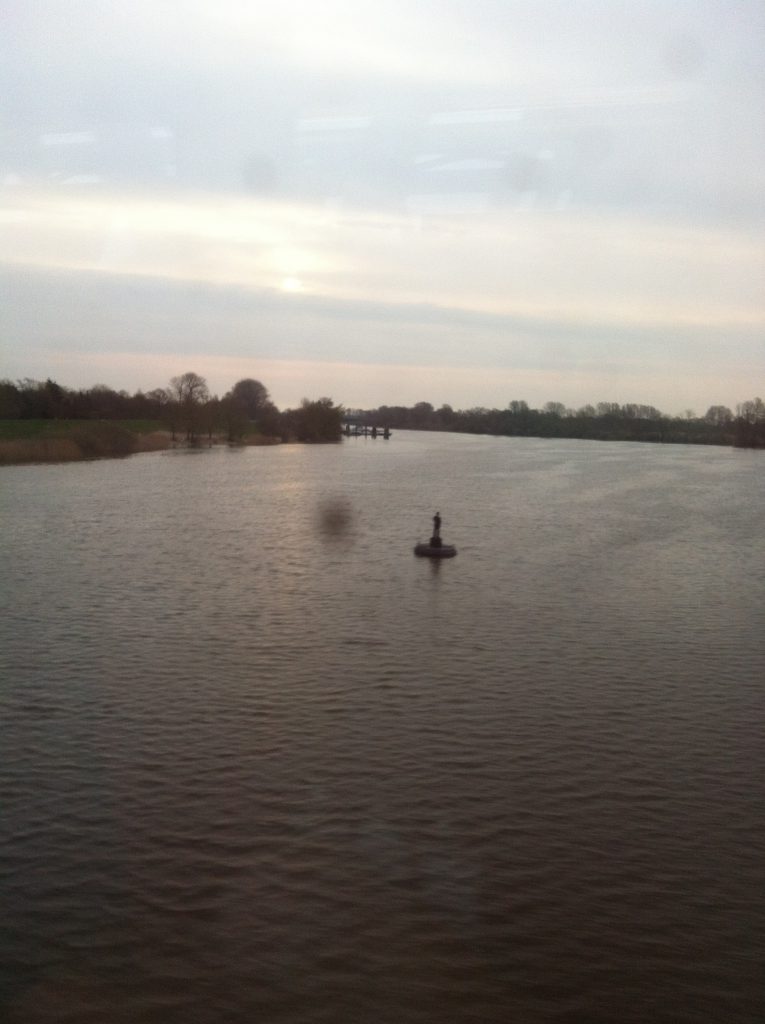
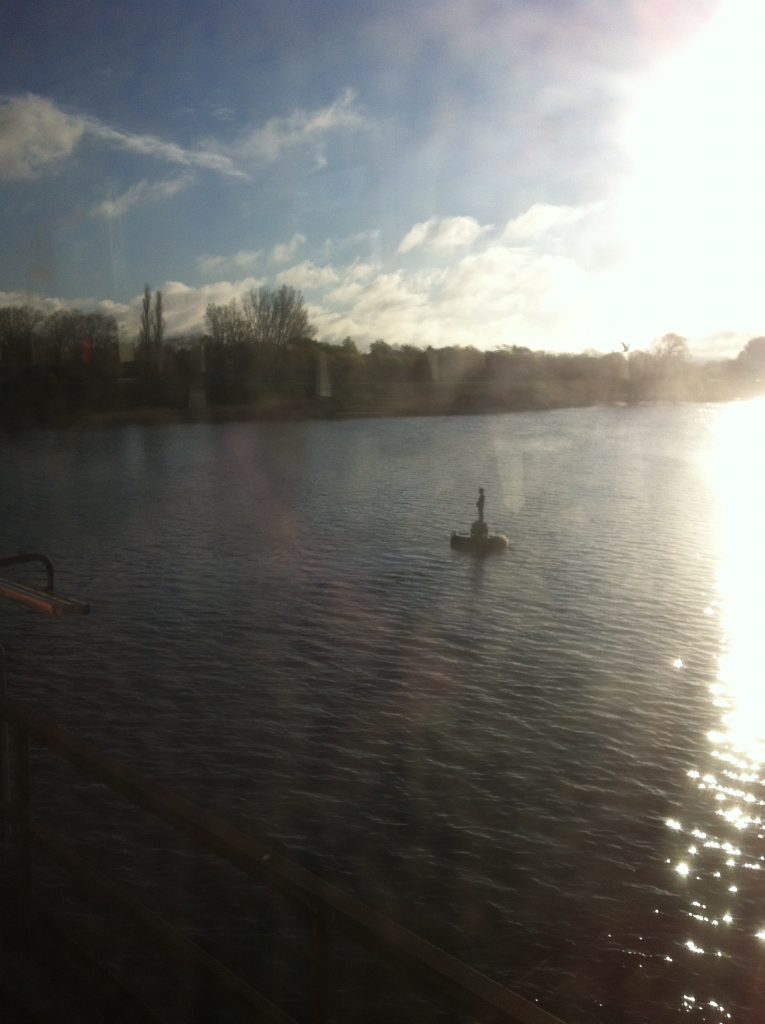
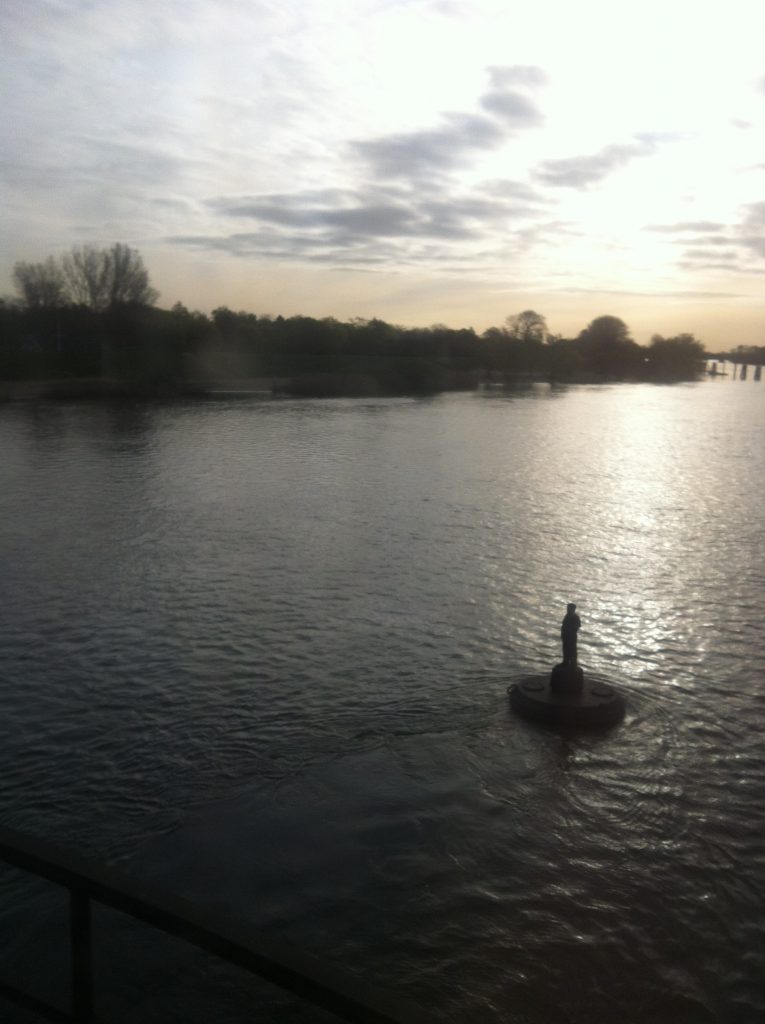
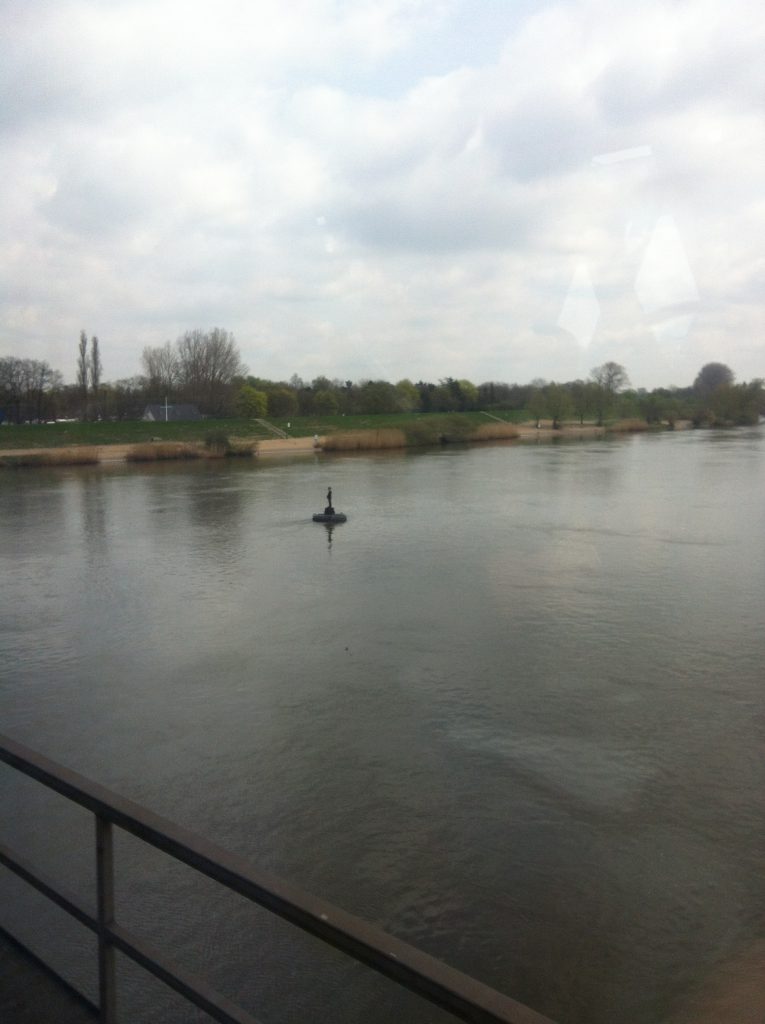
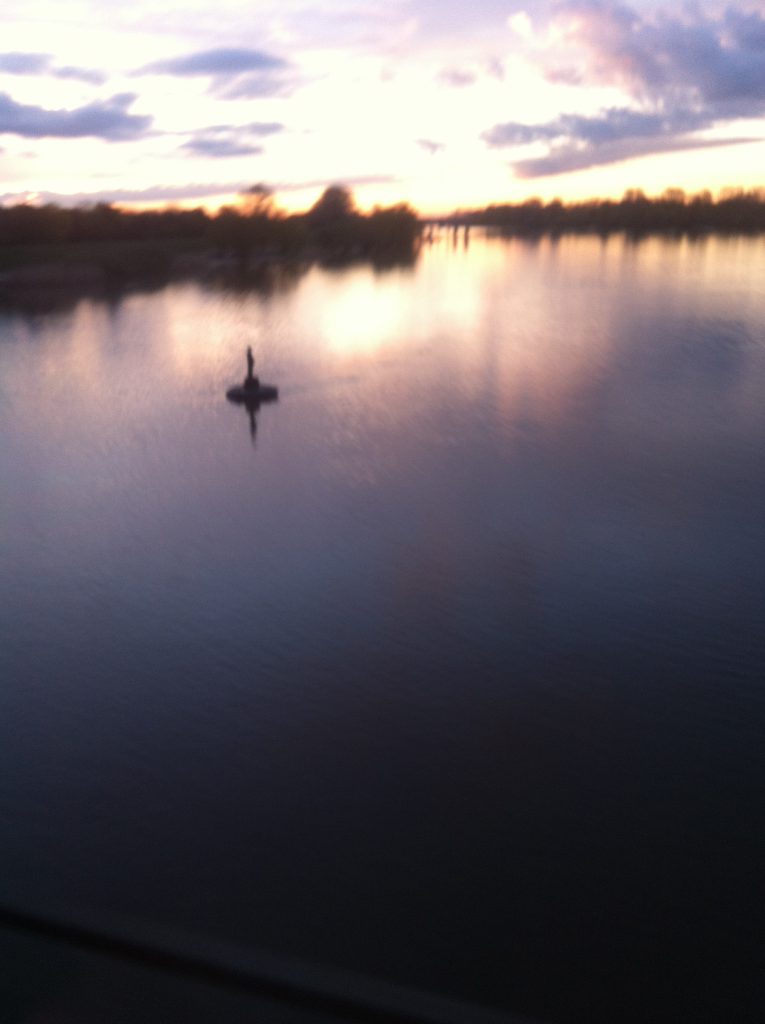
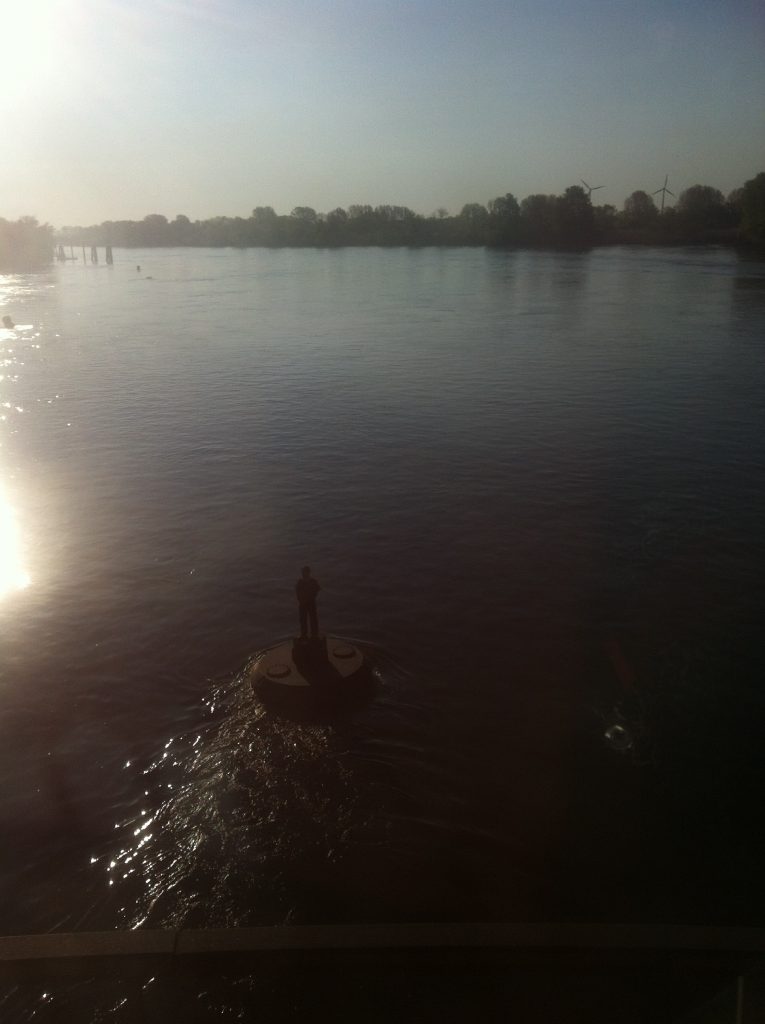
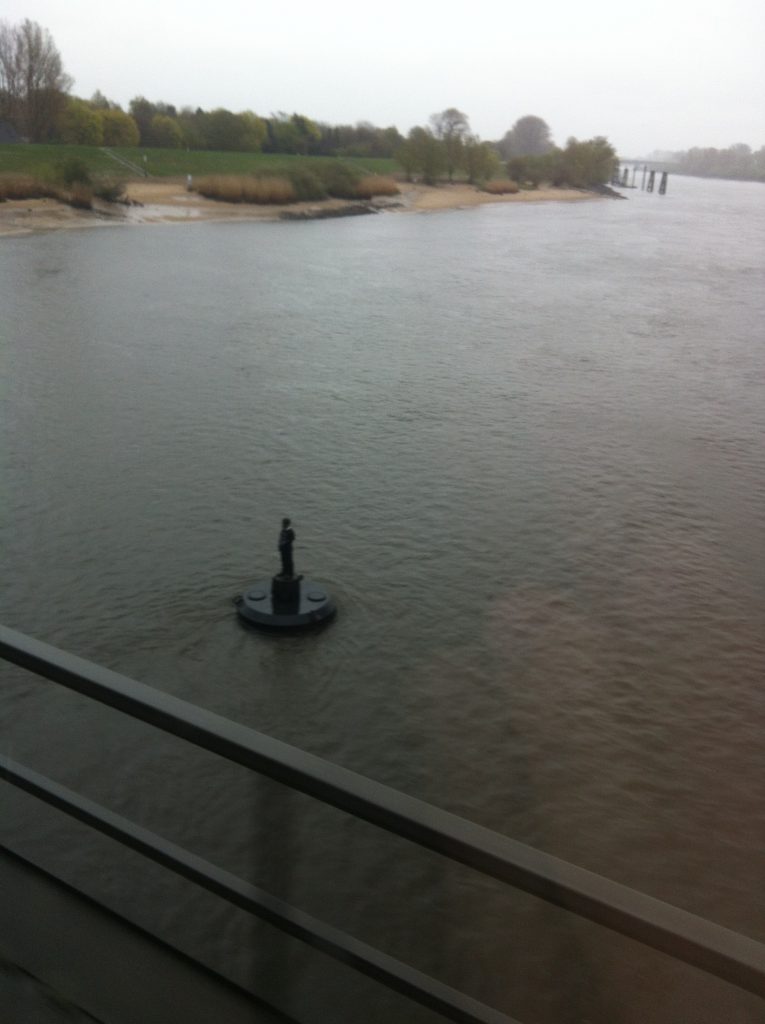
And here are all 16 pictures, in the order going from low water to high water to low water. The caption includes the time before/after high water. Enjoy!
*Btw, sometimes you see that my mapping is clearly not right (for example, when the wake is in the direction away from the viewer, we cannot be past high water already, since the current is clearly still going up the river, so the tide hasn’t turned yet). These errors might be due to me not taking enough care when looking up the tidal data (yep.) or the tide tables that were used not accounting for factors that might have influenced the tides other than the classical tidal components, like for example wind conditions. I could, of course, go back and look at actual data and/or double-check, but I am happy with what I can see from the data already. If you are not, please knock yourself out and I’d be happy to host your guest post with corrections of my post! :-)
"Excursion week" in Oceanography 101 while physically distancing - Adventures in Oceanography and Teaching says:
[…] tasks can be very specific (“find examples of hydraulic jumps“, “observe tidal flows in a river by watching moored structures move“) or not so specific (“pick a topic related to our class and find a way to observe […]
#BergenWaveWatching: observing the tides from a bus – Elin Darelius & Team says:
[…] (thanks to the phone’s time stamp on the pictures) to time before/after high water as I did in this post for tides on the Elbe river in Germany. This of course doesn’t account for the spring/neap […]
Using #WaveWatching and #KitchenOceanography to prepare students for a one-day research cruise - Adventures in Oceanography and Teaching says:
[…] useful exercise to try and collect data on a phenomenon without any proper equipment. For example, a tidal current can be related to the position of buoys within it, or the tidal elevations can be estimated by repeatedly taking pictures of the same pylon of a […]