What #wavewatching means to me. My presentation at #sipmanc

Did you miss my talk at the Science in Public conference in Manchester? Well, you are in luck — here it is!

Three years ago, I visited my sister and her then four month old daughter. We spent an evening on the shores of the german river “Schlei”, close to their home. It was a beautiful day — sunny but with some clouds that brought visual interest to the sky — and we were looking at the water and taking pictures. We stood for quite some time in silence, each of us lost in thought, looking out over the river.

My sister and my goddaughter that fateful evening in May 2016

Later that evening, I wrote a blog post about what I had seen [link to that original blogpost!].

The next morning, my sister came into my room, her phone with my blogpost still open in her hand, and asked in a very surprised voice “This is what you saw last night, when I was standing right next to you??? I just watched the sun sparkle on the water!”

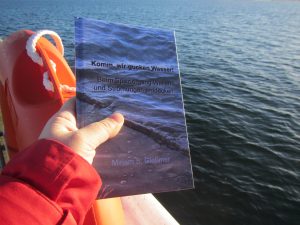
I really enjoy watching the sun sparkle on water, too, but nevertheless: That was when I decided that my four-month old niece — or any other child, for that matter — should not grow up deprived of seeing what I saw that evening, in addition, obviously, to what my sister saw. Therefore, I wrote a book as a gift to my niece to her baptism one months after that day, and just like that, #wavewatching was born.

Wave watching, to me, is so much more than just “watching waves”. Wave watching is how I want to live my life, and how I want everybody to approach theirs. Wave watching means a certain way of looking at the world around us.

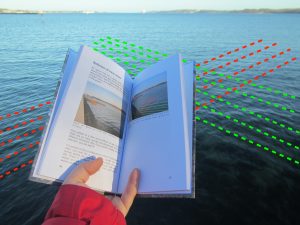
Here is a picture I took that evening. When you look at that picture, what is it that you notice? The colorful clouds, their reflection on the water?

What I notice, and what I want people to notice, is that the waves look very different in different areas of the water.

On the right side, wave crests are more or less straight. That’s where the wind has had a wide and long area over which it has been blowing over the water, a long fetch, creating these waves and driving them down the river. At least until they can’t continue on because there suddenly is a wave breaker in their way.

But if you look here in the foreground, there are waves downwind of the wave breaker, in it’s lee, filling the space behind it. But the waves are not straight any more, they are now curvy.

If we look at a spot on the water slightly to the left of the picture above, what will we see? Keep in mind what the waves, propagating to the left, look like where they hit the shore:

This is what the water looks like just slightly to the left of the picture I showed before.

Here we have the same wave crests that were propagating out of the previous frame:

But what we also see is a second set of wave crests at an angle to the first one:

And those are the kinds of things I want you to notice.

I want you to look around, to observe pattern and where pattern break down. And I want you to think about whether you can explain those pattern, and what could help you find explanations.

Quick side note for those of you who have been wondering what exactly is going on here, just to give you some piece of mind: What you saw in the first picture you are probably familiar with from physics classes: It’s a wave showing diffraction at a slit.

Except that in this case, we have a very wide slit and therefore the situation is a little more complicated than in your physics text book.

And in the second picture, we saw very simple reflection, which you are probably again very familiar with.

Only that here we have multiple waves being reflected simultaneously.

But I did not show you this to talk to you about physics today. I am showing you this because this is where I see my place in science communication — in showing people the world the way I see it, but way beyond that: in helping them see the world with different eyes, and in challenging them to do so. And it’s not important whether people observe waves or anything else specific, it’s the general approach to the world that I find so important.

I am sure that next time you look at water — be it when walking around puddles on the side walk, or when looking at water going down the drain when washing your hands — you will look at water differently, and you will notice waves in a way you have not done before. And you will think about why there are these waves, why they look that way, and you will — whether you want it or not — be thinking about physics. And I hope that you will be wave watching with as much awe and wonder, curiosity and joy as me, my goddaughter and her younger sister do!

Me, my goddaughter and her younger sister in June 2019

If you are curious about the other two hashtags I had in the original title of my talk, just check out the hashtags on twitter; I put up posts on my blog (on #kitchenoceanography and #dropphotography). Or come and talk to me, or shoot me a message!

AND WHAT I FORGOT? TO PLUG #FRIENDLYWAVES! #friendlywaves is the hashtag people can use to send me pictures of waves that they took, and I will try to explain what’s going on on their pictures. So send me all your wave pictures and I will do my best! :-)

Edit on July 13th: Thank you everybody for you amazing comments about my presentation on Twitter and in person. It feels truly heart-warming to look through all of this! I arrived knowing only one person but left with many new friends. Thank you! (Collected tweets here)

Some #wavewatching in Manchester

I’m in Manchester for Science in Public 2019 and I couldn’t help myself, I had to do some wave watching.

To be fair, though: These pictures really don’t do Manchester justice as a city. It is such an amazing city! Last time I was here, I spent a whole day exploring four historical libraries that were breathtakingly beautiful, and I would totally recommend you do the same if you are here, even before wave watching. And that is saying something! And I love all the architecture here, and the Science and Industry Museum! But my blog is about Adventures in Oceanography and Teaching, so I am not showing you that side of the city here, only the river Irwell and some reflections of buildings in it.

First: A storm drain run-off into the river. Do you see the waves radiating away from where the water drips into the river?

And here is a “before” picture of the river…

…so you appreciate the “after” picture with all the cute little waves made by raindrops. (No irony here — I really enjoyed watching this!)

And it does look pretty, doesn’t it? I especially like the wave rings on the boundary between the dark reflections of the buildings and trees, and the brighter reflection of the sky, blurring the line, bringing the sky and the city together…

Oh, and one of my favourite wave pattern: The V-shaped wake of a row boat and the pairs of eddies, rotating in opposite directions, where the oars pushed through the water!

Funded! “Ocean currents in a tank: from dry theory to juicy reality”

Remember how Joke, Torge and I were working on building an affordable, home-made rotating tank to use in ocean dynamics teaching only last weekend? That session was inspired by a proposal that Torge submitted a while back, and which now got funded by PerLe, Kiel University’s project for successful teaching and learning (German abstract here). This is really exciting, it not only gives us official permission to play (well, someone will have to build the rotating tables and test the experiments, right?), it will also fund the collaboration and materials. Exciting!

We are planning to add hands-on experiments to the Bachelor-level “atmosphere and ocean dynamics” course at GEOMAR over the next year, but since there is no rotating table available, we want to build several (!) so several student groups can work on them at the same time. And you know me — what we do there will be documented and shared online not only by myself, but also by the students. So stay tuned, I see a lot of rotating tank experiments in our future! :-)

This is the kind of stuff we are going for (picture below shows old Hadley cell experiments from 2014)… Not quite there yet, but we will get there!

What’s #kitchenoceanography all about?

Preparing my talk at the Science in Public conference in Manchester

A definition of kitchen oceanography

/ˈkɪtʃɪn ˌəʊʃəˈnɒɡrəfi/
noun

Kitchen oceanography is where my blog “Adventures in oceanography and teaching” — and my passion for science communication! — started. Here are definitions of the two most common meanings.

1. Experiments on processes related to the ocean that can be done using only household items.

Kitchen oceanography is an extremely useful type of experiments on oceanographic processes: those that can be done using exclusively equipment that can be found in most kitchens, that is thus readily available at any time and any place, cheap to purchase or replace, as well as easily transportable to use for example in (primary!) school lessons, university classesconference presentations, workshops, or skiing cabins.

Kitchen oceanography is the ultimate answer to any claim that experiments are just too much of a hassle to run or show in any kind of setting.

IMG_9084

Typical kitchen oceanography equipment includes plastic cups or glasses as vessels to hold the experiment, tap water of which the density is modified using table salt or different temperatures, ice cubes to provide cooling or very cold fresh water, food dyes to act as tracers to visualize flow pattern, straws used as pipettes.

Processes that can be shown using kitchen oceanography experiments include density driven currents, overturning circulation, double-diffusive mixing, vortex streets, properties of freshwater and saltwater ice, effects of density on stratification, effects of pressure on solubility, and many more.

If a wider definition of kitchen oceanography is used to include household items commonly stored outside of the kitchen, yet inside the house, hairdryers, bike pumps etc lead to many more possible experiments.

See all blogposts fitting this definition of kitchen oceanography here.

Using only luke-warm, hot, and cold water, and two different food dyes and you can create this!

2. Observing oceanographic processes in, or during the preparation of, food and drinks.

In its stricter definition, kitchen oceanography is almost even more fun: now it’s oceanographic processes that can be observed accidentally in your kitchen or your foods and drinks anywhere.

Observing mixing of cream and tea — notice the vortex rings?

Typical processes that can be observed in this kind of kitchen oceanography include processes related to ocean circulation, density stratification, mixing of fluids, salinity of sea water, ice formation, but also visualize methods like e.g. ice coring.

Kitchen oceanography is the ultimate answer to anybody who thought bringing you away from your lab might make you stop talking about oceanography.

See all blogposts fitting this stricter definition of kitchen oceanography here.

Observing layers in a latte can teach you so much about double-diffusive mixing processes in the ocean! And as you see in the picture, this is not a laboratory setting and most people would probably assume that they would be safe from oceanography talk here :-)

An art & science collaboration with Wlodek Brühl: #dropphotography

If you are here because you saw my title or talk at the Science in Public conference in Manchester and are curious about #dropphotography as a form of art&science collaboration in scicomm — a special welcome to you! If you are here for any other reason — welcome anyway! :-)

One of my favourite pet projects right now is the #scicomm collaboration with the artist Wlodek Brühl.

The idea behing the collaboration is very simple: Wlodek does awesome drop photography like what he showed in his recent exhibition, or the picture below: Drops falling into water, creating sculptures that he captures with digital photography.

I, on the other hand, use the opportunity of having people fascinated and mesmerised by this art, and curious to learn more about it, to talk about — what else? — physics! :-)

For one example of what that collaboration looks like in practice, check out my speech at the opening of his latest exhibition. We have a workshop coming up this autumn that we will run together, as well as other exciting projects which are, unfortunately, still secret. It’s going to be awesome, though!

But back to physics: Creating the exact sculpture you want requires enormous precision. This is what the setup looks like: Reservoirs above a vessel in which the drops fall. And a complex setup of flashlights and a digital camera, all coordinated by a custom-made piece of software.

The most important thing influencing the momentum with which a drop hits the water below is the height it falls from. Below, pictures are taking at constant intervals after drop release, yet you see that the for each new picture, the drop fell a little further than it did in the previous interval — it fell a little faster due to acceleration of gravity. Thus the longer you let a drop fall (i.e. the higher the drop falls from), the more it will accelerate, bringing more energy into producing a fountain.

The next thing that needs to be very precisely controlled are the opening times of the valves that release the drops. Not only when they open, but also for how long. Consider opening times of the valves in the picture below, left to right: 50, 55, 60, 70  milliseconds (The series of pictures on the left you know already from the “acceleration of gravity” pic above).

Depending on how long the valve is opened, different volumes of water are released, forming different drops. Easy to imagine that this will lead to different fountains once the drops hit the water below!

So what happens exactly once the drop hits water? The water surface gets deformed as the drop pulls it downwards. Due to surface tension, it then bounces back up, bringing up a column of water, that then collapses back down. And all these disturbances radiate ripples away from the original point of impact — capillary waves! (Capillary waves are super interesting because they behave very differently from “normal” gravity waves, but that’s a topic for a different post!)

But so that’s how fascinating it is to watch just one drop falling into water. Now imagine several drops falling one after the other, such that a second or third drop hits the column rising up after the first drop already hit the surface? That’s what makes these interesting umbrella shapes:

As you can imagine, there are tons of parameters you could vary now. Not only fall height and drop size, time lag between drops, number of drops that fall, but also viscosity of the fluid, shape of the bowl the drops fall into, all kinds of things. And that’s only using the easiest setup! You could also imagine using several valves, or air pressure to shoot drops with more momentum, or even have water shooting up from below (all of which Wlodek has done!).

And then, of course, depending on when exactly you choose to take a picture of the sculpture, you will see it in very different stages of formation and decay. You see the attempt of surface tension to minimise disturbances, instabilities that still form along the rim of the umbrellas which ultimately burst into many different small droplets…

Do you see the potential to talk about physics pretty much forever here? I love it! :-)

Working on our own affordable rotating table for oceanographic experiments!

Inspired by the article “Affordable Rotating Fluid Demonstrations for Geoscience Education: the DIYnamics Project” by the Hill et al. (2018), Joke, Torge and I have been wanting to build an affordable rotating table for teaching for a while now. On Saturday, we met up again to work on the project.

This post is mainly to document for ourselves where we are at and what else needs to happen to get the experiments working.

New this time: New rotating tables, aka Lazy Susans. After the one I’ve had in my kitchen was slightly too off-center to run smoothly, we bought the ones recommended by the DIYnamics project. And they work a lot better! To center our tank on the rotating table and keep it safely in place, we used these nifty LEGO and LEGO Duplo contraptions, which worked perfectly.

We also used a LEGO contraption to get the wheel close enough to drive the rotating table. The yellow line below shows where the rim of the rotating table’s foot needs to sit.

And this is how the engine has to be placed to drive the rotating table.

First attempt: Yes! Very nice parabolic surface! Very cool to see time and time again!

Now first attempt at a Hadley cell experiment: A jar with blue ice is placed at the center of the tank. Difficulties here: Cooling sets in right away, before the rotating tank has reached solid body rotation. That might potentially mess up everything (we don’t know).

So. Next attempt: Use a jar (weighted down with stones so it doesn’t float up) until the tank has reached solid body rotation, then add blue ice water

Working better, even though the green dye is completely invisible…

We didn’t measure rotation, nor did we calculate what kind of regime we were expecting, so the best result we got was “The Heart” (see below) — possibly eddying regime with wavenumber 3?

Here is what we learned for next time:

  • use better dye tracers and make sure their density isn’t too far off the water in the tank
  • use white  LEGO bricks to hold the tank in place (so they don’t make you dizzy watching the tank)
  • measure the rotation rate and calculate what kind of regime we expect to see — overturning or eddying, and at which wave number (or, even better, the other way round: decide what we want to see and calculate how to set the parameters in order to see it)
  • use white cylinder in the middle so as to not distract from the circulation we want to see; weigh the cylinder down empty and fill it with ice water when the tank has reached solid body rotation
  • give the circulation a little more time to develop between adding the cold water at the center and putting in dyes (at least 10 minutes)
  • it might actually be worth reading the DIYnamics team’s instruction again, and to buy exactly what they recommend. That might save us a lot of time ;-)

But: As always this was fun! :-)

P.S.: Even though this is happening in a kitchen, I don’t think this deserves the hashtag #kitchenoceanography — the equipment we are using here is already too specialized to be available in “most” kitchens. Or what would you say?

Opening speech for Wlodek Brühl’s art

You might remember that I had the honour of giving a speech at the opening of Wlodek Brühl’s art exhibition back in spring. Preparing my presentation for the Science in Public conference in Manchester next week (that I am immensely looking forward to!), I noticed I never posted the speech. Below is what I sent Wlodek in advance to prepare him for what I might say:

Lieber Wlodek, sehr geehrte Damen und Herren,

es ist mir eine große Ehre, die einleitenden Worte auf dieser Vernissage, dieser Eröffnung der Ausstellung von Werken Wlodek Brühls, zu sprechen und Sie hier Willkommen zu heißen.

Obwohl genau das die Wortbedeutung von „Laudatio“ist, ist mir ausdrücklich untersagt worden, den Künstler zu loben – vom Künstler selbst. Also werde ich heute lieber über Physik sprechen. Wenn Sie die Bilder von Herrn Brühl betrachten, denken Sie dann nicht auch sofort und unausweichlich über Physik nach?

Springbrunnen kennen wir zu Genüge, in Pfützen fallende Tropfen auch. Und letztendlich sehen wir hier genau das, wenn auch mit etwas mehr technischem Aufwand umgesetzt, um die entstehende Skulptur ganz genau beeinflussen zu können. Deshalb kommen uns die in diesen Fotografien gezeigten Formen seltsam vertraut vor – richtig gesehen haben wir sie aber noch nie. Auch wenn genau solche Strukturen um uns herum existieren (und dabei ist anzumerken, dass jede dieser Skulpturen einzigartig ist, wie auch keine Schneeflocke exakt einer anderen gleicht), mit bloßem Auge können wir sie nicht erkennen, weil sie nur für Bruchteile von Sekunden bestehen und unser Gehirn schlicht zu langsam dafür ist. Solche Skulpturen trotzdem bildlich festzuhalten gelingt mit vielen technischen Tricks: Mit computergesteuerten Ventilen, die Tropfen so auslösen, dass sie genau mit anderen Ventilen, dem Blitzlicht zur Beleuchtung und dem Auslöser der Kamera abgestimmt sind. Sichtbar werden dann Skulpturen und nicht nur verwischtes Wasser, weil die Skulpturen in einem stockdunklen Raum für ein Bruchteil einer Sekunde von einem Blitz beleuchtet werden, so dass trotz der längeren Belichtungszeiten der Kamera auf dem Bild nur dieser eine, enorm kurze Moment sichtbar wird, in dem es – exakt zum richtigen Augenblick – geblitzt hat.

Aber kommen wir zur Physik. Wenn Sie diese Ausstellung bei – aus physikalischer Sicht – einfacheren Bildern anfangen und sich dann langsam steigern möchten, würde ich empfehlen, in diesem Raum zu beginnen.

My picture of art by Wlodek Brühl, taken and published with kind permission.

Hier drängt sich mir zum Beispiel die Frage auf, warum die Skulpturen von unten aus dem Wasser nach oben zu wachsen scheinen, bevor sie sich ausbreiten, verzweigen? Der Schlüssel hier ist die Oberflächenspannung des Wassers. Die Wasseroberfläche, durch einen fallenden Tropfen nach unten ausgelenkt, schleudert den Tropfen wie ein Trampolin wieder nach oben und wölbt sich selbst hinterher, bäumt sich auf, bevor sie wieder in sich zusammen fällt. In einigen der Bildern kann man diesen nach oben geschleuderten Tropfen sogar noch erkennen.

My picture of art by Wlodek Brühl, taken and published with kind permission.

Und dann sehen wir im oberen Teil vieler der Skulpturen Formen, die wie Schirme oder Leselampen aussehen, oder wie Vasen. Warum sind diese Strukturen manchmal nach oben geöffnet, manchmal nach unten, manchmal voller filigraner kleiner Ärmchen am Rand? Das sind eigentlich schon zwei Fragen in einer. Die Form der Kelche hängt davon ab, wie schnell sich zwei Tropfen aufeinander zu bewegen und ob ein großer auf einen kleinen trifft oder umgekehrt. Die kleinen Ärmchen sind Instabilitäten, die entstehen, kurz bevor der Schirm zerfällt. Schirme ohne Ärmchen sind also genau in dem Moment belichtet und eingefangen worden, als noch alles stabil war. Bruchteile von Sekunden später wären auch sie instabil geworden.

My picture of art by Wlodek Brühl, taken and published with kind permission.

Und wenn Sie mit diesem Blick durch diese Ausstellung gehen, werden Ihnen noch viele andere Fragen kommen. Manchmal, zum Beispiel, sehen wir Skulpturen, die auf zwei Säulen zu ruhen scheinen. Wie sind diese wohl entstanden? Und dann sind die Skulpturen farbig – und die Farben sind direkt in der Aufnahme entstanden und nicht nachträglich digital eingefärbt. Das wurde in diesem Raum durch farbige Blitze gemacht, in den anderen beiden Räumen durch eingefärbtes Wasser.

My picture of art by Wlodek Brühl, taken and published with kind permission.

Wenn Sie als nächstes dann in den Raum dort hinten weitergehen, sehen Sie Skulpturen, die an der Wasseroberfläche gespiegelt sind. Durch die Spiegelung hat man auf ein mal zwei unterschiedliche Perspektiven auf die Skulptur und kann jetzt Strukturen noch genauer beobachten, um über sie nachzudenken.

My picture of art by Wlodek Brühl, taken and published with kind permission.

Im dritten Raum sehen Sie die neuesten Kunstwerke von Herrn Brühl, die vor wenigen Wochen erst entstanden sind. Hier wird die Physik noch komplexer. Zusätzlich zu all dem, was ich gerade schon über fallende Tropfen erzählt habe, kommen hier noch mit Druckluft angetriebene Fontänen hinzu. Und zwar einfache, die in der Mitte der Skulptur gerade nach oben schießen, und dann auch solche, die aus einer sich drehenden Turbine nach oben und außen geschleudert werden, erst einen Kelch bilden und dann in einzelne Tentakel zerfallen. Und in diesen Bildern sieht man manchmal auch die Schlieren und Pigmente der verwendeten Farben!

Wenn man wollte, könnte man an jedem einzelnen Kunstwerk stundenlang beobachten, grübeln und diskutieren. Wie sähe eine Skulptur wohl aus, wenn ein Tropfen größer gewesen wäre als er war, oder etwas später gefallen, oder vielleicht aus einer anderen Höhe? Oder wenn das Bild Sekundenbruchteile eher oder später gemacht worden wäre und uns damit einen anderen Zeitpunkt der Entwicklung und des Zerfalls der Skulptur gezeigt hätte? Was, wenn anstelle von Wasser zum Beispiel mit Honig gearbeitet würde? An Ihren Gesichtern sehe ich, dass diese Fragen Sie schon jetzt faszinieren. Das ist genau die Physik, die ich speziell bei den Tropfenskulpturen von Herrn Brühl so fesselnd und aufregende finde!

Ich wünsche Ihnen viel Spaß in dieser Ausstellung – dass Sie die beeindruckende Kunst von Herrn Brühl als Kunst genießen können, aber dass Sie sich vielleicht an manchen Stellen auch fragen, wie genau er es wohl geschafft hat, solch ein Meisterwerk entstehen zu lassen. Ich bin mir sicher, dass Herr Brühl Ihnen gerne Rede und Antwort stehen wird! In diesem Sinne: Herzlich Willkommen!

Some #friendlywaves from Berlin

My friend Alice is currently in Berlin, and as one does when visiting Germany’s capital city: She’s wave watching!

I can only say: I approve! That’s what I always do there, too (exhibit 1, exhibit 2).

And knowing that I always like the challenge, she sent me a #friendlywaves picture. Meaning a picture of waves that she would like me to explain.

We aim to please… So here we go! (gif of the original Insta story above, individual pictures for easier viewing below)

Clearly this was done as an Instagram story and not designed to be posted on my blog, and I am not quite sure if it works. Please let me now what you think!

Melting ice cubes experiment published in kids’ journal Frontiers Young Minds

On publishing in a journal peer-reviewed by kids, and suggesting it as a first journal new PhD students should be asked to write for

You guys might remember my favourite experiment with the ice cubes melting in freshwater and saltwater. This experiment can be used for almost any teaching purpose (Introduction to experimenting? Check! Thermohaline circulation? Check! Lab safety? Check! Scientific process? Check! And the list goes on and on…) and for any audience (necessary observation skills start a taking the time it takes ice cubes to melt in the easiest case, to observing the finest details of the melt). In short, I love this experiment!

A different format of science communication

After using it in all kinds of settings for years, I wrote up the experiment for Frontiers Young Minds, a journal which is written for, and peer-reviewed by, kids (link to my article). I love the idea of not only tailoring your science communication to the audience of young readers, but making sure that it actually works well for them by including them in the process. Additionally, the peer-reviewers get a great insight into how a publishing process (and thus an important step in science) works, too.

The whole peer-review and publication process was a really positive experience. Speciality chief editor for “Earth and its resources“, Mark Brandon, and the whole team were super responsive and helpful all the way from initial article idea until publication.

Writing for and being peer-reviewed by young readers

Having my writing peer-reviewed by the “young readers” was super interesting. For example, on one of my articles, they commented on how, as kids growing up in the US, they were not familiar with metric units and could I please give them units they could actually relate to? This is an issue I should probably have been aware of, but I totally wasn’t.

Another example from the other article: a different young reader commented that English was their second language, and could I replace difficult words like “puddle” and “dye” with easier words. As a non-native English speaker myself, this feedback was super helpful — I thought that I was writing in an easy language already, but clearly my perception of “easy language” has drifted into specialized vocabulary — super valuable feedback!

And then both teams reviewing both my articles had a science mentor helping them, and also commenting him/herself on the article and how the review process with the kids went and suggesting further edits, that would make it easier for kids to work with the article.

Illustration by Jessie Miller for Frontiers Young Minds, used with permission

And then, of course, there are Jessie Miller‘s super cute illustrations! After seeing what she did for my first article, I couldn’t wait to see what would happen for this one, and I am super excited about another illustration that makes me feel completely understood and seen.

Writing your first ever article for FYM?

So all in all, publishing with FYM is something I would totally recommend to anyone. And I would even go so far as to recommend it as the first article that PhD students should be asked to write. Why?

  • Articles for FYM can be written on “core concepts”, which can mean basically writing a literature review on the topic you are about to write a PhD thesis on, and one that is broken down so far that you will really have to have understood things. There is this saying attributed to basically all science educators in one form or another, that only if you can explain your topic to a child, do you actually understand it yourself. So explaining to children is actually a super helpful step in the process of getting into a topic yourself.
  • Writing something that is designed to be understood by a wide variety of audiences is really useful for another reason, too: to give to all your family and friends as an easy insight into what it is you are spending all your time on.
  • The feedback you get on how you talk about your topic will be helpful for all future communications about it; Practicing scicomm as early as possible is always a good idea :-)
  • Having a really positive publishing experience is a great start into a PhD, because surely other kinds of experiences will follow sooner or later. The submission through the uploads and forms and stuff works the same way for FYM as for all other journals (including the “oh crap, they want the images in a different format than I prepared them in! Let’s google how to convert them”, “Really? They need an abstract? Maybe I should have read the instructions more carefully…”, or “They are really counting the words on the submission! So now I need to cut an extra paragraph that I thought I could get away with…” surprises that are typical for the “Let me quickly submit this article and go for lunch! Oh wait, half a day later and I am still nowhere near the end of the process” experience that is so common when submitting articles. At the same time, the stakes feel a little lower for this kind of article, since as an early PhD student, you are writing about other people’s work, not yet your own (at least when writing a core concept article, there is also the “cutting edge research” article type, in which you are writing about some newly published article of yours). And then, as I described above, the whole process is really positive and friendly and supportive throughout, even though all the steps are the same as for any other journal (Waiting for the editor to send the article out to the reviewers. Seeing that stuff is waiting on a desk somewhere and compulsively checking every day whether it has been moved on and the email notification just didn’t make it through. Replying to a reviewer. That kind of things). So I believe that it’s a really good way to be introduced to the publishing process without being pushed into super cold water right away, building up confidence for later submissions of your own work.
  • FYM announces new articles on their social media (with lovely tweets!), which have a fairly wide reach, well above what most of us have, and that’s a great opportunity to be seen as authority on a topic by a large number of potentially interested people. Great opportunity to expand your network!
  • And, as I said before, I just love the illustrations and I would imagine that having something like this when you start working on a new topic would be super exciting and motivating :-)

What do you think? Will you suggest writing a FYM article to all your new PhD students now?

P.S.: Here are the links to my FYM articles again: “How does ice form in the sea?” and “When Water Swims in Water, Will it Float, or Will it Sink? Or: What Drives Currents in the Ocean?“.

Experimenting with Insta stories for my wave watching scicomm

Inspired by the absolutely brilliant job that Kati is doing for my project GEO-Tag der Natur, I have recently started experimenting with “Insta stories” on the topic of wave watching.

Insta stories, for those who aren’t familiar with them, are a special type of post on Instagram that only stays visible for 24 hours (unless you save them as highlight, in which case they can be watched until you decide to delete them). They are usually used to give quick glimpses into what’s going on that day, and can be anything from random snap- or screen shots to elaborate stories. The latter is what Kati has been doing for GEO-Tag der Natur — she tells cute and engaging short stories about different topics, using photos and video clips, which she combines with fun gifs to make them even cuter (if you have an Instagram account you can watch them in the highlights of our account).

So that’s what I have been trying to do, too.

My first attempt is posted below — except that what I post below doesn’t contain the links and gifs and stuff, because it turns out that while you can export stories from Instagram, I couldn’t convert them into a format that my blog or vimeo would accept and still keep the gimmicks (original version here). But I still like the format of telling a story. What do you think?

https://vimeo.com/341862851

The feedback I got on that story was super positive, so I decided to do it again.

Since my second Insta story contained so many cute gimmicks, I didn’t even attempt to export it, but wrote a separate blog post using the same videos and pictures (But you can watch the story — including the cute gimmicks! — here).

(And then, when writing this blog post, I realized that if I did a screencast, I could that then convert into something my blog accepts. Duh! So below you can watch my story the way I see it when logged into my account — including how many people watched it and all the buttons that I could click to edit and exit etc.. In the future I should probably just do the screencast from a different account to give you a cleaner view…)

By this point, it started bugging me that I was putting effort into Insta stories but that I didn’t have a good way to use them on my own blog (remember, I hadn’t come up with the screencast idea yet). I like having full control over hosting the stuff I don’t want to disappear, and I don’t like telling the same story twice for different platforms (although I realize that customizing stories for each platform and thus audience is always good advice).

So the next story didn’t use fancy gimmicks (except on the last slide), and I could export the pictures and combine them into the .gif you see below.

Mmmmh, I like that!

Except now I am thinking I should still do an English gif for my blog and keep the German one to my Instagram. Which, again, feels like a lot of work for something that I want to do in random pockets of time like on my commute, not as a real task. So my next story was a language-free one:

So in the end it turns out that classical gifs work quite well for transporting my stories. Not nearly as cute as they could be, but maybe that’s ok?

What do you think? What style of Insta story would you like to see more of?

Option A: Give me cute little gimmicks like ducks on surfboards and ladies jumping into pools!

Option B: GIFs work well and I don’t need all the cutesy gimmicks

Option C: Other. Please elaborate! :-)