Tag Archives: temperature

Modeling the Denmark Strait Overflow

Ha, this is a bad pun. We are modeling the Denmark Strait Overflow – but in a non-numerical, small-scale-and-playdough kind of way.

More than a year ago, Kjetil and I ran that experiment with a group of high-school students and when writing a post about a much more sophisticated version of this experiment I realized I never documented this one in the first place. So here we go!

IMG_3604_small

The set-up: Tupper ware with a modeling clay ridge (“let’s call it Greenland-Scotland-Ridge”) across, filled with water to a level above the ridge, cooled with a sport’s-injury cooling pack in “the North”.

Dye is added to the “northern end” of the tank (i.e. the end where the water is being cooled by a sport’s injury cooling pack). As the water cools, it becomes denser and fills up the reservoir on the northern end until it spills over the clay ridge.

IMG_3592_small

The overflow. See the blue, dense reservoir on the left and the dense water spilling over the ridge.

This is a very simple demonstration of how overflows actually work.

IMG_3607_small

Kjetil, his Master student Eli and some of the high-school students. Can you see the sketch of the Denmark Strait Overflow on the slide in the background? (Plus, for everybody who is interested: This is the food coloring I have been using right there in the front right!)

Help! Equation of State?

Is there an equation of state for hypersaline water at very cold temperatures?

A friend of mine is looking to calculate changes in density of a hypersaline Antarctic lake from summer to winter. Apparently, this lake is about 10 times saltier than the ocean and often cools down to -17C at the bottom.

My own spontaneous answer was that I am not aware of such an equation of state, and that I doubt that there is a lot of empirical data in that property range. Plus from talking to Dead Sea researchers while working on double diffusion, I know that measuring salinities that are that high is not at all easy – the constancy of composition of sea water breaks down (at least in the Dead Sea) which has consequences for the measurement methods that can be used, and in any case CTDs aren’t calibrated for those salinities. But I am hoping that the collective wisdom of my readers will come up with a better answer.

So, dear readers. Do you know of an equation of state that applies to that range of properties, or do you have any other comments on the issue? Please leave a comment below or get in touch with me! That would a) really help my friend, and b) help satisfy my curiosity :-)

Molecular diffusion of heat and salt

Why heat and salt diffuse at different rates.

Why do heat and salt diffuse at different rates? This seems to always be puzzling students when talking about double diffusion.

Well, why should they diffuse at the same rate? The processes of molecular diffusion of heat and salt are very different.

In the case of heat, a transfer of heat only means that particles hit and transfer energy. The warmer the substance, the faster the particles’ movements. So faster particles hitting slower particles will transfer momentum, and by slowing down one of the particles and speeding up the other one, this is de facto a heat exchange.

A transfer of salt on the other hand means that ions have to be transported from a region of higher concentration to a region of lower concentration. In order for this to happen, they have to travel over physical distances larger than just the wiggling connected to molecular movement, and they have to exchange place with water molecules and clusters.

Clearly, this second process is a lot more time-consuming than the first one?

Salt fingering – DIY

How to easily set up the stratification for the salt fingering process.

Setting up stratifications in tanks is a pain. Of course there are sophisticated methods, but when you want to just quickly set something up in class (or in your own kitchen) you don’t necessarily want to go through the whole hassle of a proper lab setup.

For double diffusive mixing, there are several methods out there that people routinely use.

For example the hose-and-funnel technique, where the less dense fluid is filled in the tank first and then the denser fluid is slid underneath with the help of a hose and a funnel. And a diffuser at the end of the hose. And careful pouring. And usually a lot more mixing than desired.

Or the plastic-wrap-to-prevent-mixing technique, where the dense fluid is put into the tank, covered by plastic wrap, and then the lighter fluid is poured on top. Then the plastic wrap is removed and by doing so the stratification is being destroyed. (No video because I was frustrated and deleted it right away)

Or some other techniques that I tried and didn’t find too impressive. (No videos either for the same reason as above)

But then accidentally I came across this one:

Granted, this is not a realistic model of an oceanic stratification. But as you can see towards the end of that movie, that turns out to be a blessing in disguise if you want to talk about the process in detail. As you see in the movie, the salt fingers inside the bottle are much smaller than the salt fingers outside the bottle. Because, clearly, inside the bottle the warm water is cooled both at the interface with the cold water inside the bottle, and by heat conduction through the walls of the bottle, since the water is surrounded by cold water. The warm water that flowed out of the bottle and up towards the water’s surface is only cooled at the interface with the water below (the air above is warmer than the cold water). So this gives you the perfect opportunity to discuss the scaling of salt fingers depending on the stratification without having to go through the pains of actually preparing stratifications with different gradients in temperature or salinity.

Diffusive layering. Or: This is not a trick question!

The “other” double-diffusive mixing process.

After having talked extensively about double diffusive mixing in my courses, I tend to assume that students not only remember that there is such thing as double-diffusive mixing, but that they also remember our discussions on how the process works, and that they would be able to transfer this to processes other than salt fingering.

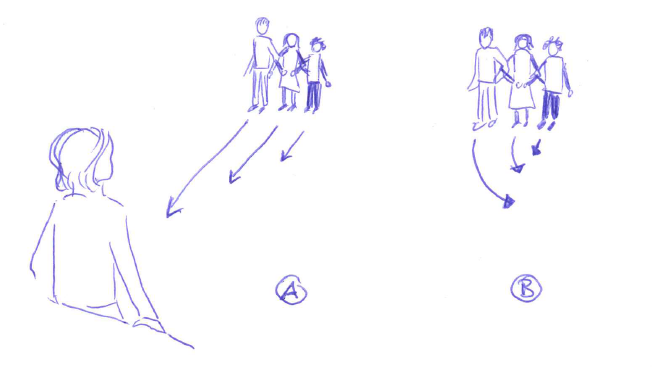
So in two courses (at different universities) I asked students in the exam to describe what would happen in a stably stratified body of water, where cold and fresh water overlies warm and salty water. And in both courses I have been surprised (read: shocked) by the responses I got.

The by far most common response goes along these lines: “Cold water is denser than warm water, so it will sink to the bottom and the warm water will rise”.

What I find frustrating about this (besides the fact that they didn’t notice that I clearly stated in the question that the stratification was stably stratified) is that whenever I talked about density, I mention how density depends on both temperature and salinity.

The next most common response is then this: “Heat diffuses a factor 100 faster than salt. Hence, salt fingers will form at the interface”. This answer then continues on describing salt fingering and never even mentions that the stratification I described in the question was actually the opposite one to the one they are assuming. So here, students clearly jumped to the conclusion that if I bothered describing a stratification, it clearly had to be the one for my favorite process (even though during those discussions I made sure to mention diffusive layering, too, but without talking it through in as much detail as salt fingering).

But then there are always students (usually the ones who don’t have a lot of confidence in their oceanography skills) who take the questions I ask at face value. Those are the students who go on to write something like this (numbering referring to the sketch below):

1) The initial stratification is stable in density, with cold and fresh water over warm and salty water. This means that the salinity stratification outweighs the temperature stratification in terms of density.

2) Since temperature diffuses a factor 100 faster than salinity, a thin layer with an intermediate temperature will form around the interface in salinity, that will persist for a while.

3) Focussing above the interface now, we have a stratification where cold and fresh water overlies lukewarm and fresh water. This stratification is hence unstable in temperature and convective overturning will occur. Below the interface, a similarly unstable layer has formed: lukewarm and salty water over warm and salty water. Again, convective overturning will occur.

The thickness of those layers depends on the initial temperature stratification and on how quickly temperature exchange happens during the overturning. In the end, two new temperature interfaces will have formed.

IMG_5958_DL

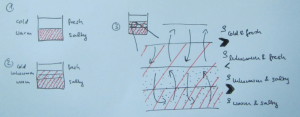
Sketch of the diffusive layering process. The red shading indicates warmer temperatures, the black dots indicate higher salinities.

And yes – that is exactly the response I wanted to hear!

So why do only so few students answer this question correctly? Don’t they understand that when I talk about salt fingering it is only an example of a double-diffusive process and not the only double-diffusive process there is? That was my initial thought after I saw the exams in the first class. So for the second class, I made sure to mention diffusive layering even more, and to explicitly say that I was talking through only one of the processes and that it might be helpful if they went through the other one on their own. Yet in the exams, the results did not change. And I have no idea. Do you? Then please let me know!

Salt fingering

How to show my favorite oceanographic process in class, and why.

As I mentioned in this post, I have used double-diffusive mixing extensively in my teaching. For several reasons: Firstly, I think that the process is just really cool (watch the movie in this post and tell me that it isn’t!!!) and that the experiments are neat and that everybody will surely be as excited about them as I am. Secondly, because it shows that understanding of small processes can be really important in order to understand the whole eco- and even climate system. And thirdly, because it helps to demonstrate a way of thinking about oceanography.

When I introduce salt fingering, I talk students through the process in very small steps. It goes something like this (Numbering is referring to the sketch below):

1) Initially, you have a stratification where warm and salty overlies cold and fresh water. This stratification is stable in density (meaning the influence of the temperature stratification on density outweighs that of the salinity stratification).

2) Since molecular diffusion of temperature is about a factor 100 faster than that of salinity (we will talk about why that is in a later blog post), the interface in salinity is initially basically unchanged, whereas a temperature exchange is happening across that interface, and a layer of medium temperature is forming.

3) At the salinity interface, we now have a stratification that is no longer stable in density: while the water now has the same temperature in a thin layer above and below the interface, it is still more salty on top and less salty below the interface. This means that the saltier water in this thin layer is denser than the less salty water below. This leads to finger-shaped instabilities at the interface: The salty water will sink and the fresh water will rise.

The individual salt fingers now have a much larger surface than the original interface, hence molecular diffusion of salt will happen much more efficiently and eventually the salinity inside and outside of the salt fingers will be the same, hence the growth of the fingers will stop.

At the depth where the salt fingers stopped, a new interface has formed. This new interface can also develop salt fingering, leading to a staircase-like structure in temperature and salinity.

After salt fingering has been introduced, there are usually several other occasions where it, or its effects, can be pointed out, like for example when showing this experiment (see picture below), when talking about the hydrographic properties in the area of the Mediterranean outflow or the Arctic, or when talking about nutrients in subtropical gyres.

IMG_4233_sehr_klein

This is a zoom in on one of the bottles shown in this experiment: In the warm bottle, the red food dye acts as salt to form salt fingers!

While talking about salt fingering, since I focus so much on the process, I have always been under the illusion that students actually understand the reasoning behind it and that they can reproduce and transfer it. Reproduce they can – transfer not so much. Stay tuned for the next post discussing reasons and possible ways around it.

Double-diffusive mixing

On the coolest process in oceanography.

My favorite oceanographic process, as all of my students and many of my acquaintances know, is double-diffusive mixing. Look at how awesome it is:

Double-diffusive mixing happens because heat and salt’s molecular diffusion are very different: Heat diffuses about a factor 100 faster than salt. This can lead to curious phenomena: Bodies of water with a stable stratification in density will start to mix much more efficiently than one would have thought.

In the specific case of a stable density stratification with warm, salty water over cold, fresh water, finger-like structures form. Those structures are called “salt fingers”, the process is “salt fingering”.

IMG_4233_sehr_klein

Salt fingering happening with the red food dye acting as “salt”.

Even though salt fingers are tiny compared to the dimensions of the ocean, they still have a measurable effect on the oceanic stratification in the form of large-scale layers and stair cases, and not only the stratification in temperature and salinity, but also on nutrient availability in the subtropical gyres, for example, or on CO2 drawdown.

Over the next couple of posts, I will focus on double diffusive mixing, but less on the science and more on how it can be used in teaching. (If you want to know more about the science, there are tons of interesting papers around, for example my very first paper)

How sound is refracted towards the regions of minimum speed.

Students acting out the process of sound being refracted towards the region of minimum speed.

We’ve been talking about refraction lately. Waves get bent in the direction of lower velocity. This holds for light and sound and even ocean waves. However, students find it conceptually difficult to understand why waves are being bent towards lower rather than higher speeds, so I came up with this very simple demonstration.

Students, arms joint, are acting as a wave crest. Students on the one side of the student chain are told to move very slowly, students on the other side are asked to move quickly towards the instructor. Everybody takes care to not hurt anybody, so if tension builds up in the chain, everybody has to react to reduce the tension. What happens is that the “wave crest” of students changes direction towards the side of the slowest motion.

Easy visualization and – since it involved students getting up, joining arms and doing something – also very memorable. Win – win!

Another easy example: When you are sliding on an icy road and your foot gets caught in grass or gravel or something on one side (== region of lower velocity), you start skidding towards the side with the obstacle, not towards the middle of the icy road.

Measuring temperature.

Students build thermometers.

As described in this post, I like to have students build “instruments” to measure the most oceanographic properties (temperature, salinity and density). I find that they appreciate oceanographic data much more once they have first-hand experience with how difficult it is to design instruments and make sense of the readings. Over the last two days I described the experiments for salinity and density, today it’s temperature.

measuring_temperature

Students building thermometers.

Measuring temperature is probably the most difficult of the three properties. Firstly, there are lots of technical difficulties to be overcome. How can we seal the mouth of the bottle around the straw in a way that it is really water tight? How much water do we have to fill in the bottle? Does it matter if there are air bubbles trapped? What if the water level when we fill the bottle is not visible because of the seal? If the straw is clogged up with modeling clay, will we still be able to use it in the instrument? How long does the straw have to be above the seal in order to avoid water spilling out when the temperatures we try to measure become too hot?

Then, there are many problems connected to the actual measurement. If we lift up the thermometer (and hence squeeze the plastic bottle) – how does that influence our reading? Since we have half a liter of water in the thermometer, are we actually measuring the temperature of the water sample, or are we influencing it while trying to measure? How do we come up with a scale for our temperature measurements had I not supplied (mercury-free) thermometers to calibrate the new thermometer with? So many questions to think about and discuss!

How a CTD works

Movie on how the most important instrument in oceanography works.

On our cruise on the WHOI research vessel Knorr in 2011, Sindre Skrede (find him on twitter or vimeo for many more exciting pictures and movies!) and I made a movie for his blog, describing the most important oceanographic instrument. We recently translated the movie from Norwegian to English and here it is. Enjoy!