Tag Archives: student cruise

Taking water samples

A big part of any oceanographic research cruise: Taking water samples.

Here is a group of students practicing how to arm Niskin bottles that will go into the ocean open on both ends, and that will then, when the whole rosette is on its way up again, be closed one after another at depths that promise to be interesting in terms of water properties.

Arming those Niskin bottles is actually not as easy as it looks, there is a strong spring going through the bottle, connecting the lids. And it is actually pretty painful if you accidentally close the bottles while some part of your body is between the bottle and the lid. Ask me how I know…

When the bottles are all open, the rosette can be lifted off the deck and into the sea.

Usually, rosettes are equipped with instrumentation in addition to the Niskin bottles, usually a CTD, measuring conductivity (to calculate the salinity from), temperature, and depth (actually measuring pressure, which converts easily into depth). I contributed to a very nice movie about how CTDs work a couple of years ago, check it out!

And now the rosette is finally in the water.

Water samples in physical oceanography are mainly used to calibrate the sensors on the CTD, which give (pretty much) continuous measurements throughout the whole depth of the water column. And that’s also what we want to use our water samples for — we have a hand-held conductivity probe that is right now producing values that cannot be correct. How we are going to deal with that? We (and you!) will find out tomorrow! :-)

Home-made surface drifters

A bicycle safety flag, a plastic bucket, four paint roller trays — what are those people doing there?! Until now this might almost count as kitchen oceanography!

Home-made surface drifters

But it’s only almost kitchen oceanography; at least my kitchen isn’t usually stocked with GPS trackers, which is what is mounted on this contraption. Let alone the research ship we used to deploy it. So this must surely count as real oceanography then!

Lars Henrik and students deploying a surface drifter to measure the surface current in a fjord

Lars Henrik and students deploying a surface drifter to measure the surface current in a fjord

Above, you see  Lars Henrik and his students deploying a surface drifter. The red buoy keeps it floating at the surface, the chain hanging below is heavy enough to make sure it stays upright. The bucket and four paint roller trays act as sea anchor so the whole thing moves with the water rather than being blown about by the wind. A safety flag, radar reflector and light make sure nobody accidentally sails over it, and the GPS sender lets the position be tracked.

For example like this:

Screen shot of the map and the drifter positions from my mobile phone

Screen shot of the map and the drifter positions from my mobile phone

Above, you see what it looked like when we had already deployed three of our four surface drifters (the red ones that are moving so slowly that the software tells us they aren’t moving at all), while the fourth one is still onboard the ship, moving to the position where it will be deployed (the green one moving at 3km/h).

Follow their positions on your mobile device!

Following surface drifters’ paths in real time is pretty awesome in itself, but what makes it even better is that the GPS positions can be accessed online from any device. Below, for example, you see the positions on my phone with the drifters behind it in the water (if you look really closely, that is. But they were there!).

My mobile phone with the drifters' positions and the drifters in the background

My mobile phone with the drifters’ positions and the drifters in the background

What you also see is that three of the drifters have huddled together after a couple of hours out in the fjord. Nobody really knows why yet, but that’s what we are here to find out!

Just from observing the wind and the movement of the drifters throughout the day, it seemed that the surface circulation in this fjord is dominated by the wind over the tides. But there will be a Master’s thesis written on the data we collected today (plus a lot more data and a regional ocean model!) so we’ll soon know how good my assumptions are and what really drives the surface currents here.

Three of the drifters huddling together due to currents that have yet to be understood

Three of the drifters huddling together due to currents that have yet to be understood

Come time to recover the drifters, the weather wasn’t quite as nice as earlier throughout the day. Just to give you an impression of the conditions under which the drifters were recovered:

Algot and Inga recovering a drifter

Algot and Inga recovering a drifter

Yep, if you look at the sea state, there is nothing to complain about, really, just a little water coming from the sky! But it was cold water… ;-)

And everything got recovered safely and made it back to port — ready to be deployed again tomorrow to gather more data and understand the fjord a little better. Exciting times! Thanks for letting me be part of this GEOF105 adventure, Lars Henrik!

The drifters coming home to the port of Bergen

The drifters coming home to the port of Bergen

Cruise on RV Uthörn

Picture dump – in german only today, sorry.

So. Noch schnell die Bilder von der heutigen Ausfahrt auf der Uthörn für alle, die es gar nicht erwarten können!

Hier ist das Schiff:

IMG_8807

Die Uthörn.

Wir hatten natürlich ein ambitioniertes wissenschaftliches Programm. Zum Beispiel mit mehreren, vom Wind-Workshop selbstgebastelten, Anemometern die Windgeschwindigkeit messen.

Zuerst mussten die natürlich an alten Zaunlatten befestigt und am Schiff montiert werden.

Danach konnten wir dann anfangen, halbstündig die Werte abzulesen. Dafür war viel Kommunikation zwischen der Wind-ablese-Gruppe und der Brückenprotokoll-Gruppe notwendig: Wir haben auf der Brücke alle Navigations- und Meteorologie-Daten aufgeschrieben.

Zwischendurch war sogar Zeit, sich vom Steuermann zeigen zu lassen, wo genau wir uns befinden und wo unsere Stationen sein werden.

Während ich gemütlich auf der Brücke war, wurde unten hart gearbeitet.

Worauf in dem Bild oben die Leute alle wohl so fasziniert gucken? Genau, unsere CTD.

Nachdem die CTD-Gruppe gestern viel von der sogenannten Rosette erzählt hatte, waren sie von unserem einen Wasserschöpfer doch leicht enttäuscht.

Interessant war auch das Wetter. Am Anfang strahlender Sonnenschein, doch dann sah es irgendwann so aus:

Es wurde dramatischer und dramatischer, aber zog dann letztendlich doch schnell vorbei.

So richtig schlimm sah es auch erst aus, als es schon wieder vorbei war.

Trotzallem haben wir natürlich weitergearbeitet, zum Beispiel mit dem Plankton-Netz, das auf dem Bild unten zu sehen ist.

Und mit der Secci-Scheibe, die hier gerade wieder an Deck geholt worden ist.

IMG_8765

Secci-Scheibe

Eine sehr erfolgreiche Ausfahrt! Nicht nur die 17 Schüler waren begeistert.

Vielen Dank an Kapitän und Steuermann, mit denen ich viel Spaß auf der Brücke hatte, und an die Crew der Uthörn!


Student cruises (part 5 of many, or – thank you to a great mentor)

The first student cruise I ever taught while being taught by one of the greatest teachers myself.

As you might have noticed from the last four or so blog posts, I really enjoy teaching student cruises and I think they are a super important part of the oceanography education.

So let me tell you about the first student cruise I taught. I was lucky enough to co-teach it with one of the most experienced and knowledgeable oceanographers out there, who was excited about sharing with me all there is to know about cruise planning, cruise leading, teaching at sea and many other topics.

Screen shot 2012-03-09 at 6.21.44 PM

Me and Anne on watch during that student cruise. Picture courtesy of Angus Munro.

From the first day of the first cruise onward, my ideas and contributions were welcomed, and I got to heavily influence the scientific program of the cruise. On the second day of the first cruise, I was told to just walk up to the captain and tell him if I wanted to change the course and go measure somewhere else than planned.

Screen shot 2012-03-09 at 6.24.50 PM

On the bridge, discussing the scientific plan for the next day. Picture courtesy of Angus Munro.

The cruise ended up being great learning experiences for me. For the first time, I got to decide how to allocate ship time to best investigate the question that I thought was most interesting, a topic that I had never had (the chance) to deal with previously.

Screen shot 2012-03-09 at 6.16.03 PM

Getting the small boat ready to recover a mooring. Photo courtesy of Angus Munro.

At the same time, I had the opportunity to learn from – and work with – the best. One of the practical highlights: A mooring release had not been working reliably in the past, but it was the one that we had with us on this cruise. So what to do?

Screen shot 2012-03-09 at 6.15.52 PM

Recovering a mooring. Photo courtesy of Angus Munro.

Easy! Just tie a rope from the mooring to a tree! (Ok, so maybe this isn’t generally helpful, but if you are in Lokksund, this is genius)

And then I got to spend a lot of my time on watch (and a lot of my time off watch) discussing what we were seeing in the new data, what we could learn from that, where we should go next to prove or disprove our new theories.

And I got to watch a great teacher interact with his students (other than me). I saw how he challenged, how he encouraged, how he helped, how he guided, how he inspired.

Screen shot 2012-03-09 at 6.15.37 PM

Bringing the mooring back on deck. Photo courtesy of Angus Munro.

Thank you so much, Tor, for being the role model you are and for having given me all of this, which I have since been striving to give to my own students.

All photos in this post were taken by Angus Munro (thanks!) on the 2012 GEOF332 student cruise.

Student cruises (part 4 of many – weird profiles)

When a CTD profile suddenly looks really weird.

As mentioned before, student cruises seem to bring out the weird experiences with CTDs. My theory is that it’s the world testing us. It would be bad enough to deal with this stuff if we were on CTD watch in the middle of the night on our own, but dealing with it in front of a group of eager students, all asking questions when you just want to think, is the ultimate test of whether you know your stuff and have the nerves to deal with anything.

So, of course, this year’s GEOF130 student cruise couldn’t be an exception. After dealing with an unfortunate encounter of the CTD and the bottom about which we shall not say any more than this, the next profile looked like this:

Not seeing it yet? Let me zoom in for you:

A really weird offset between downcast and upcast occurred in density and salinity, persisted for about 100m, ended with a huge spike and then disappeared.

So what happened? I have actually no idea. I’ve seen jellyfish being sucked into the pump, resulting in fresh spikes. And that salinity and density react very similarly even for anomalies is not that surprising, seeing that one is calculated from the other. But why would the shape of the profile stay the same, only shifted towards fresher values and lower densities? Ideas, anyone?

Student cruise (part 3 of many, or – when the CTD didn’t start up)

When a CTD just doesn’t start pumping.

In this post, I talked about how student cruises always happen to be on the perfect days, and then in this post I talked about how to read CTD profiles. So now knowing all of this, here is a confession: I have never seen so much weird stuff happen to the CTD as on student cruises!

Last year, I took my students of the GEOF130 course out. We had two groups on a one-day cruise each, on FS G. O. Sars, the new-ish and fancy Bergen-based research ship.

Of course, as any real cruise, we started with a safety briefing with the officers.

But listening to the rules wasn’t enough, students had to also try on the survival suits.

But then at some point, we started doing science.

Since I already talked about what the CTD operator typically sees on the screen, I’m only showing you the ones you haven’t seen yet. Did I mention that the G.O. Sars is a pretty fancy ship? And this doesn’t even show the met data or fish finder, which were on yet another cluster of screens.

Finally, we were on station and ready to deploy the CTD.

But then, when the CTD was finally in the water, we waited. And waited. And waited. And nothing happened! We waited some more, but the pump on the CTD just didn’t switch on. We lowered the CTD. And lowered it some more. And waited. And then, when we were almost ready to bring it back up on deck, we brought it even deeper and it started up! When we got the first readings, we realized what had been the problem. The CTD pumps are set to switch off when salinities fall below a certain value. This is done to make sure the pump switches off when the CTD isn’t in the water any more to avoid having the pump run dry. And since we were in a fjord (where we typically have a fresh layer on top, see this experiment) on a calm day after a very calm week, clearly, the salt stratification had become so strong that we couldn’t even measure the top layer because our CTD didn’t recognize it was in the sea! I’ve never seen this happen before.

But then finally we brought the CTD back up on deck and students could start to practice sampling.

We were incredibly lucky with the weather, and since we had Sindre Skrede visit us, we can even document it with beautiful pictures!

The end! :-)

Student cruise (part 2 of many, or – reading CTD profiles)

Reading CTD profiles.

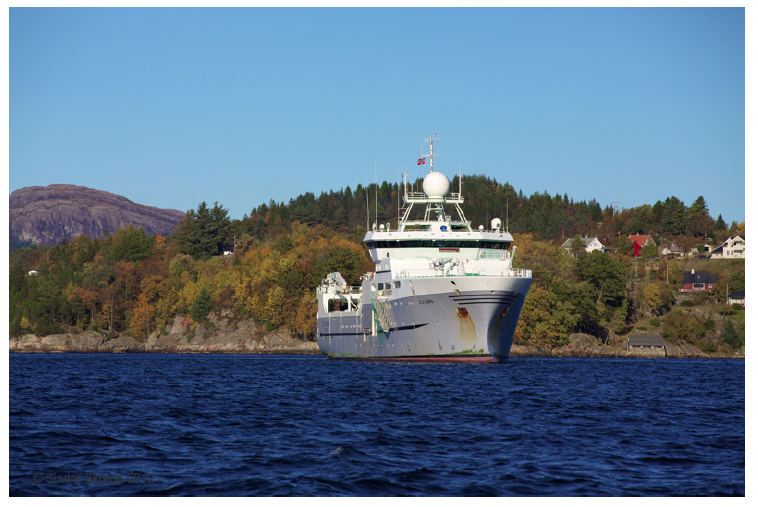
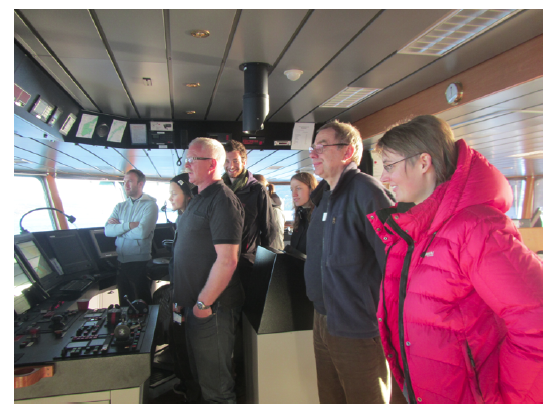
In this post, I talked about student cruises and why they are important for motivation. Here I want to go into a bit more detail on one of the actual learning outcomes: Using the CTD to make measurements, and reading the profiles.

I already talked about how a CTD works a while back, but today I want to go into a bit more detail of what you can actually see in a CTD profile when you are sitting in the lab at sea, staring at the monitor, while the CTD is going up or down.

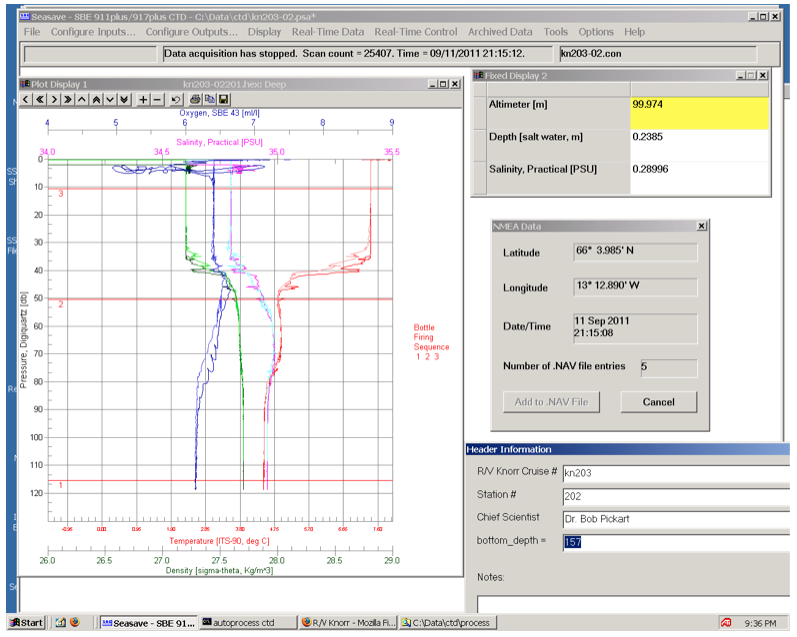
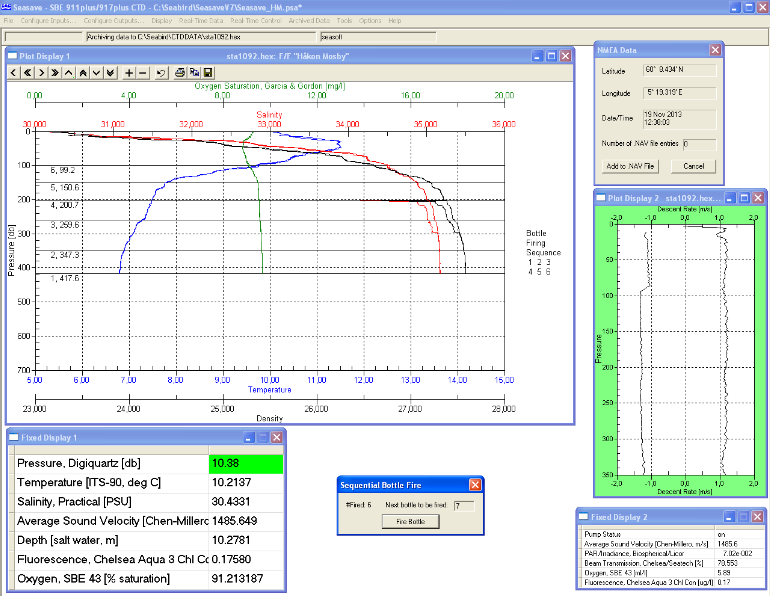
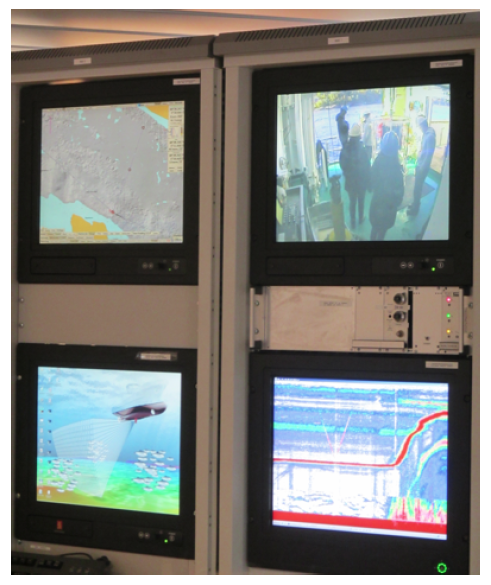
There are a couple of important things to note here. First, let’s go through the command windows on the right. The lowest one is general cruise information that goes into the header of the data file: Station number, cruise name, chief scientist, this kind of things.

The next window up is the position and time of that station. Important information for the header of the data file, not so crucial for the CTD operator to know.

But then the next window up is where it gets interesting. The yellow field shows the distance from the instrument to the sea floor, calculated from an echosounder-like instrument mounted on the CTD. The distance from the bottom is really important to know, since you will want to make sure that the CTD does not ever hit the bottom, and the depths in sea charts are not very reliable if you are in remote areas.

And then lastly, the most interesting window on the left. This is where data is displayed in real time as it is measured while the CTD is being lowered and hoisted up again. On the horizontal axis, the properties (temperature, salinity, density and oxygen) are displayed against depth on the vertical axis. You see water being warmer and fresher towards the surface than at depth, with higher oxygen concentrations near the surface. So far, so good.

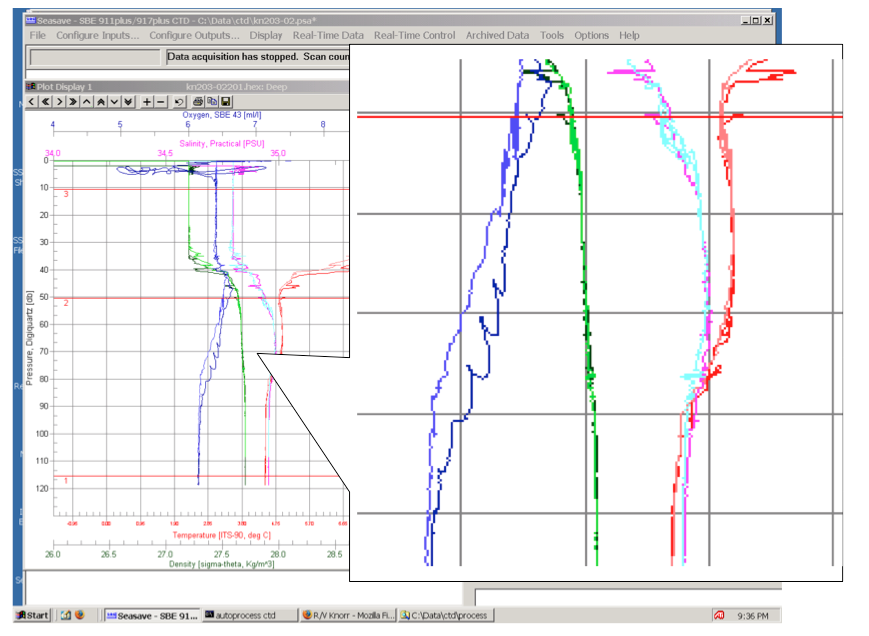
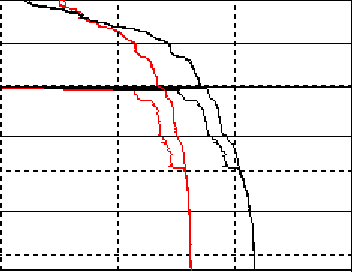
In the blow-up in the figure above you see several interesting features. But I want to focus on one in particular: The blue oxygen curve.

In the depth range displayed here, the downcast (measured when the CTD went down) and the upcast (measured when the CTD went up again) don’t agree very well. And while one of them is nice and smooth, the other one shows many wiggles. Why is that?

When sitting in front of the monitor on CTD watch, it is easy to forget that the vertical axis displays pressure. As you watch the graph build up, it seems like it might as well be time. The longer you watch, the further down the CTD sinks, until at some point it turns around and comes back up. When you’ve done a couple of CTD stations, you know very well how long any given station will take and you have optimized what point you need to get ready to step outside and help bringing the CTD back in in order to be there on time but not any earlier than necessary.

However, what is displayed on the vertical axis is depth. Or, if you want to be even more precise, pressure. Usually, pressure can be converted to depth fairly easily. For every 10 meter you go down in water, the pressure increases by 1 bar. This is, however, assuming that the water surface stays in the same place. In the station shown above, this was clearly not the case. All the wiggles you see in the profile? Yeah, waves. And if you look closely at the plot, you can estimate their amplitude. Yes, about 5 meters.

So this is why you want to always keep an eye on that number in the yellow field – the distance from the bottom. In case of this station we were lucky: We had a wave train coming through as the CTD was about half way down, but while we were close to the bottom the sea was relatively calm. But that was dumb luck. We have also been on station when the waves were highest while we were closest to the bottom. And that is when CTD operators get very nervous, especially on cruises where one of the main objectives is to measure as close to the bottom as possible. But as always: better safe than sorry; better lose some data close to the bottom than the whole CTD.

Student cruising

Why student cruises always end up being on the most beautiful days of the year, or: why student cruises are an important part of the education.

Remember the picture I showed in the last post, that was worthy of being on an Advent calendar or postcard? The one below?

IMG_5874

FS Håkon Mosby arriving back in Bergen in November 2013.

That was taken on this year’s GEOF130 student cruise.

And remember the ice-on-Hardangerfjorden picture I shared a while back? This one?

Oh, taken on this year’s GEOF332 student cruise.

And the student cruise before, GEOF130 in 2012, looked like this:

See a pattern here?

So how come we always end up being out on the perfect day? Well, firstly, clearly I am that good. Or that lucky. But then, the perfect day only becomes the perfect day when you give it the chance.

What I mean is that on student cruises, it is easy for a day to become perfect. Because it is exciting to be on a research ship for the first time, to figure out how to measure oceanographic data, to develop a feeling for how much the ship is actually supposed to be rolling before you have any reason to become concerned, to see how your oceanography classes apply to the real world, to put on an orange one-fits-all survival suit, to gauge how you can influence the quality of the data by paying attention (or not), to get a break from your everyday life, to eat all the awesome food all the time, to visit the captain on the bridge, to see the familiar city from the water, to see a whole new world opening up to you, to experience what it could be like to be an oceanographer.

Especially in the “introduction to oceanography” lecture GEOF130, the student cruise is so much more than just knowledge transfer – it is an incredibly important part of building a professional identity that helps students to find motivation to sit through boring lectures and to fight through difficult exams because in the end they will then get to do this again: to go an another cruise and have more perfect days at sea.