Tag Archives: sea water

Ice cubes melting in fresh water and salt water (post 2/4)

The “ice cubes melting in fresh water and salt water” experiment the way I usually use it in class.

— Edit — For an updated description of this experiment please go to this page! — Edit —

You might remember the “ice cubes melting in fresh water and salt water experiment” from a couple of days ago. Today we are going to talk about it again, but with a little twist on it. See, when I showed you the experiment the other day, I used dyed ice cubes, so the melt water was colored and it was easy to track. Doing that, I focussed you attention on the melt water. This is not how we do it in class.

In class, students get clear ice cubes, and before they put them in the cups, I ask them to make a prediction. Which of the ice cubes will melt faster, the one in fresh water or the one in salt water? Everybody has to make a prediction. And having run this experiment with 100+ people by now, I can tell you: Approximately 5% predict the right outcome. And that is not 5% of the general population [edit: this used to say “5% of the general circulation”!], that is 5% of people who were either attending my class or a workshop on oceanography with me, who were attending a workshop on teaching oceanography, or my nerdy friends. So don’t be sad if you get it wrong – you are in good company.

So now that everybody has made a prediction, the ice cubes go into the cups with fresh water and salt water. In the beginning, the excitement is usually moderate. After all, you are staring at a plastic cup with an ice cube floating in it. But then, after the first minute or so, there is no denying any more: The ice cubes have started melting. And one of them is melting a lot faster than the other one. The one in fresh water is melting a lot faster than the one in salt water! How can this be? At this point, students typically start secretly (because remember – no tasting in the lab!) tasting the water in the cups to make sure that they didn’t actually swap the cups. After all, it should be the ice cube in the salt water melting faster, shouldn’t it?

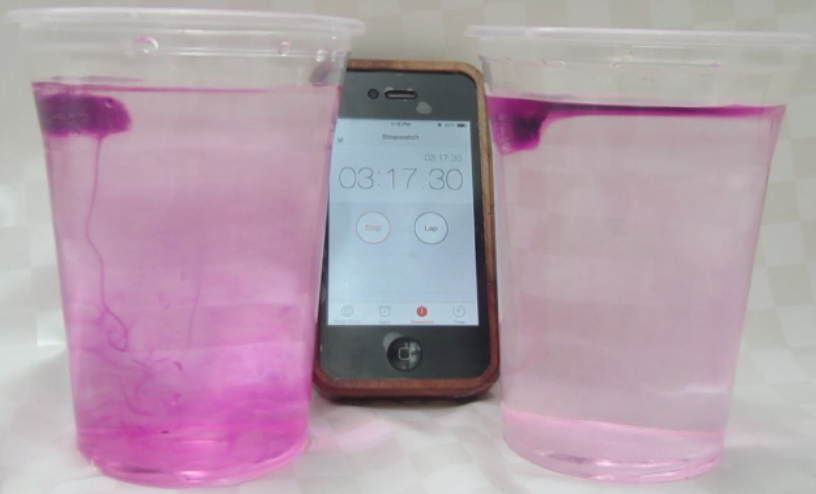
But no, it is true: The ice cube in fresh water is melting faster than the one in salt water. But how??? Enter food coloring.
MVI_9248

Dyed ice cubes melting in fresh water (left) and salt water (right). Edited on Sept. 14th, 2014. Since this seems to be the most popular post on this blog I thought people might appreciate a better picture… And if you are really curious go check out the newer posts on the topic, a lot has happened over the last year!
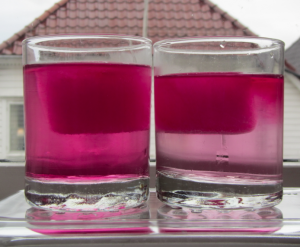
Glasses filled with fresh water and salt water, and one ice cube in each. Drops of food dye have been added on the ice cubes to visualize the circulation. The left glass is homogeneously pink, whereas the right glass has a pink layer on top and only little pink below that layer.

If at this stage one or two drops of food coloring are dripped on the ice cubes, this dye helps visualize the circulation similarly to the dyed melt water I showed you the other day [which, incidentally, one of the student groups yesterday observed without food dye or me prompting. Great job!].

And now the whole thing makes much more sense: In the fresh water case, melt water is denser than the water in the cup and sinks to the bottom of the cup. As it is sinking away from the ice cube, it is being replaced with warmer water from the cup. Hence the ice cube is always floating in relatively warm water which helps it melt.
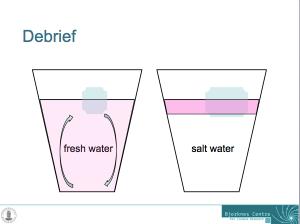
Sketch showing the explanation for why the ice cubes melt faster in fresh water than in salt water.

In salt water, on the other hand, the melt water forms a layer on top of the water in the cup. Even though it is very cold, it is still less dense than the salty water in the cup. The ice cube is more and more surrounded by its own melt water and not by the warmer water in the cup as was the ice cube in the fresh water. Therefore, the ice cube in the fresh water is melting faster than the one in salt water!
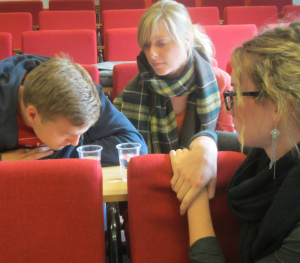
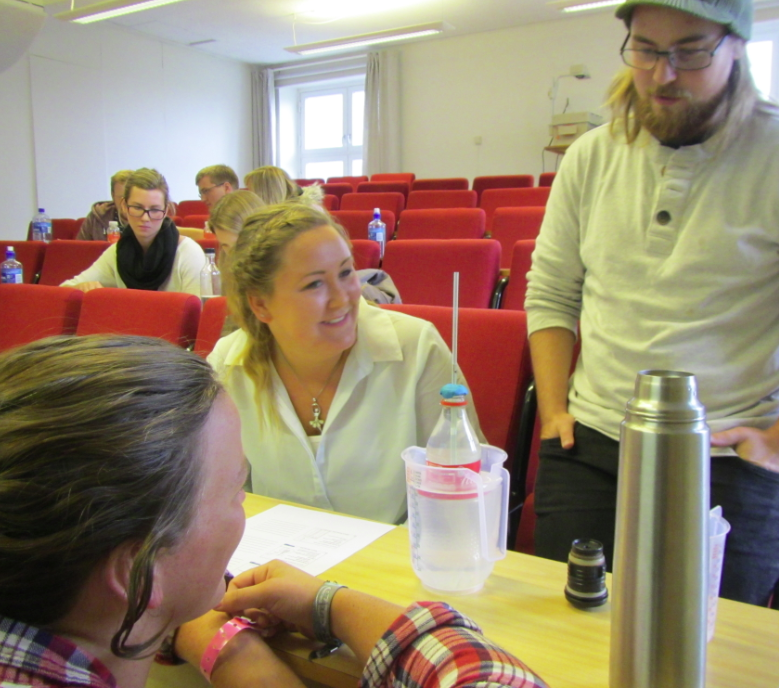
The experiment run in the lecture theater.

This experiment is easy to run in all kinds of settings. However it helps if the student groups are spaced out enough so that the instructor can reach all of the groups and listen in on the conversations to get a feel of how close to a solution the students are, or chat to the students to help them figure it out.

There will be two follow-up posts to this one: One about different didactical settings, and one different contexts this experiment can be used in.
On how ice freezes from salt water

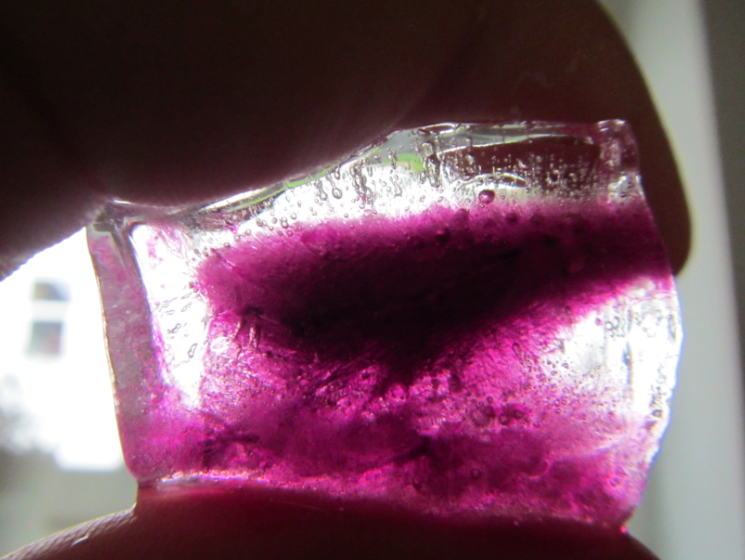
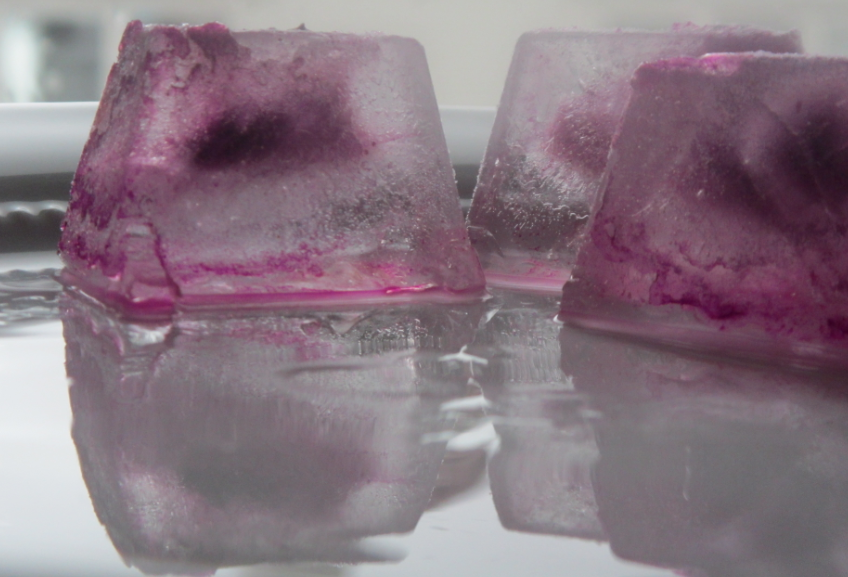
I’ve been wondering how to best show how sea ice freezes for quite a while. Not just that it freezes, but how brine is rejected. By comparing the structure of fresh water and salt water ice, one can get an idea of how that is happening (and I’ll write a post on that after we have done this experiment in class). But I accidentally stumbled upon a great visualization when preparing dyed ice cubes for the melting ice cube experiment (see this post) when all my ice cubes came out like this:

Ice cubes made from colored water.

Instead of being nicely homogeneously colored, the color had concentrated in the middle of the ice cubes! And since the dye acts in similar ways to salt in the ocean (after all, it IS a salt dissolved in water, even though not the same as in sea water), this is a great analogy. It is even more visible when the ice cubes have started to melt and the surface has become smooth:

The dye has frozen out of most of the ice and been concentrated in the middle of the ice cube.

Clearly, when forming, the ice crystals have been rejecting the dye! In the ocean, due to cooling happening from above, ice would freeze downward from the surface, under the influence of gravity the brine channels would be vertical, and brine would be released in the water underneath. In my freezer, however, cooling is happening from all sides at once. There is a tendency for the dye to be rejected towards the bottom of the ice cube tray under gravity, but as ice starts forming from all sides, the dye becomes trapped and concentrated in the middle of the forming ice cube. Can you see the little brine channel leading to the blob of color in the middle?

I must say, when I first took the ice cubes out of the freezer I was pretty annoyed because they weren’t homogeneously colored. But now I appreciate the beauty of the structure in the ice, and you can bet I’ll try this again with bigger ice cubes!

Ice cubes melting in salt water and freshwater (post 1/4)

Experiment to visualize the effects of density differences on ocean circulation.

This is the first post in a series on one of my favorite in-class experiments; I have so much to say about it that we’ll have to break it up into several posts.

Post 1 (this post) will present one setup of the experiment, but no explanations yet.

Post 2 will present how I use this experiment in GEOF130, including explanations.

Post 3 will discuss how this experiment can be used in many different setups  and

Post 4 will discuss different purposes this experiment can be used in (seriously – you can use it for anything! almost…).

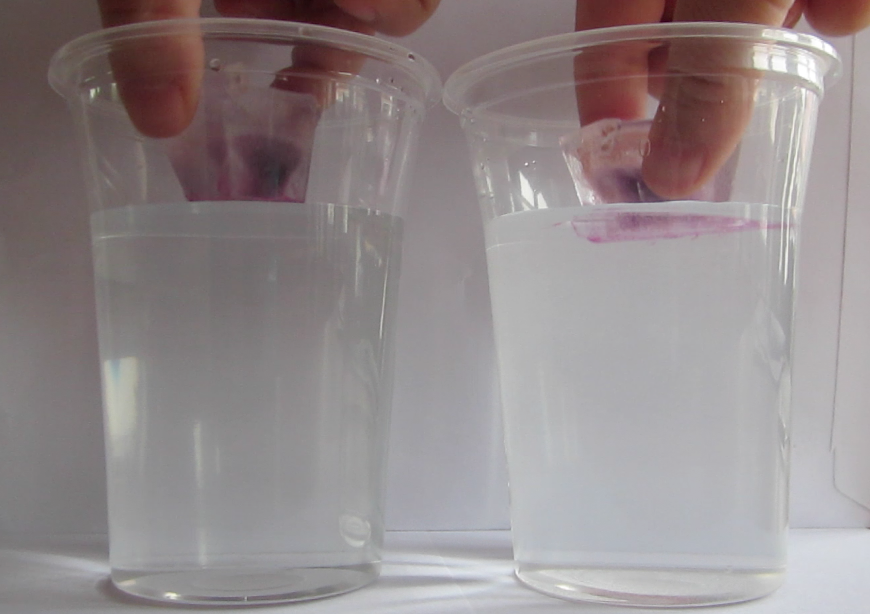
So, let’s get to the experiment. First, ice cubes are inserted into two cups, one filled with fresh water at room temperature, the other one filled with salt water at room temperature. In this case, the ice cubes are dyed with food coloring and you will quickly see why:

Ice cubes are added to cups filled with water at room temperature: fresh water on the left, salt water on the right.

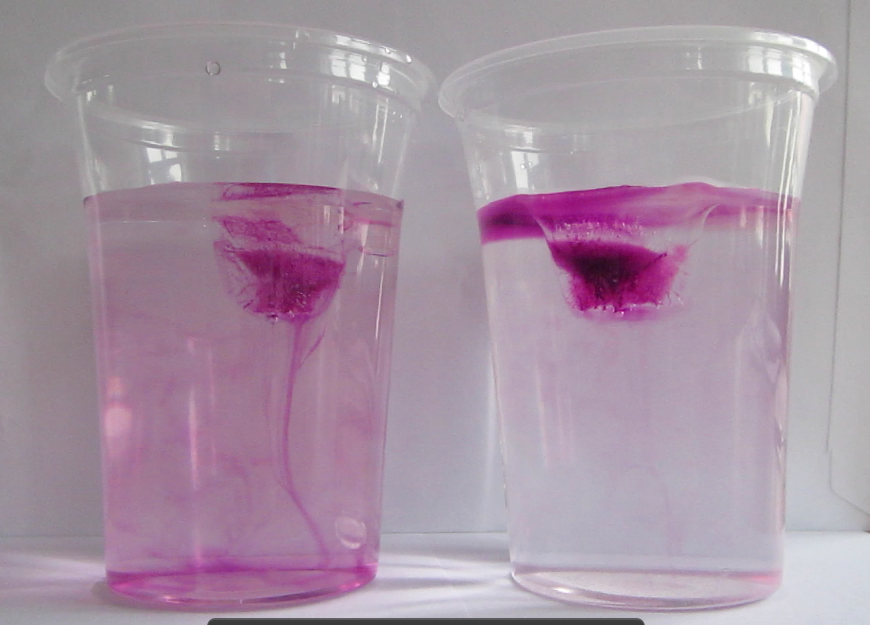
As the ice cubes start to melt, we can see the dyed melt water behaving very differently in fresh water and salt water. In fresh water, it quickly sinks to the bottom of the cup, whereas in salt water it forms a layer at the surface.

Melt water from the ice cube is sinking towards the bottom in the cup containing fresh water (on the left), but it is staying near the surface in the cup containing salt water (on the right).

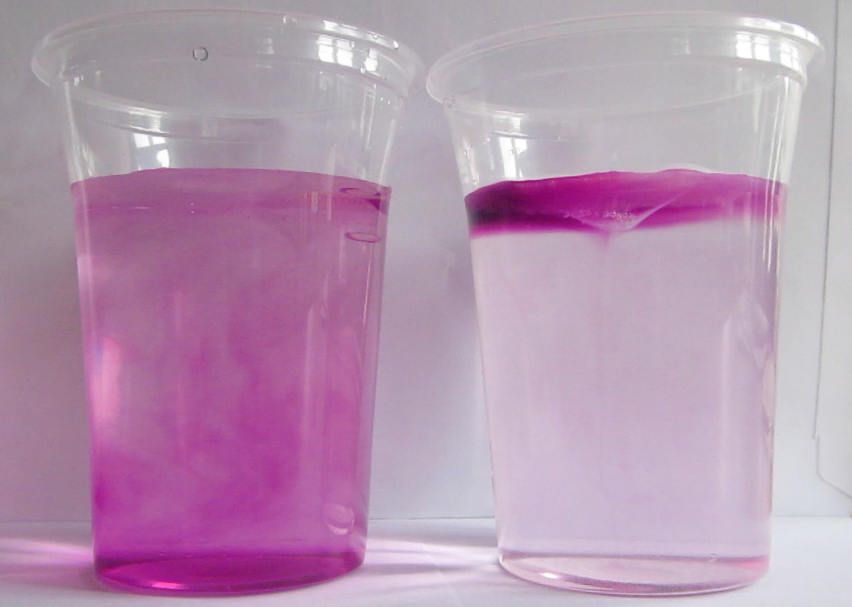
After approximately 10 minutes, the ice cube in freshwater has melted completely, whereas in salt water there are still remains of the ice cube.

After 10 minutes, the ice cube in the fresh water cup has melted completely (left), whereas the one in the salt water cup is not gone completely yet (right).

Why should one of the ice cubes melt so much faster than the other one, even though both cups contained water at the same (room) temperature? Many of you will know the answer to this, and others will be able to deduce it from the different colors of the water in the cups, but the rest of you will have to wait for an explanation until the next post on this topic – we will be doing this experiment in class on Tuesday and I can’t spoil the fun for the students by posting the answer today already! But if you want to watch a movie of the whole experiment: Here it is!

(Yes, this really is how I spend my rainy Sunday mornings, and I love it!)

– I first saw this experiment at the 2012 Ocean Sciences meeting when Bob Chen of COSEE introduced it in a workshop “understanding how people learn”. COSEE has several instructions for this experiment online, for example here and here. My take on it in the “on the Cutting Edge – Professional Development for Geoscience Faculty” collection here.

How to measure temperature, salinity and density

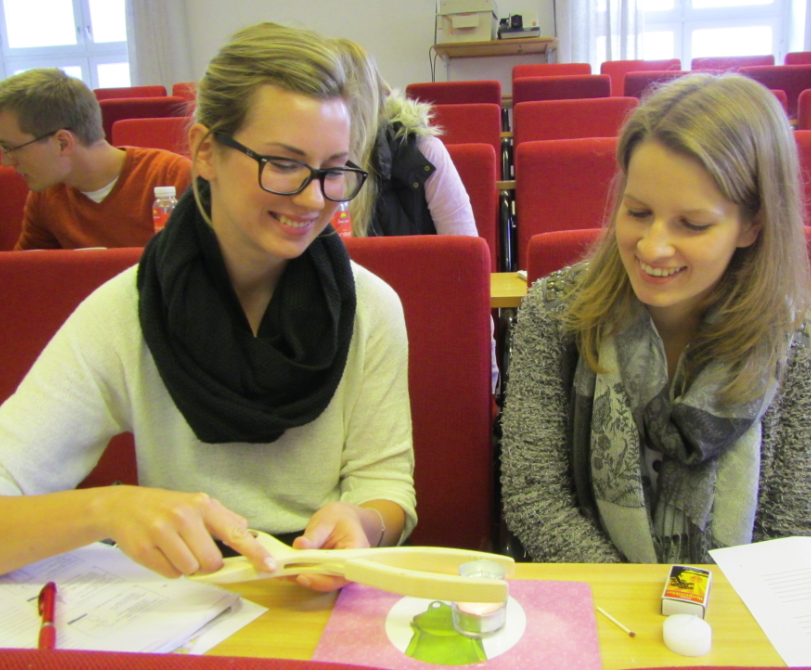
Three in-class experiments run in parallel. Great if you want to discuss how properties are measured and what kind of difficulties you might encounter.

Temperature, salinity and density are the most important properties in physical oceanography. Measuring them with a CTD is easy. But can you, using basic household items, build instruments to measure those properties? My students can! And it’s also a great opportunity to discuss all kinds of issues with measuring in general, and these properties in particular.

Temperature? Easy! Use the thermal expansion of water! But then wait, does our half liter of water change the temperature of the sample while “measuring” its temperature? Also, how do we know the temperature of the sample if we don’t have a thermometer to begin with?

IMG_4456

A home-made thermometer

Salinity? Really easy! Just evaporate the water and weigh the remaining salt! But what if some of the salt evaporates with the water? What kind of constituents do we have in sea water?

IMG_4458

Sea water is being evaporated in order to investigate the remaining salt.

Density? Since we had our water samples from yesterday’s sea water tasting, all we had to do is find something that floats in sea water without submerging completely, and mark how deep it sinks in the different water samples! But then again, how do we know the density of our samples if we don’t know their temperatures and salinities because the other groups haven’t built those instruments yet? And even if they had, how would we be able to calculate density from it if we didn’t know the equation yet because it had not been established yet?

IMG_4465

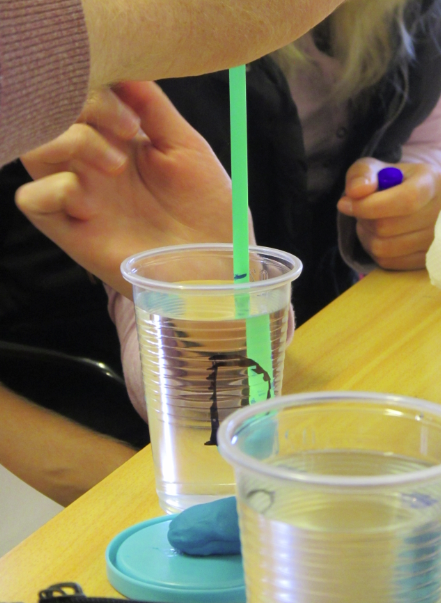
Density probe being lifted from a sample.

And what was the most difficult part? To stay focussed on your own experiment while there was cool stuff going on everywhere around you in the lecture theatre. As my office mate predicted: Someone will set the wooden tongs on fire!

messgeraete_bauen

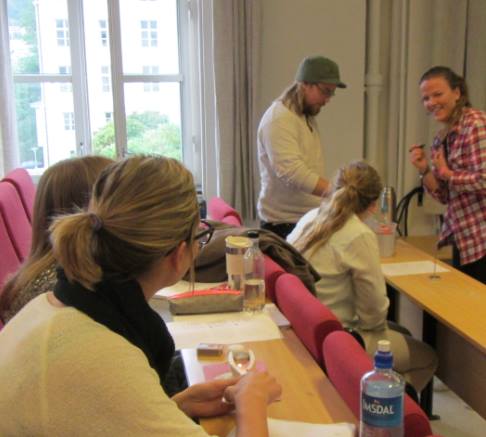
Cool experiments going on everywhere you look!

Tasting sea water

Hands-on activity on sea water salinity

In the first lecture of the “introduction to oceanography” GEOF130 course 2013, we investigated water samples from four different regions: The Mediterranean, the tropical North Atlantic, the Baltic and Arctic sea ice. Just by tasting their different salinities (40psu, 35psu, 10psu and 5psu, respectively) students figured out which of the samples came from which region. And now what influences salinity in the ocean?