Tag Archives: scicomm

An attempt at an elevator pitch

I’ve been coming up with #scicommchall challenges for well over a year now, and I have always met them. Except for last November, when the challenge was to do an elevator pitch and post a movie of it. Since this is something I really want to do, I decided to force myself to it and repeat the challenge this January. And man, was this hard! For a lot of reasons: I don’t think what I am saying captures the essence of what my job is about, I hate seeing myself on video, I hate listening to my own voice even more, and wow is it difficult to get some alone time in the elevator at work! I’m really not satisfied with the result just yet. But I am sharing to maybe inspire others to join me in my efforts. Will you join me? :-)

So here are two versions, first one with English subtitles.

And then here a non-subtitled one that includes a couple of takeouts (because those are always my favorite part of every movie ;-))

But I am not done here, and my #scicommchall to myself remains: to write a better script, to film it in an elevator, and to upload it on the internet! :-) How is this #scicommchall working for you? Show me your elevator pitches!

Cool podcast about oceanography! Also useful if you were looking to improve your German! ;-)

Just in case you have not listened to Ronja and Maxie’s podcast Treibholz yet, you definitely should! Ronja and Maxie are learning about oceanography and taking everyone along with them. Educational and entertaining to listen to!

And then I also got to be part of it last year, which was great fun! Check out the episodes that include interviews with me:

  • In the first one (actually their episode 15), we talk about what made me want to study oceanography, what drives the gulf stream, the importance of eddies in the ocean, and a lot more.
  • In the second one, we talk about my favourite topic: Double-diffusive mixing!

And then there are three advent specials, each approximately 10 minutes long, talking about being at sea on research cruises (1. Advent on why it’s awesome to be at sea, 2. Advent on what is being measured on oceanographic cruises, 3. Advent on what it’s like at sea).

And now I am eagerly awaiting the new and exciting stuff that will happen on Treibholz in 2019, looking forward to listening to more oceanography with Maxie and Ronja!

Experiment: Oceanic overturning circulation (the slightly more complicated version)

The experiment presented on this page is called the “slightly more complicated version” because it builds on the experiment “oceanic overturning circulation (the easiest version)” here.

Background

One of the first concepts people hear about in the context of ocean and climate is the “great conveyor belt”. The great conveyor belt is a very simplified concept of the global ocean circulation, which is depicted as a single current that spans the world oceans (see Figure 1 below). In this simplified view of the global circulation, water flows as a warm, global surface current towards the North Atlantic, where it cools, sinks and finally returns southward and through all the world oceans near the bottom of the ocean. Water is transported back to the surface through mixing processes and starts over its journey again as a warm surface current. While in reality some part of the conveyor belt is wind-driven and many processes come to play together, a large part of the circulation can be explained by the water sinking due to cooling at high latitudes.

Conveyor_belt

Figure 1: The great conveyor belt. My sketch on top of a map from http://www.free-world-maps.com

This can be very easily represented in a demonstration or experiment.

Materials

What we need for this experiment:

  • 2 gel pads for sports injuries, one hot, one cold
  • red and blue food coloring
  • a clear plastic container to act as tank
  • a pipette or drinking straws to disperse drops of dye
  • dye crystals to show the circulation. Can also be drops of a different color dye.
Running the experiment

The container is filled with lukewarm water.  On the “poleward” end, we add the cold pad, the warm one at the “equatorward” end of the tank.

Blue dye is tripped on the cold pad to mark the cold water, red dye on the warm pad as a tracer for warm water.

overturning

Thermally-driven overturning circulation: Warm water flowing near the surface from the warm pad on the left towards the right, cold flow from the cool pad at the bottom right to left.

A circulation develops. If you drop dye crystals in the tank, the ribbon that formed gets deformed by the currents for yet another visualization of the flow field.

overturning2

Thermally-driven overturning circulation. In the middle of the tank you see a ribbon of dye, caused by falling dye crystals, being transformed by the currents in the tank.

Here is the video:

What observations to make

Besides the obvious observation, watching, there are a couple of things you can ask your audience to do.

For example, if they carefully slide their fingers up and down the side of the tank, they will feel the warm water near the surface and the cold water at the bottom.

If you have a clear straw, you can use it as plunging syphon to extract a “column” of water from the middle of the tank, showing again the stratification of red, clear, blue.

If you put little paper bits on the surface, you will see them moving with the surface current.

Can you come up with more?

Who can I do this experiment with?

Someone recently asked me whether I had ideas for experiments for her course in ocean sciences for non-majors. Since most of the experiments I’ve been showing on this blog were run in the context of Bachelor or Master oceanography-major courses, she didn’t think that the experiments were as easily transferable to other settings as I had claimed.

So here is proof: You can do pretty complex experiments with non-university level students. To prove my point, let’s go to a primary school.

IMG_3219

Me running the overturning experiment with a primary school class in 2012.

IMG_3214

The overturning experiment as seen by the teacher (2012).

Of course, you can adapt this experiment to different levels of prior knowledge. For example, in the primary school, I introduced this experiment by showing pictures of lions and penguins and other animals that the pupils knew live in warm or cold climates, and we talked about where those animals live. In the end this aimed at how temperatures are a lot colder at the poles than at the equator. This is the differential heating we need for this experiment to work. While this is something that I felt the need to talk about with the primary school kids, this can be assumed as a given with older students (or at least that is the assumption that I made).

With the university-level courses, one of the points that I made sure came up during the discussion are the limitations of this model. For example that we apply both heating and cooling over the full depth of the water column. How realistic is that? Or the fact that we heat at one end and cool at the other, rather than cooling on either end and heating in the middle?

Let me zoom in on something in the picture above.

IMG_3214_2

Curious features in the thermal conveyor experiment. Do you know what this is about?

Do you see these weird red filaments? Do you think they are a realistic part of the thermal circulation if it was scaled up to a global scale?

Of course not. What we see here is salt fingering. This is a process that is caused by the different diffusivities of heat and of the red dye. And while it is pretty large scale in our small tank, you cannot scale it up just like that when talking about the real ocean. And it is also really difficult to get rid of salt fingers for this experiment, in fact I haven’t yet managed. But I am open to suggestions! :-)

Another point that I would talk about with university-level students that I would probably not bring up with primary school kids (- although, why not if I had more time than just those 45 minutes per class?) is that ocean circulation is driven by more than just differential heating. Even when just considering the density-driven circulation, that is additionally influenced by changes in salinity. Put that together with wind-driven circulation and we are starting to talk about a whole new level of complicated…

But anyway. My point is that even primary school kids can benefit from doing this kind of experiments, even if what they take away from the experiments is not exactly the same as what older students would take away.

Discussion
As with every experiment, it is a lot easier for an “expert” to observe what he or she wants to observe, than for their students.
The left column in the figure above is taken from an instruction for educators and parents of primary school kids I wrote a while back. When taking the pictures I was aware that the quality in terms of signal-to-noise was not very good (and in fact people [i.e. my parents] even told me). In my defense: The pictures of this experiment I shared on this blog are all less noisy, and I even explicitly addressed and discussed some of the noise! But still, only when reading that article today I fully appreciated how difficult it might be to see the signal through the noise (especially when the speech bubbles in the picture don’t even point exactly to the right places!), and how distracting it probably is when I implicitly assume that students see the signal and even start discussing the noise more than the signal.

So what we see above are, in the left column, the pictures I originally shared in that manual. In the middle column, I’m showing what I see when I look at the pictures on the left. And then in the right column I’m drawing what people might be seeing when looking at that same experiment. No idea if that really is what students see, but looking at the pictures now, there is actually no reason why they should see what I see. See?
One indicator of the signal-to-noise ratio and of what students actually perceive as important can be found in the three little essays the primary school kids show in the picture above wrote after my visit in December 2012: Two out of the three explicitly mention that I used a yoghurt beaker as heating on the one end of the tank (while the third only refers to a beaker). Clearly that seems to have been a very important observation to them.
So what do we take away from this? I, for one, am going to make sure to pay more attention to the signal-to-noise ratio when showing demonstrations. And if there happens to be a lot of noise, I am going to make it a lot clearer which part of the signal is actual signal, and which is noise. Lesson learned.

P.S.: This text originally appeared on my website as a page. Due to upcoming restructuring of this website, I am reposting it as a blog post. This is the original version last modified on January 13th, 2016.

I might write things differently if I was writing them now, but I still like to keep my blog as archive of my thoughts.

Outreach activity: How do we make climate predictions?

This text was written for GeoEd, the education column of EGU’s blog, and first appeared there on Nov 27th, 2015.

In my second year studying physical oceanography, I got a student job in an ocean modelling group. When I excitedly told my friends and family about said job, most of them did not have the slightest idea what I might be doing. Aside from the obvious and oh-so-funny “you are a model now?!”, another common reaction was “modelling – with clay?” and the picture in those people’s head was that of an ocean model resembling the landscape in a miniature train set, except under water. And while there are many groups seeking to understand the ocean by using simplified versions of the ocean or ocean regions, simplified geometries, selected forcings acting on it, etc – this is not the kind of model I was supposed to be working with.

Talking about climate models with the general public

Explaining to a laymen audience what a climate model is a daunting task. We have all seen the images of a region divided into smaller and smaller squares as a visualization of boxes which represent a grid on which a set of differential equations is solved, yielding a solution for each of the boxes (See Figure 1). But do we really expect everybody we show this to grasp the idea of how this might help to understand climate if they don’t have the background to understand what a differential equation is, let alone how it has been discretised and programmed and is now being solved? From my experience it is very difficult to keep people interested and captivated using this approach and, unless they already have a pretty solid background, it is unlikely they will actively engage in the topic and ask clarifying questions.

Image01_cropped

Figure 1: Modelled sea surface temperature of the ocean off Mauritania, North-West Africa. Depending on the model resolution, smaller and smaller features in the sea surface temperature are resolved by the model. Still, even the most complex model is still nowhere near as complex as reality.

A new approach: Let them experience the process of building a model!

I therefore suggest we use a different approach. Instead of concentrating on explaining the mechanics of an ocean model, let us focus on letting people experience the idea behind it by using a “mystery tube” to represent the climate (or whatever process we want to model) and have the audience build their own “models”.

The mystery tube is all over the internet. I have not been able to find the original source but let’s look at what it is:

Basically, we have a tube that is closed off at the top and at the bottom (See Figure 2). Four pieces of string come out of it. When you pull one out, another one gets pulled into the tube. So far, so good. But the pattern of which string gets pulled in when another one gets pulled out suggests that there is something more going on inside the tube than just two pieces of string going in on one side and coming out at the other. So, how do we figure out what is going on? Some of you may have already seen a possible solution to the problem. Others might find one as soon as they’ve gotten their hands on a mystery tube and pulled on the strings a couple of times. Others might need their own tube and pieces of string to play around with before they are reasonably confident that they have an idea of how the mystery tube works.

Image02

Figure 2: A very non-fancy mystery tube: A paper kitchen towel roll with two pieces of curly ribbon going through. But what goes on inside? Still a mystery!

If you were to use mystery tubes in outreach (or with your friends and family, or – always a hit – with your colleagues), it is in fact a good idea to have a couple of “blank” tubes and pieces of string ready and let everyone have a go at building their own mystery tube that reproduces the functionality of the original one. Ideally, as you will see below, you would have more than just the bare necessities ready and also offer flat washers, springs, paper clips or any other distracting material that might or might not be inside the mystery tube.

Why offer “distractor” materials? Because we are trying to understand how people come up with climate models, remember? The original mystery tube represents the process we want to model. We do not know for sure all the important components of that process, and therefore do not know what needs to be included in the model, either.

— SPOILER BELOW! If you want to solve the mystery tube mystery yourself, do not read on! —

Now, in the instructions on the internet the two pieces of string are connected inside the tube by way of a ring through which they are both fed. When I first build my own mystery tube, I was too lazy to search for a ring to connect the pieces of string, so I just crossed the two threads over. After all, the ring wouldn’t be visible in the final product, and the function would remain the same anyway!

From empty cardboard kitchen towel rolls to climate models

Which brings me to the main point of this blog post, first made by my friend and fellow outreach enthusiast, Dr. Kristin Richter (http://kristinrichter.info, currently University of Innsbruck, Austria), who is always my first stop when wanting to bounce ideas for demonstrations or experiments off: This is exactly why modelling climate is so difficult! We can build a perfectly working mystery tube but unless we cut open the original one we will never know whether our solution is the same as the one in the original mystery tube, i.e. whether there is a ring inside, or a paper clip, or the two pieces of string are just crossed.

You might argue we could find out what is inside the original mystery tube by other means, for example by shaking it and listening for rattling, by weighing it, or by many other methods. Yet, can we ever be sure we know exactly what is inside? And more importantly, would we even think of shaking or weighing the mystery tube if we weren’t specifically looking for what connects the two pieces of string? And are we really sure we are reproducing the full functionality of the original mystery tube? Maybe the original ring has a blade on the inside, so after a certain number of experiments one of the strings will be cut? Or maybe there is something else inside that will happen eventually, but that we cannot yet predict because our mystery tube, while reproducing what we observed from the original tube, just does not include that element.

The same goes for climate models, of course. We can reproduce what we observe reasonably well. Assuming we know of all “parts” of the climate and how they work together, we can make a prediction. But the climate is a lot more complex than a mystery tube. Of course, climate models are based on physical principles and laws and not just best fits to observations. Yet, in many places decisions have to be made for or against including details, or for representing them by one parameterisation and not another.

Can we ever know for sure what the future will bring?

So does that mean we should give up on making models of the climate because, while we might be able to reproduce the status quo, prediction is impossible? Absolutely not! But we need to be aware of the possibility of feedback mechanisms that might become important once a threshold has been crossed or tipping points (like when a hypothetical blade inside the ring will have cut through one of the pieces of string). If we are aware that there might be more to the mystery tube than just the pattern of how strings move which we observed at the beginning of this post, we can watch out for signs of other components. Like listen intently to the noise the string makes when gliding through the mystery tube, or listening for rattling when you shake the tube, or monitor the strings for wear indicating there might be a hidden sharp edge somewhere.

And the same obviously goes for climate. We need to monitor all observations and look closely at any deviation of the observations from our model. We need to come up with ideas of processes, which might become important under different conditions and look out for signs that they might already start to occur. We need to be aware that processes we haven’t seen evidence for yet might still be important at a different parameter range.

Once we have gone through all this with our audience, I bet they have a better idea of what a modeller does – even though they still might not have a clue what that means for the average day at work. But typically, people find the mystery tube intriguing, and you should definitely be prepared to answer a lot of questions about what your model does, how you know whether it is right, what processes are included and what are not, and voilà! We are talking about how to make climate predictions.

P.S.: This text originally appeared on my website as a page. Due to upcoming restructuring of this website, I am reposting it as a blog post. This is the original version last modified on November 27th, 2015.

I might write things differently if I was writing them now, but I still like to keep my blog as archive of my thoughts.

Four steps to great hands-on outreach experiences

Part 1 and 2 of this post were first posted on the EGU’s blog on Jan 29, 2016, and Feb 29, 2016, respectively.

Part 1 gives four steps to outreach activities, part 2 uses an example to further illustrate those four steps.

Part 1: For the best hands-on outreach experiences, just provide opportunities for playing!


“For the best hands-on outreach experiences, just provide opportunities for playing!” I claim. Seriously? You wonder. We want to spark the public’s curiosity about geosciences, engage the public in thinking about topics as important as sea level rise or ocean acidification, and provide learning experiences that will enable them to take responsibility for difficult decisions. And you say we should just provide opportunities for them to play?

Yes. Hear me out. Playing does not necessarily equal mindlessly killing time. Kids learn a lot by playing, and even grown ups do. But if you prefer, we can use the term “serious play” instead of just “play”. Using the term “serious play” makes it clear that we are talking about “improvising with the unanticipated in ways that create new value”, which is exactly what outreach should be doing: getting people intrigued and wanting to understand more about your topic.

So how would we go about if we wanted to create outreach activities which gave the public opportunity to play in order to lure them into being fascinated by our field of science? There are several steps I recommend we take.

  1. Identify the topic nearest and dearest to your heart

Even if your aim is to educate the public about climate change or some other big picture topic, pick the one element that fascinates you most. If you are really fascinated by what you are showing, chances are that the excitement of doing the activity will carry over to your audience. Plus, once you have this really great activity, you will likely be asked to repeat it many times, so you had better pick one that you love! J

Me, I am a physical oceanographer. I care about motion in the ocean: Why and how it happens. Consequently, all of my outreach activities have people playing with water. Sometimes at different temperatures, sometimes at different salinities, sometimes frozen, sometimes with wind, but always with water.

  1. Find an intriguing question to ask

Questions that intrigue me are, for example, “do ice cubes melt faster in fresh water or in salt water?”, “how differently will ice look when I freeze salt water instead of fresh water?” or “what happens if a stratification is stable in temperature and unstable in salt?”. Of course, all these questions are related to scientific questions that I find interesting, but even without knowledge of all the science around them, they are cool questions. And they all instantly spark follow-up questions like “what would happen if the ice cubes weren’t floating, but moored to the ground?”, “what if I used sugar instead of salt?”, “wait, does the food dye influence what happens here?”. And all of those questions can be investigated right then and there. As soon as someone asks a question, you hand them the materials and let them find the answer themselves. That is why we talk about hands-on outreach activities and not demonstrations: It is about actively involving everybody in the exploration and wonder of doing scientific experiments!

  1. Test with family, friends and colleagues

Many, if not all, the outreach activities I am using and promoting have been tested on family, friends and colleagues before. You know that you have found an intriguing question when your friends sacrifice the last bit of red wine they brought at a Norwegian mountain cabin, to use as stand in for food dye in an experiment you just told them about, because they absolutely have to see it for themselves!

By the way, this is always good to aim at with outreach activities: always try to keep them easy enough to be recreated at a mountain cabin, in your aunt’s kitchen, at the beach or anywhere anyone who saw it or heard about it wants to show their friends. People might occasionally have to get a little creative to replace some of the materials, but that’s part of the charm and of the inquiry we want!

  1. Bring all the materials you need, and have fun!

And then, finally, Just Do It! Bring all your materials and start playing and enjoying yourself!

But now they can play with water and dye. That doesn’t mean they understand my research!

True, by focussing on a tiny aspect you won’t get to explain the whole climate system. But you will probably change the mindset of your audience, at least a little bit. Remember, you studied for many years to come to the understanding you have now, it is not a realistic expectation to convey all that in just one single outreach occasion. But by showing how difficult it is to even understand one tiny aspect (and how much there is still to discover), they will be a lot more likely to inquire more in the future, they will ask better questions (to themselves or to others) and they will be more open to learning about your science. Your activity is only the very first step. It’s the hook that will get them to talk to you, to become interested in what you have to say, to ask questions. And you can totally have backup materials ready to talk in more depth about your topic!

But what if it all goes horribly wrong during my activity?

The good thing is that since you are approaching the whole hands-on outreach as “get them to play!” rather then “show them in detail how the climate system works”, there really isn’t a lot that can go wrong. Yes, you can mess up and the experiment can just not show what you wanted to show. But every time I have had that happen to me, I could “save” the situation by engaging the participants in discussing how things could work better, similar to what Céline describes. People will continue to think about what went wrong and how to fix it, and will likely be even more intrigued than if everything had worked out perfectly.

But what if I am just not creative enough to come up with new ideas?

First, I bet once you start playing, you will come up with new ideas! But then of course, we don’t need to always create outreach activities from scratch. There are many awesome resources around. EGU has its own large collection in the teacher’s corner. And of course, Google (or any websearch of your choice) will find a lot. And if you were interested in outreach activity in physical oceanography specifically, you could always check out my blog “Adventures in Oceanography and Teaching”. I’m sure you’ll find the one activity that you will want to try yourself on a rainy Sunday afternoon. You will want to show your friends when they comes over to visit, and you’ll tell your colleagues about it. And there you are – you found your outreach activity!


Part 2: One example of how playing works in outreach activities!


In part 1, I talked about hands-on outreach in very general terms, and identified four steps to great outreach. Today, I want to talk about those four steps in more detail, using one of my favourite outreach activities as an example.

Step 1. Identify the topic nearest and dearest to your heart

Me, I am a physical oceanographer. I care about motion in the ocean: Why and how it happens. Consequently, all of my outreach activities have to do with water. Sometimes at different temperatures, sometimes at different salinities, sometimes frozen, sometimes with wind, sometimes with ships, but always with water.

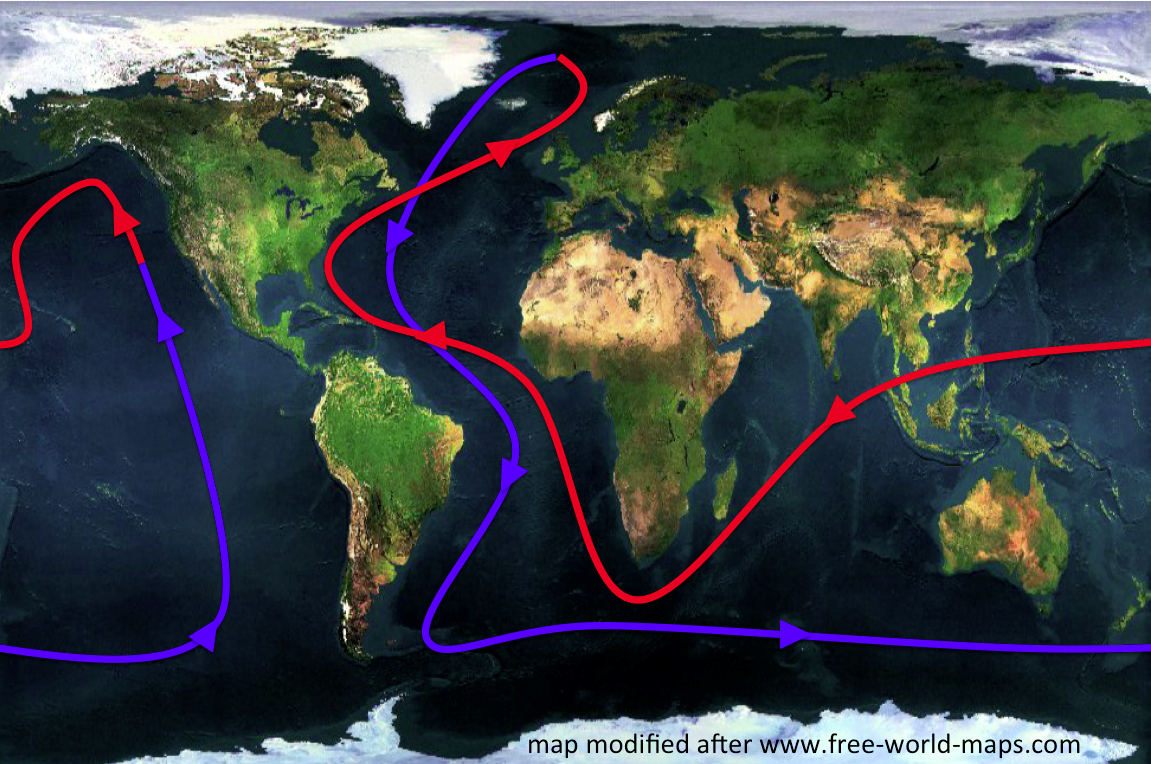
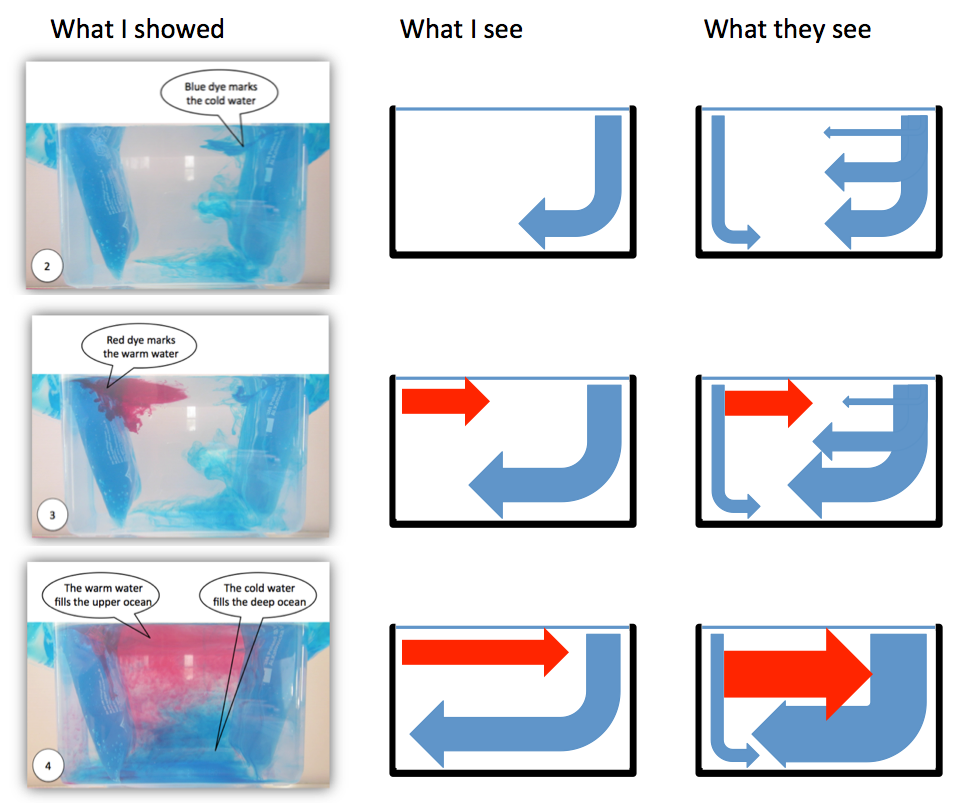
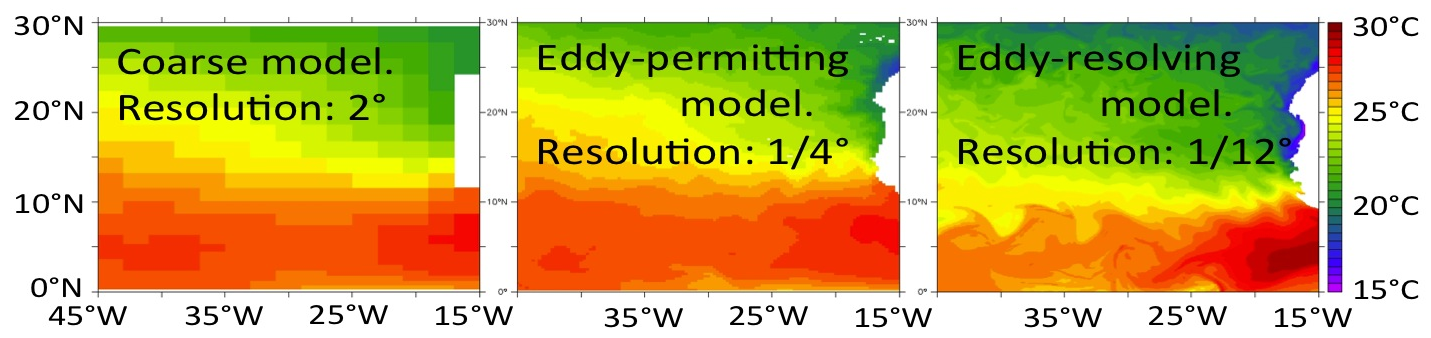
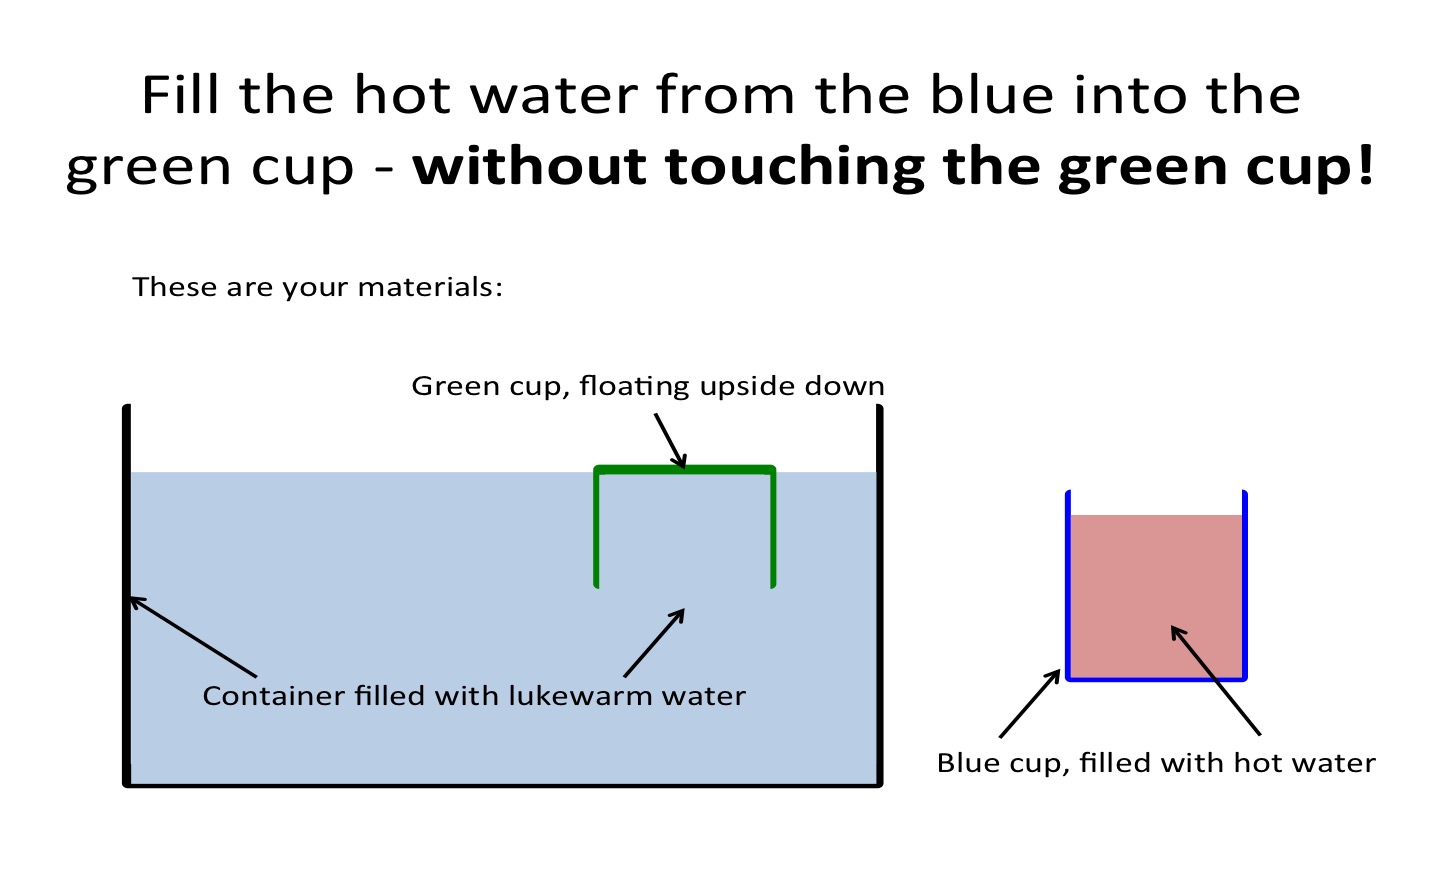
Today, let’s concentrate on thermohaline circulation as the topic we want to get people interested in. That sounds like a lot, so lets break it down: we want to know how oceanic circulation is influenced by both heat and salt in the ocean. To boil this down to one short activity, let’s take away the ocean (and with that all the complicating influences of Earth’s rotation, or topography of ocean basins) and only look at what heat and salt do with water in a tank. In fact, let us focus on different temperatures at first. The easiest way to do this is to introduce water of one temperature into a volume at a different temperature, this way we don’t have to deal with the heating or cooling processes.

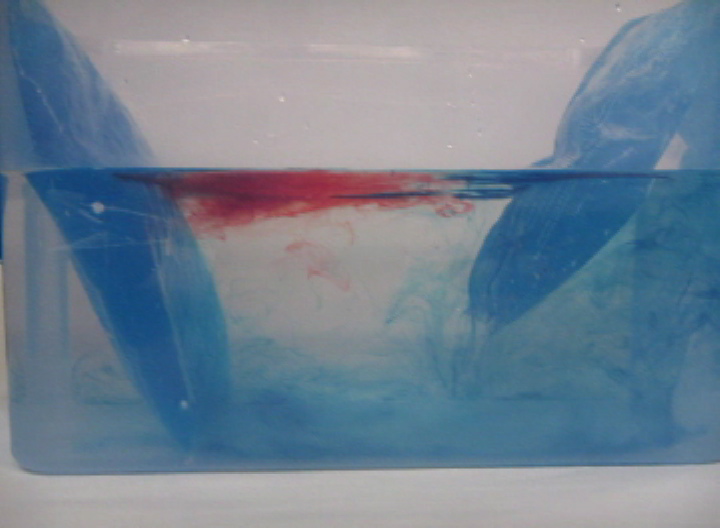
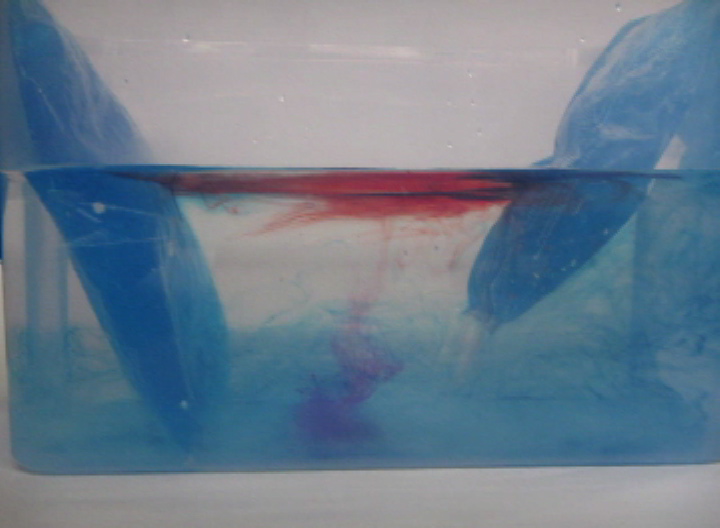
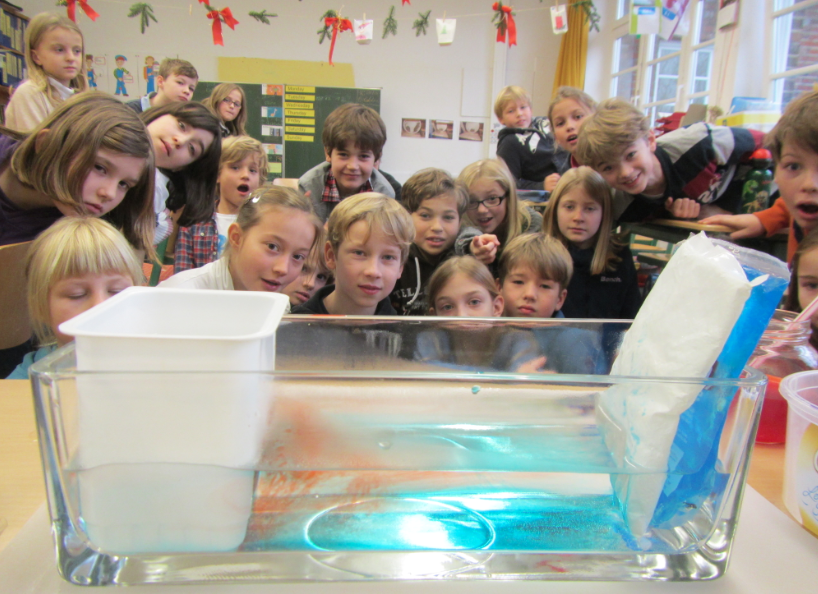
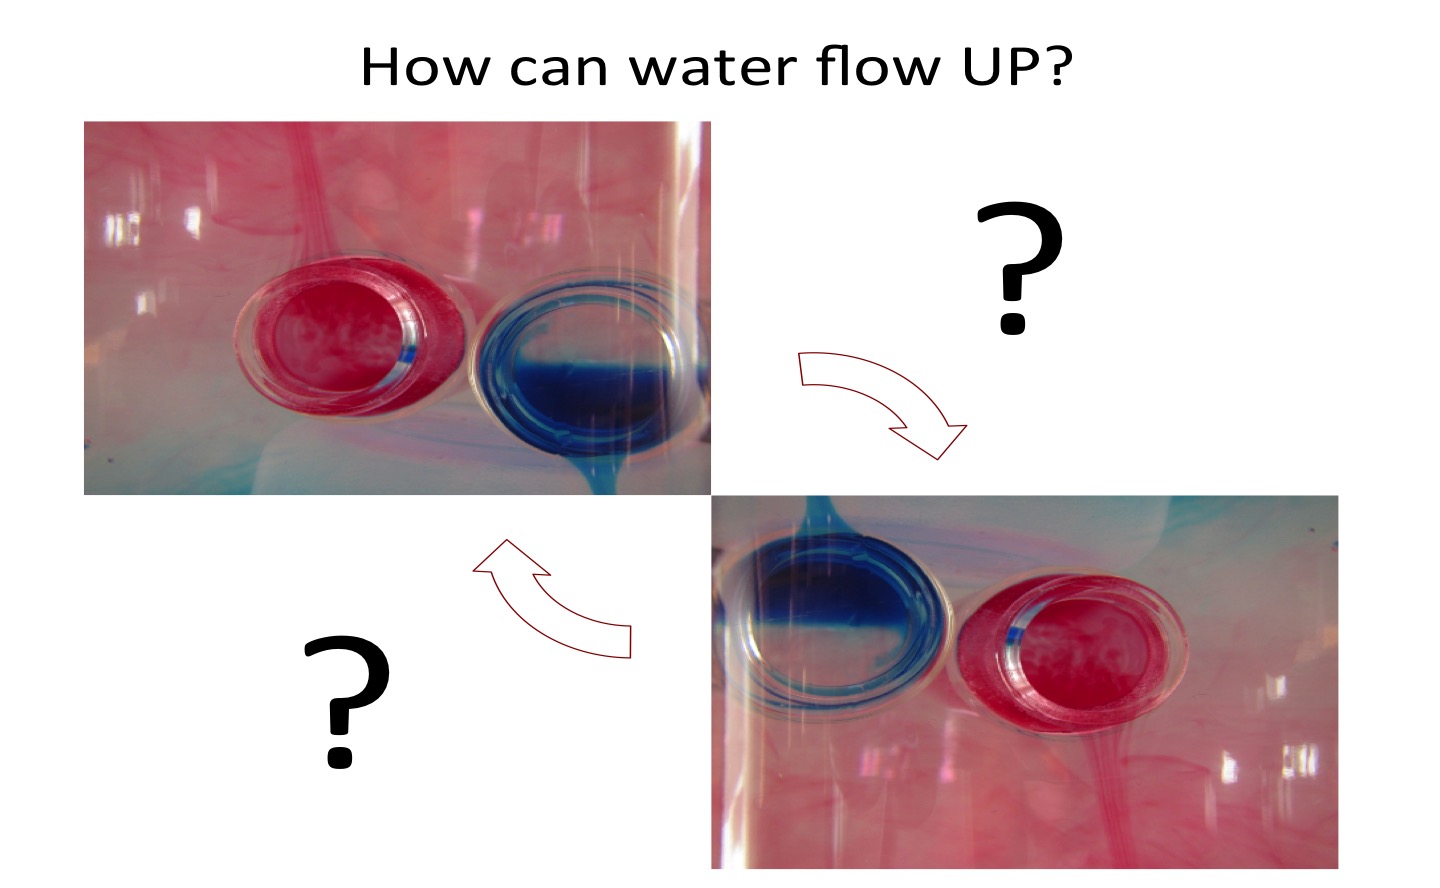
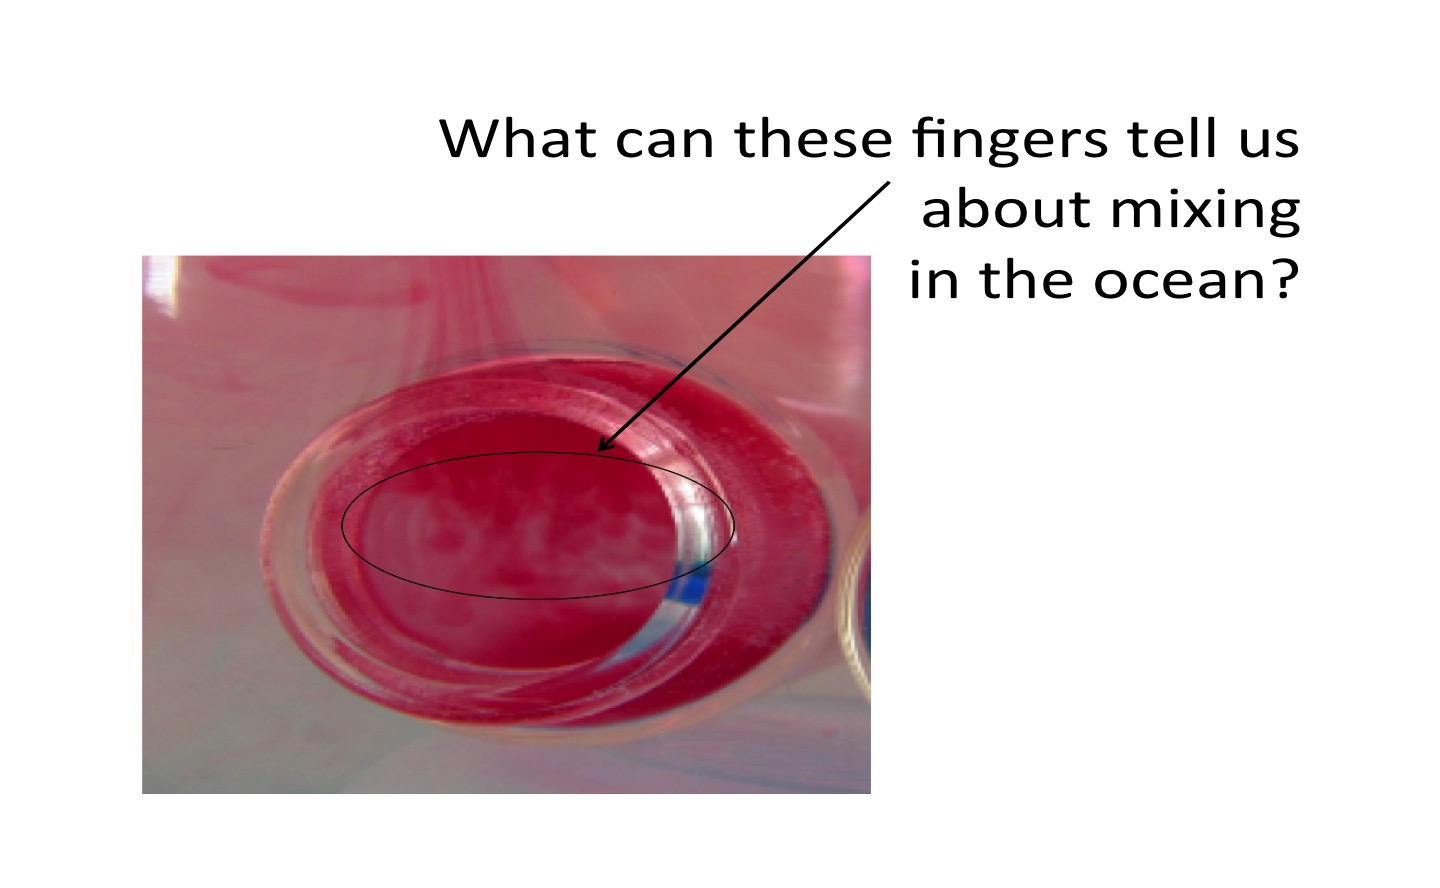
Introducing water can mean pouring it into the larger tank, which will lead to some kind of stratification (provided your temperatures are different enough). In order to see the stratification, it always helps to have food dye in the water you are introducing (always put food dye in the smaller volume of water, makes it a lot easier to see the contrast!). To make things most interesting, it might be nice to show two cases simultaneously: pouring hot water and cold water into a lukewarm tank. And, since we see that the hot water forms a layer on top of the lukewarm water and the cold water at the bottom, wouldn’t it be much more fun to introduce them both somewhere at medium height and see what happens?

2_Slide1

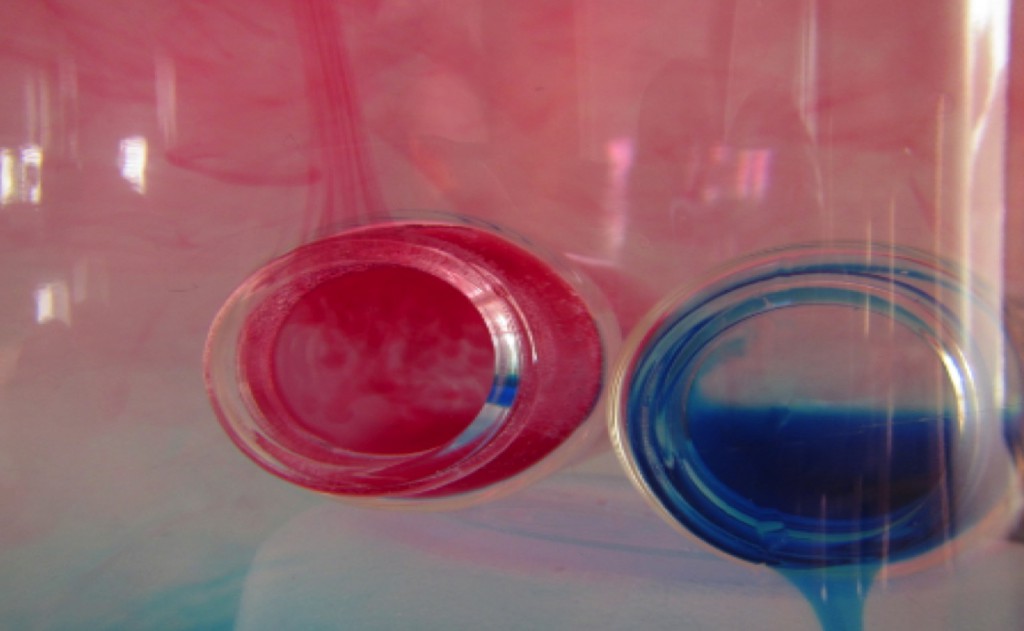
Two bottles, one filled with hot water (dyed red) and one filled with cold water (dyed blue) in a larger container of lukewarm water.

Step 2. Find an intriguing question to ask

Depending on who you want to reach as your main audience, you might need to ask different questions. For some audiences, the focus needs to clearly be on your activity’s connection to climate. For other audiences, the questions can be a simple “Wow, that looks weird. Can you figure out what is going on here?”. Depending on the context I was doing my activity in, I could for example ask:

  • Why is the bottle with the red water “pouring up”? The audience I might ask this question are for example kids in a school setting that I am wanting to get excited in science in general. 2_Slide2
  • How can I fill the green cup with hot water without touching it? Audience here could be the general public at a science fair, and if someone manages to fill the green cup, they win a sticker. This questions definitely makes people want to give it a try!2_Slide3
  • What can these fingers tell us about how water mixes in the ocean? This question is for an audience that already knows a lot about the ocean and physical processes in it, for example university students, or a very interested general public.2_Slide4
  • In the subtropical gyres you have a strong salinity stratification. How can nutrients get to the surface ocean? This question is closely related to the one before, but here the element of play isn’t as prominent. So this would be for an audience that knows a lot about ocean physics and biogeochemistry already, like university students or even colleagues at scientific conferences.2_Slide5
  • What drives global ocean currents? This is again a question that you might ask the general public since on one hand not a lot of knowledge about ocean physics is required, and it is on the other hand very easy to see the connection between your activity and the ocean.

    2_Slide6

    Map modified after free-world-maps.com

Step 3. Test with family, friends and colleagues

This step is important for several reasons.

First, you want to work out (most of) the kinks in the activity before using it in front of a large audience. This includes

  • knowing what kind of materials you actually need to run it (For example, I tend to forget that I not only need large containers of water that are prepared at the right temperatures and salinities for several repeats of the experiment, but that in order to set up the experiment for repeats, I need somewhere to get rid of the water from previous experiments),
  • seeing people get really excited about the activity (which is a good memory to calm you down when you get nervous about doing the activity in public for the first time), or, if the aren’t, a good time to tweak the activity a little.
Step 4. Bring all the materials you need, and have fun!

And there you are – ready to do your outreach activity! For your big day, this is what I would recommend:

  • It sounds lame, but you should have a good packing list that includes not only stuff that you need to run the activity, but also stuff that you need to store stuff in on your way home, when everything is wet and full of food dye.
  • If you are about to play with a lot of food dye or other staining substances, consider not wearing your favourite pair of white jeans. Consider also whether your scarf will be constantly hanging in your water tank getting wet, and whether your hair might get caught somewhere.
  • Bring a friend to do the activity with you. It’s more fun, and it really takes away a lot of stressors if there are two people there (Run out of water? No worries, one of you can run and fetch more water while the other talks to people who still want to know what is going on. Question you have no idea how to answer? She will know, or you can look it up together later. Need the loo? How great is it that you don’t have to pack all your stuff and take it with you? ;-))
  • Have someone you know for sure is interested in your activity show up early on to look at it and talk to you about it. Nothing makes it easier for other people to approach and join you in your conversation and activity as someone who is already there and obviously excited. (You can also use your friend mentioned above to play this role until things get going)
  • Bring “backup materials”. Even if your activity is only very vaguely related to your research, bring a current poster of your research (maybe not the A0 version, but A3 or A4) and anything you typically show when talk about your research (Maps? Figures? Instrumentation?). When you get talking to people, chances are you will get talking about how your activity is related to bigger research questions, and you will want to be able to talk about them.
  • And bring a different kind of “backup materials”: Bring pictures and/or movies of your experiment to show what it should have looked like in case the freezer that was supposed to have turned your ice cube tray full of water into ice cubes over night turns out to be a cold room.
  • Take pictures. This one is super important, and I always forget about it in the heat of the moment. You constantly need that picture with you and a bunch of kids looking at your activity for grant proposals or for end-of-year reports!
  • Last but not least: Have fun and take this as a great opportunity to play! Discover features in your activity that you have never noticed before, and, together with your audience, “improvise with the unanticipated in ways that create new value” – I guarantee that it will happen!

Do you have stories of your outreach to share? Any experiments we should all know about? I’d love to hear from you, please leave a comment below!

P.S.: This text originally appeared on my website as a page. Due to upcoming restructuring of this website, I am reposting it as a blog post. This is the original version last modified on February 1st, 2016.

I might write things differently if I was writing them now, but I still like to keep my blog as archive of my thoughts.

Using art in your science teaching and outreach. The why and the how.

This post was first published at the EGU’s blog’s “educational corner” GeoEd, in March 2016 (link here).

Sometimes we look for new ways to engage our students or the general public in discussions about our science. Today I would like to suggest we use art! Someone recently told me about her work on “STEAM”, which is STEM+Arts and apparently big on the rise. While I had never heard about it before, and initially found the idea a bit weird and artificial, there are certainly many occasions where thinking about topics in a more comprehensive way than just through disciplinary lenses could be of great benefit, both to get a fuller view of what is going on, as well as to maybe reach people in a different way, and therefore reach people that might not necessarily be interested in either of the parts by itself.

There are many different kinds of art that we can use in STEM teaching and outreach, ranging from art that uses science as its central theme to art that just happens to be displaying something we have a scientific interest in. And while in this blog post “art” is taken to mean visual art, you can think this much more widely and include music, theatre, anything you can think of! Dream big!

Art that incorporates scientific data

One example of art that uses science as a central theme and that is very well suited for our purposes is the amazing art of Jill Pelto, who communicates scientific research through art. What that means is that she takes graphs of recent dramatic changes in the climate system, like sea level rise or melting glaciers, and uses them in her art as part of the image. For example, a graph of the global average temperature is integrated on the boarder between a burning forest and the flames leaping into the smoky sky. Which you only notice when you look carefully, similarly to the boundary between the school of clown fish and the forest of anemones moving in the waves, showing the declining ocean pH which threatens this ecosystem (see figure below). Brian Kahn describes Jill Pelto’s paintings as “Trojan horse for science to reach a public that doesn’t necessarily think about data points and models”.

And that is a great approach to using this art. But how else could we use art like this in teaching and outreach?


Jill+Pelto+Clown+Fish+Web+(1)

“Clown Fish” by Jill Pelto. Used with permission. Click on the image to go to Jill Pelto’s gallery and discover more amazing artwork!

These kind of images I could imagine using in courses where students are to investigate a scientific topic in a project. Each group of students could be handed a different image, and they could be asked to figure out as much as possible about the topic and present it back to their peers. I would imagine that giving students a data set in such a visually appealing form would provoke an emotional connection and response much more easily than if they were presented with “just” the data. In the final exhibition, the art would work as great eye catchers to lure visitors into a topic.

I could also imagine using Jill Pelto’s art in a science outreach workshop. There, I would ask participating PhD students or scientists to take the one time series (or any other visual representation they have of their data that shows the most important part of their story) and, inspired by the art they saw, integrate their data into an eye-catching display that tells their story for them.

Wow, this really makes me want to do this for my own research!

Art that visualizes scientific results

The best-known example of art that tells scientific stories is Greg Johnson’s “Climate change science 2013: Haiku“. A poster of all 20 illustrations is up in my office (Thanks, Joke and Torge!) and I can tell you – it is a great conversation piece! The haikus and illustrations provide just enough information to spark curiosity, so I often find myself discussing climate change with my (non-climate scientist) colleagues. Clearly, the haikus would also work as excellent conversation starters in outreach!

full_01_cover_text-563x421

Picture from http://www.sightline.org/2013/12/16/the-entire-ipcc-report-in-19-illustrated-haiku/, used with permission

In teaching, I would use Greg Johnson’s illustrated haikus to break the IPCC report’s summary for policy makers down into its chapters, and hand out one illustration per group. Depending on what kind of students I was teaching, I would either ask them to read the corresponding summaries, or browse the chapter, or read one of the original articles cited in that chapter. Or even ask them to find articles that might shed a different light on the (obviously oversimplified) message of the haikus. What kind of evidence would they want to see to shoot down those messages or in support of it? Those kind of thoughts are a very good practice for their own research when they always need to consider whether the conclusions they draw are the only possible ones.

Here, again, the art helps to make very complex science easily approachable, and would again be awesome as eye catcher in an exhibition where student groups present their work to each other. (If you are worried about all the posters you are supposed to be printing, check out this post for a cheap and easy solution).

Or the haikus could be used as inspiration when you ask your students to read articles and summarize them in a haiku plus drawing. This would be great practice to get to the point, and also it would be great practice for outreach. How cool would it be if your students had a piece of art and a short poem summarizing their theses?

For more inspiration along those lines, check out Greg Johnson’s blog.

Art that incidentally shows science we are interested in

Alternatively to looking at art that doesn’t explicitly focuses on science as its topic, but which can still be used to discuss science.

One example is given in the TED talk “the unexpected math behind Van Gogh’s `Starry Night´” by Natalya St. Clair, where the painting is deconstructed and put in the context of the development of mathematical theories for turbulence. I have linked the video below and it is totally worth watching!

[youtube PMerSm2ToFY]

The video could serve as a great first exposure to turbulence in a physics class and would make for a very interesting assignment in a flipped setting. It could also be watched in art class to help underline that art is a “serious” subject and not just a bit of splashing with paint (or whatever prejudices your audience might have).

Or you could ask your students to attempt a similar interpretation of a different picture. For example when talking about different kinds of waves in your oceanography class, ask your students to browse a gallery of famous seaside paintings, online or “for real”, pick one painting and interpret the state of the sea, the shape of the clouds, the color of the light, to learn as much as possible about the weather conditions depicted in the painting. Always interesting, too: Check for consistency of wind direction from all the flags and sails and flying hair!

Alternatively, you could use a collection of pictures to talk about how knowledge in your field developed (for an example of how this could work for soil, see Laura Roberts-Artal’s blog post.

See – so many ways to include art in your science teaching and outreach to capture new audiences’ interest or just look at your topic from a different angle!

How would you use art in your teaching and outreach? Let us know in the comments below!

P.S.: This text originally appeared on my website as a page. Due to upcoming restructuring of this website, I am reposting it as a blog post. This is the original version last modified on February 16th, 2016.

I might write things differently if I was writing them now, but I still like to keep my blog as archive of my thoughts.