Last week I got one of the coolest emails I have ever received: Someone had found my blog while googling for the salt content of seawater in order to use it to make bread, and he sent me a couple of pictures the resulting bread! Of course, I asked if I could share it as a guest post on my blog, so here we go (Thanks, Martin Haswell, for this unique and inspiring contribution! See, everybody? Real-world impact of science blogging!):
Making bread using seawater
There is nothing like a challenge from your best friend, to do something that you’ve never done before but might just work. In my case, make bread using sea water.
Jim has a recipe in his book called “Jones Beach Bread” in which he uses seawater instead of house water plus salt to make the dough. Knowing that we both used the ‘no-knead’ recipe and that I had access to a beach with clean water, Mandy challenged me to follow this recipe, and this is how it went.
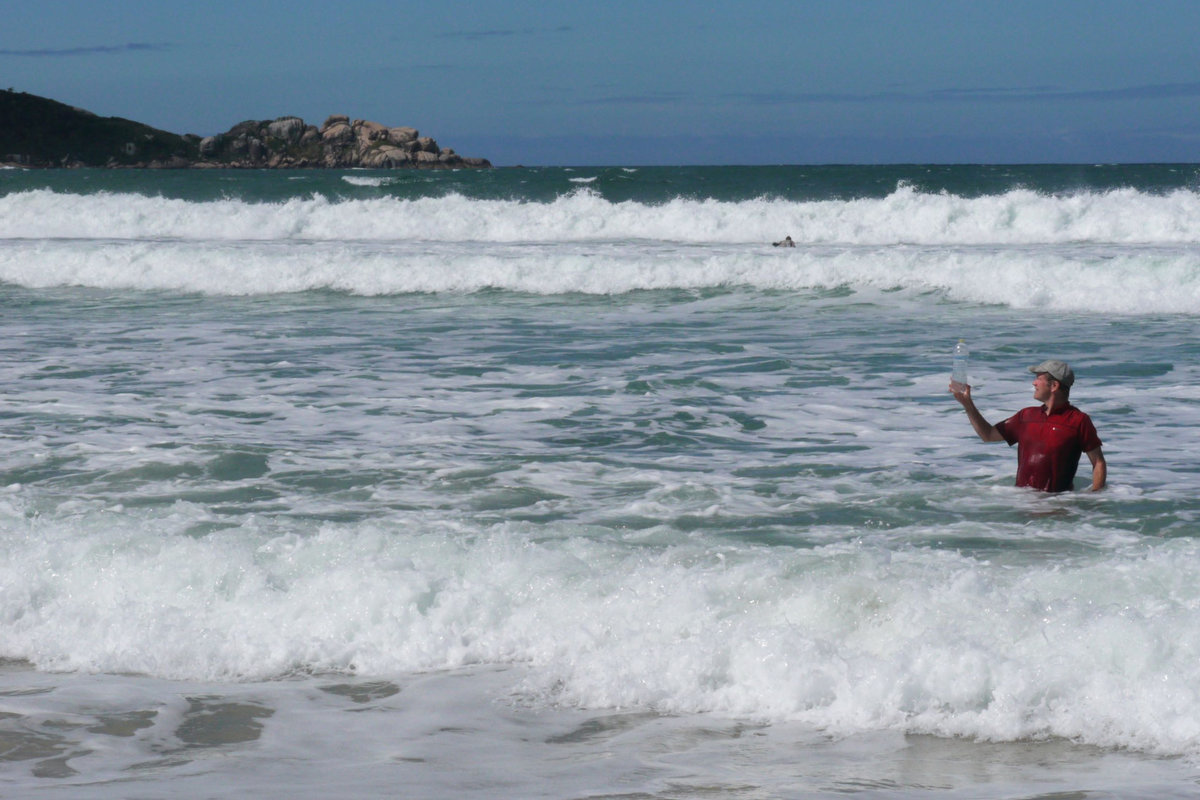
Martin collecting seawater on the beach, far enough out to miss most of the turbidity
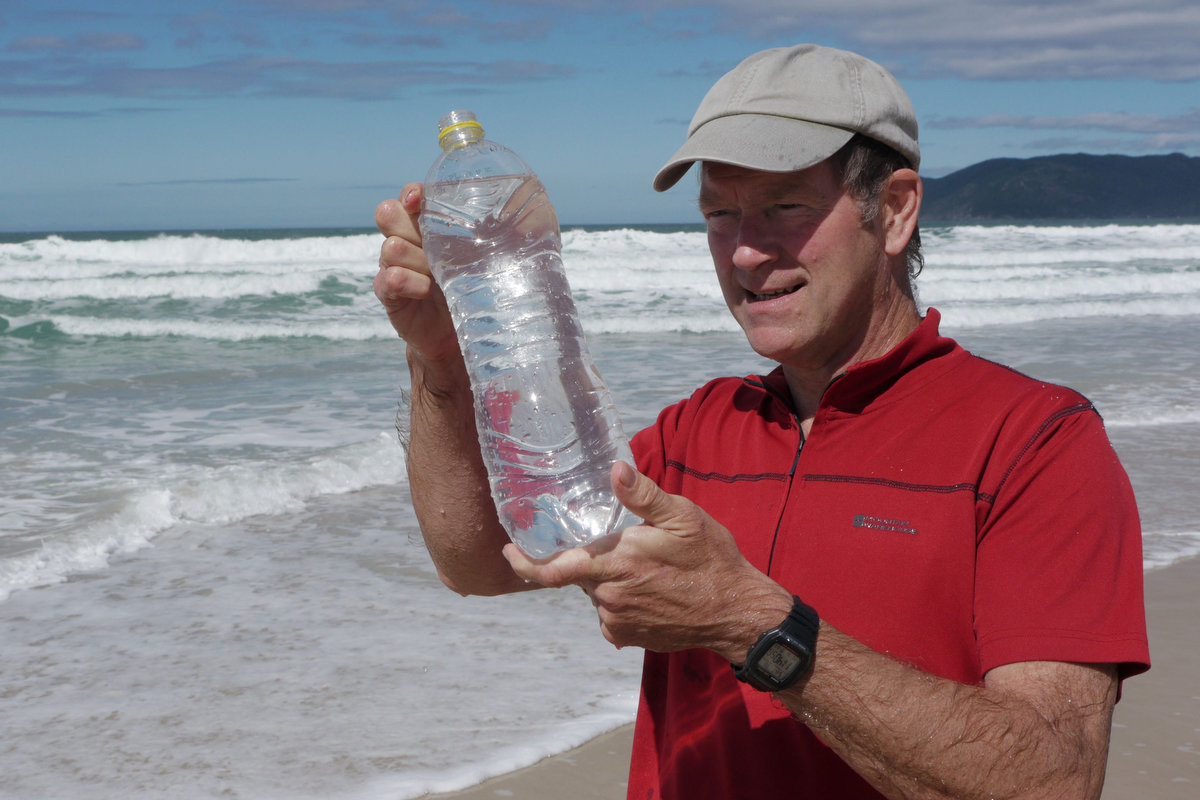
Martin checking the seawater sample for sand or other impurities
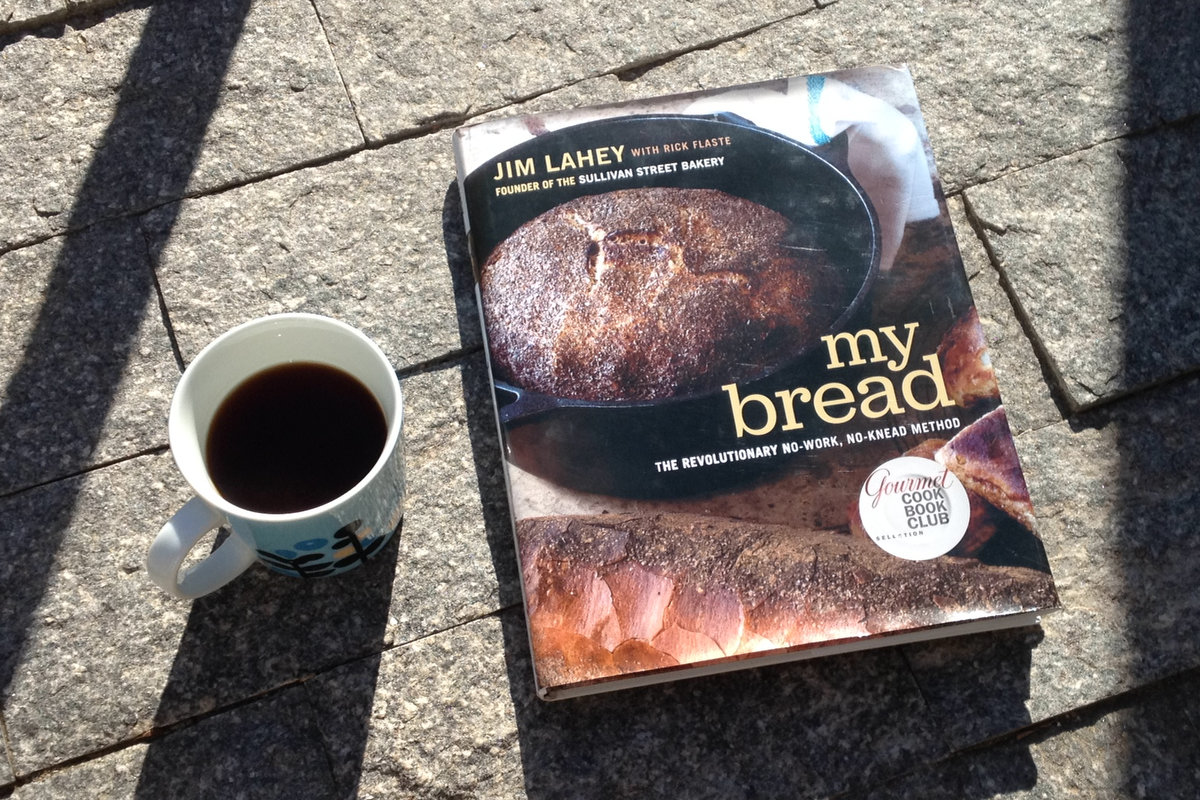
Jim Lahey’s book “My Bread” that contains Jim’s ‘no-knead’ method of bread making used for the bread in this blog post
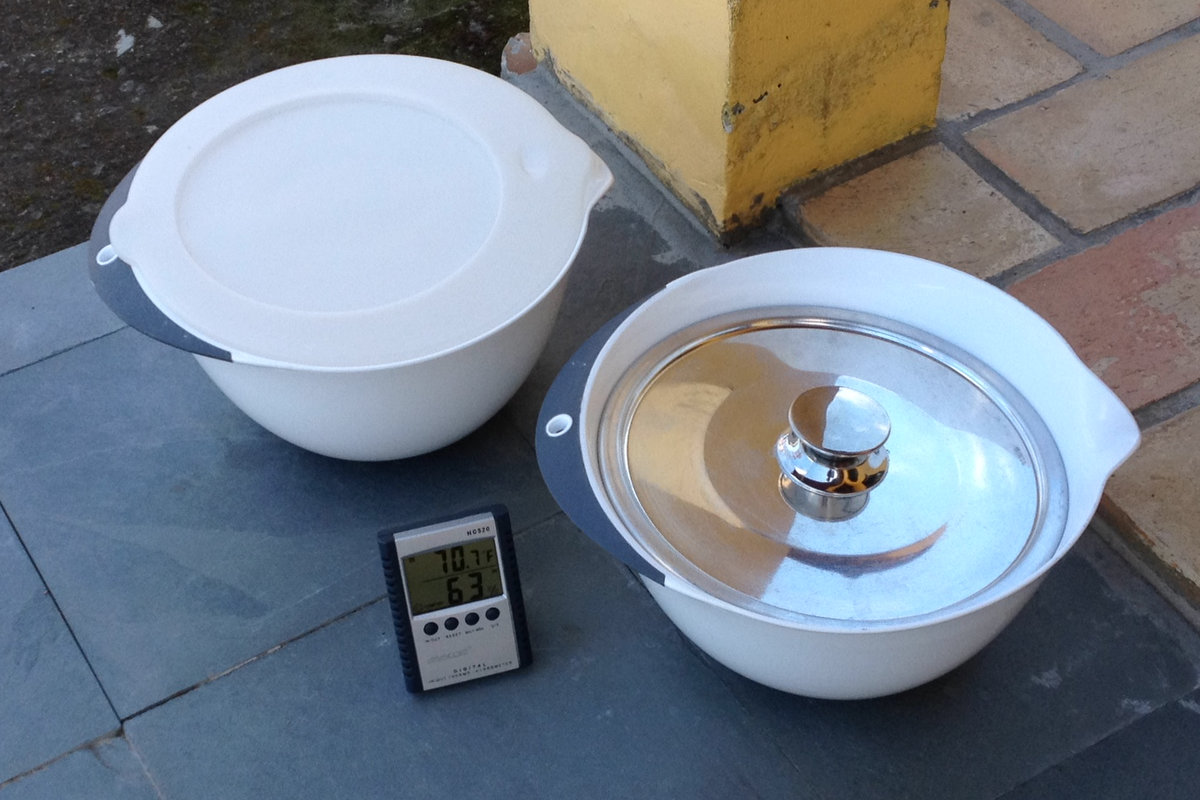
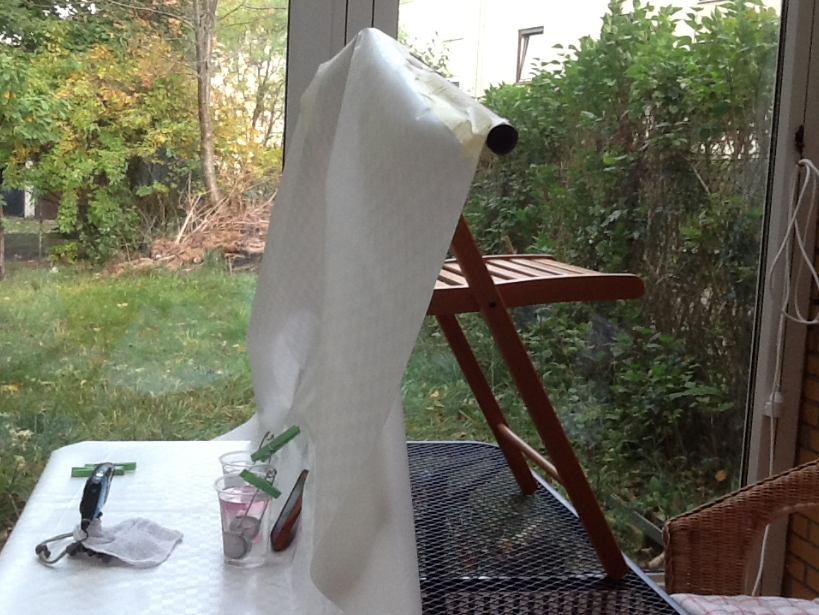
Waiting for the bread to raise

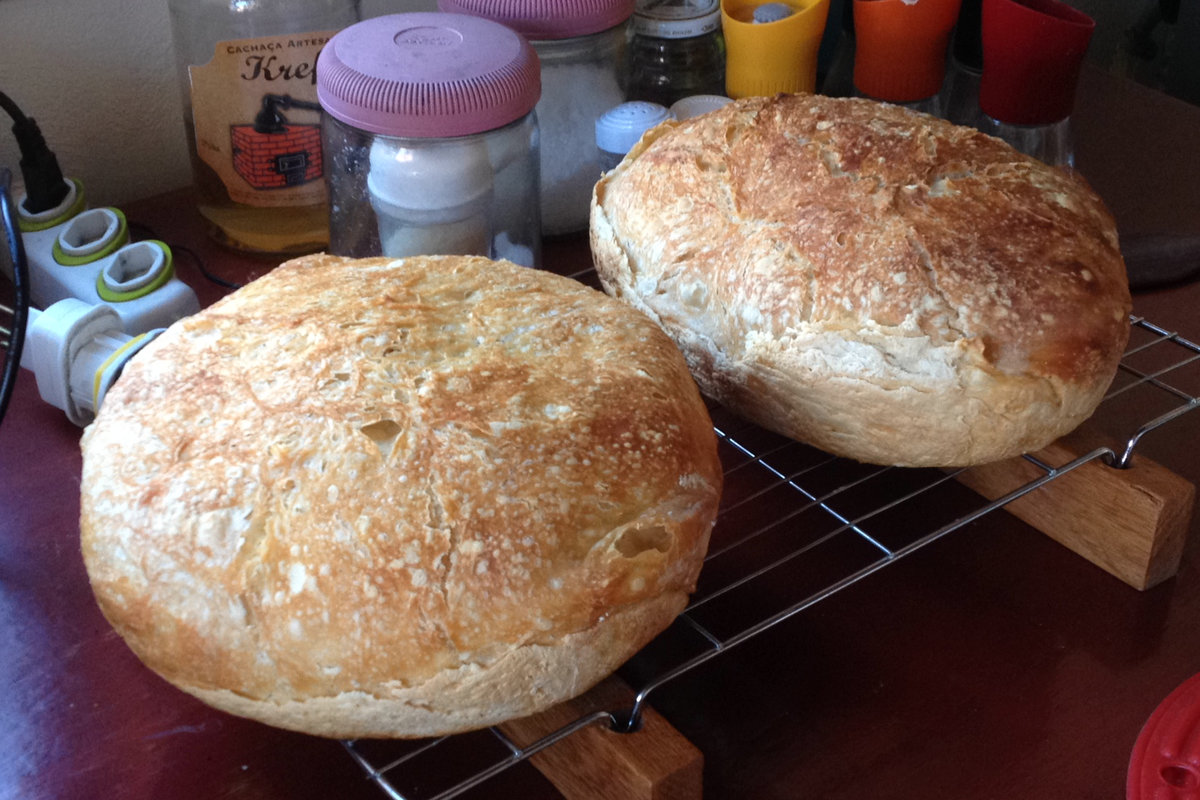
The finished result! Doesn’t it look delicious?
The bread tasted very good, crusty and tasty. I made two loaves, one with the seawater filtered through a coffee filter and the other with unfiltered seawater. Normally this recipe needs around 12-18 hours rising time but this took 28 hours for the two risings, but it is winter in southern Brasil (Florianópolis, on the coast) and the day temperature was only 72F (22°C) on the day of the experiment. It’s also possible that the greater proportion of salt might have hindered the development of the yeast and held back the rise. This wasn’t a very scientific experiment.
I calculated that Lahey’s original no-knead’ recipe calls for 8g salt to 300g of water which makes 26.66g per litre, whereas sea water (according to Mirjam’s 2013 blog is 35g/litre so this should mean that the sea bread loaf should be around 30% more salty than normal; if I’m honest, it didn’t tasty significantly more salty).
Further experiments: the obvious test would be a sea water loaf vs conventional made, risen and baked at the same time.
Notes:
The Jones Beach in Jim’s recipe is the Jones Beach State Park on Long Island, New York State. The current water cleanliness data is here (PDF), scroll down for the Jones Beach SP results.
The beach that I collected my sea water from is currently ‘própria‘ but I wouldn’t collect after heavy rain (runoff) or heavy seas (turbidity). As a safety precaution one could boil the sea water and let it cool just enough before using. In fact, when the weather is cold, that would be the best way of giving the bread a good start.
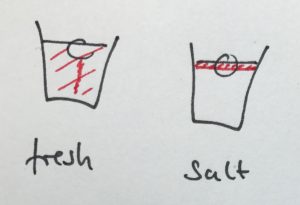
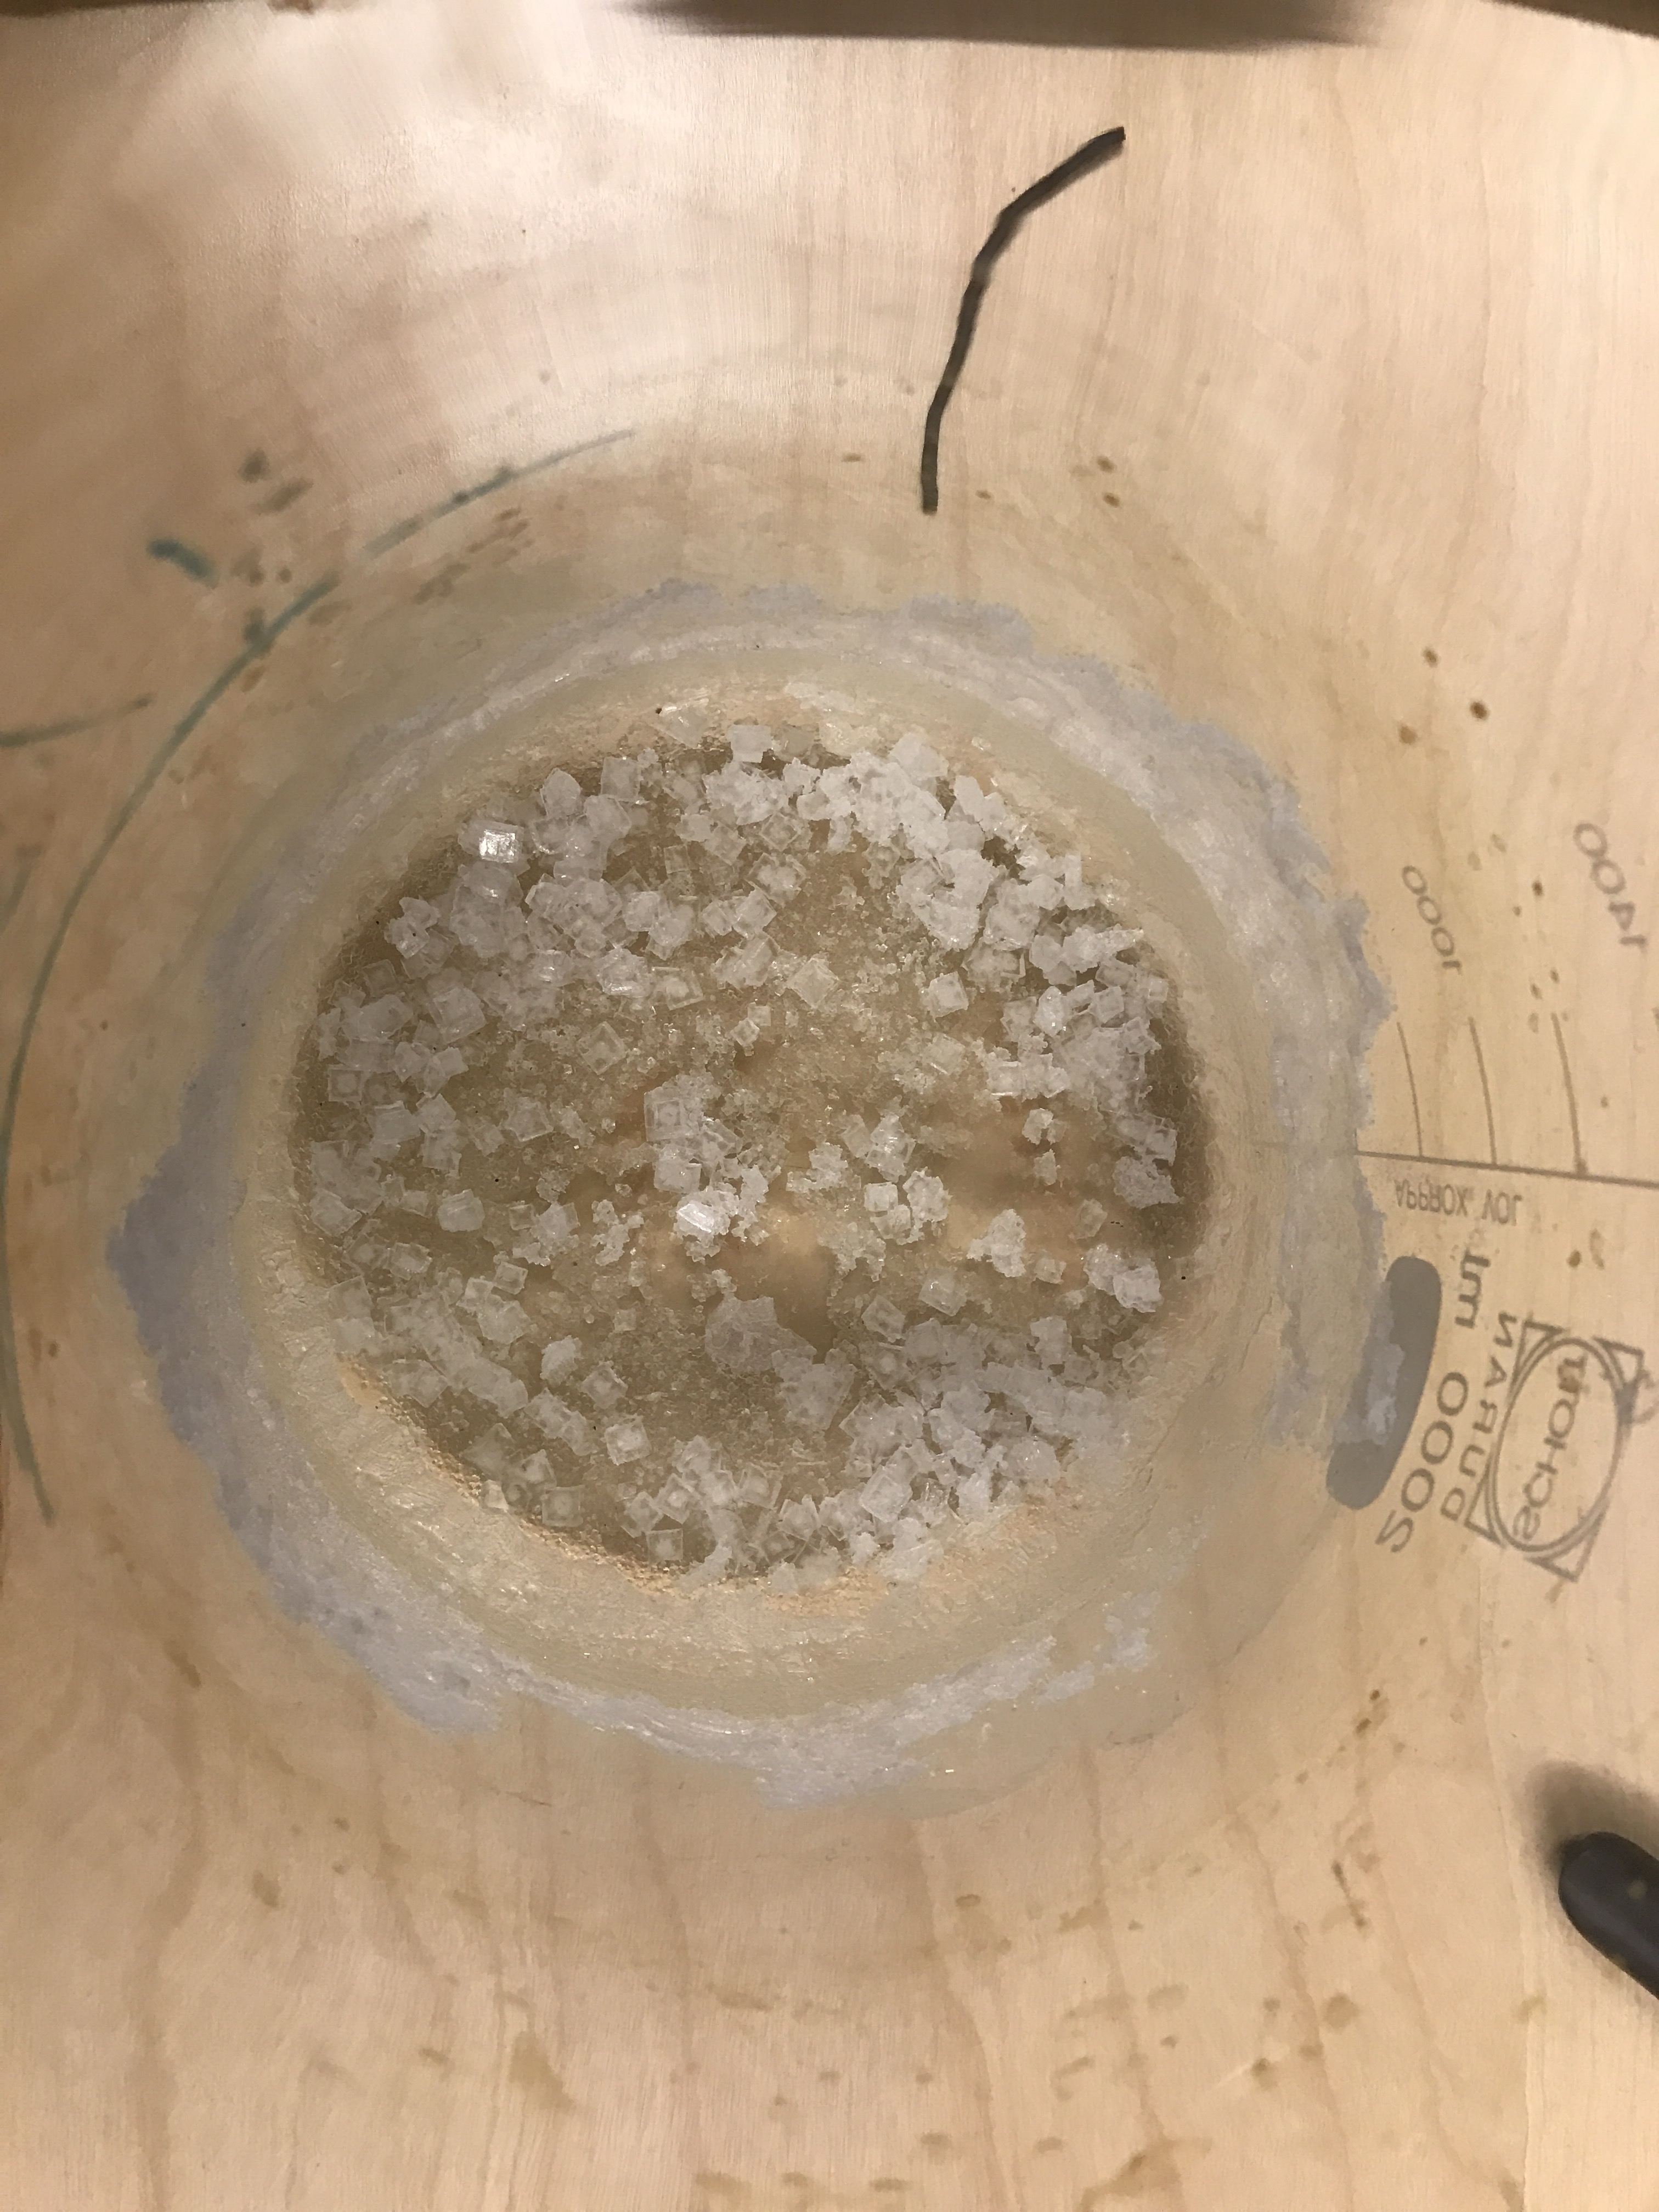
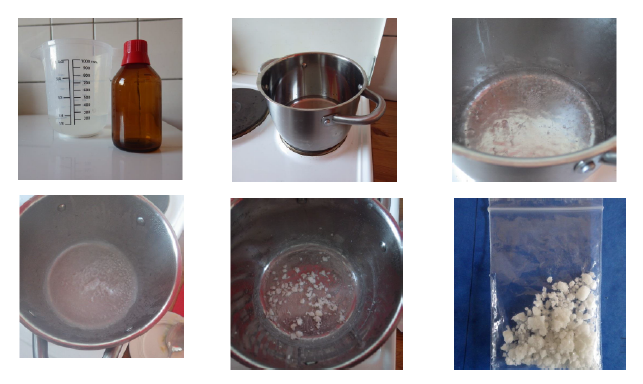
[note by Mirjam: I’ve done a super quick google search and it looks like typical salinities for the Florianopolis area can go down to 30-ish and thus be lower than the typical, open ocean value of 35, but during summer they might go up to 37 (Pereira et al., 2017) but in addition to the seasonal changes, your salinity probably depends very much on which beach you took the water sample at (for example if it was a lagoon-ish beach with a lot of freshwater runoff and not so much mixing with the open ocean). Since you collected the water fairly close to the beach and during winter, it’s likely that the salinity wasn’t quite as high as the 35 I mentioned (which would explain why the bread didn’t taste as salty as you might have expected). If you wanted to know the exact salinity next time you are making bread, an easy method to measure the salinity of sea water would be to boil a liter until all the water has evaporated and weigh the remaining salts. This isn’t very precise for oceanographer-standards, since some of the substances that oceanographers include in their measure of “salinity” in sea water at normal temperatures might actually evaporate with the water, but since the largest constituent of the “salt” in sea water is just normal NaCl, the mistake you’d be making is probably small enough for cooking purposes, and you’d get a general idea of how “typical” your sample is in terms of seawater salinity.]
Bio:
Martin Haswell is an English photographer who loves travel and making bread.