Students evaporate water to measure the salinity of a water sample.
As described in this post, I like to have students build “instruments” to measure the most oceanographic properties (temperature, salinity and density). I find that they appreciate oceanographic data much more once they have first-hand experience with how difficult it is to design instruments and make sense of the readings. Today I’m presenting two groups that focused on salinity, while yesterday’s group was measuring density.
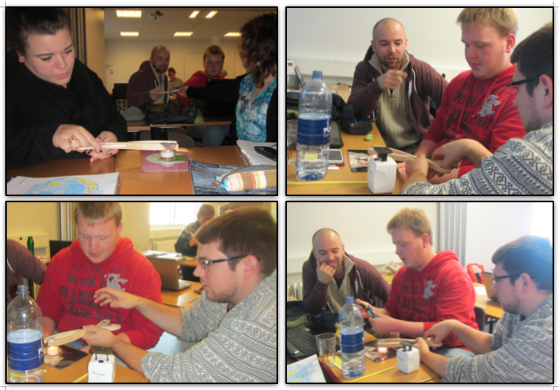
Students evaporate water to measure the salinity of a water sample.
The students in the course I currently teach were determined to not only evaporate some water to qualitatively look at how much salt was dissolved in the sample, they wanted to do it right. So they set out to measure the vessel, the sample and the remaining salt. But since measuring salinity is really pretty difficult, they ran into a couple of problems. First – my scales were nowhere near good enough to measure the amount of water they could fit into the evaporation cup with any kind of precision. Second, even the amount of water that they could fit took a lot longer to evaporate (or even boil) than anticipated. Third, they realized that even though they could see salt residue in the end, this might not be all the salt that had been there in the beginning, plus there was grime accumulating at the base of the cup, so weighing the cup in the end might not be the best option. But they still learned a lot from that experiment: For example that once the (small quantity of) water was boiling, it became milky very quickly and then turned to crystallized salt almost instantly. Or that in order to use this method, a tea candle is not as suitable as a heat source as a lighter (and there might probably even be even better ones out there).
P.S.: In this course, none of the groups set the wooden tongs on fire! :-)