Tag Archives: internal waves

“Dead water” or: ship-generated internal waves

And here is another experiment that can be done with the same stratification as the lee waves: Towing a ship to explore the phenomenon of “dead water”!

Dead water is well known for anyone sailing on strong stratifications, i.e. in regions where there is a shallow fresh or brackish layer on top of a much saltier layer, e.g. the Baltic Sea of some fjords. It has been described as early as 1893 by Fridtjof Nansen, who wrote, sailing in the Arctic: “When caught in dead water Fram appeared to be held back, as if by some mysterious force, and she did not always answer the helm. In calm weather, with a light cargo, Fram was capable of 6 to 7 knots. When in dead water she was unable to make 1.5 knots. We made loops in our course, turned sometimes right around, tried all sorts of antics to get clear of it, but to very little purpose.” (cited in Walker,  J.M.; “Farthest North, Dead Water and the Ekman Spiral,” Weather, 46:158, 1991)

Finding the explanation for this phenomenon took a little while, but in 1904, Vilhelm Bjerknes explained that “in the case of a layer of fresh water resting on the top of salt water, a ship will not only produce the ordinary visible waves at the boundary between the water and the air, but will also generate invisible waves in the salt-water fresh-water boundary below” — a lot of the ship’s work is now going towards generating the internal waves at the interface rather than for propulsion.

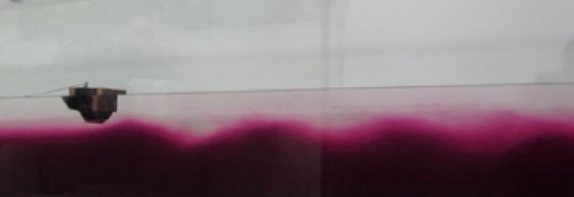
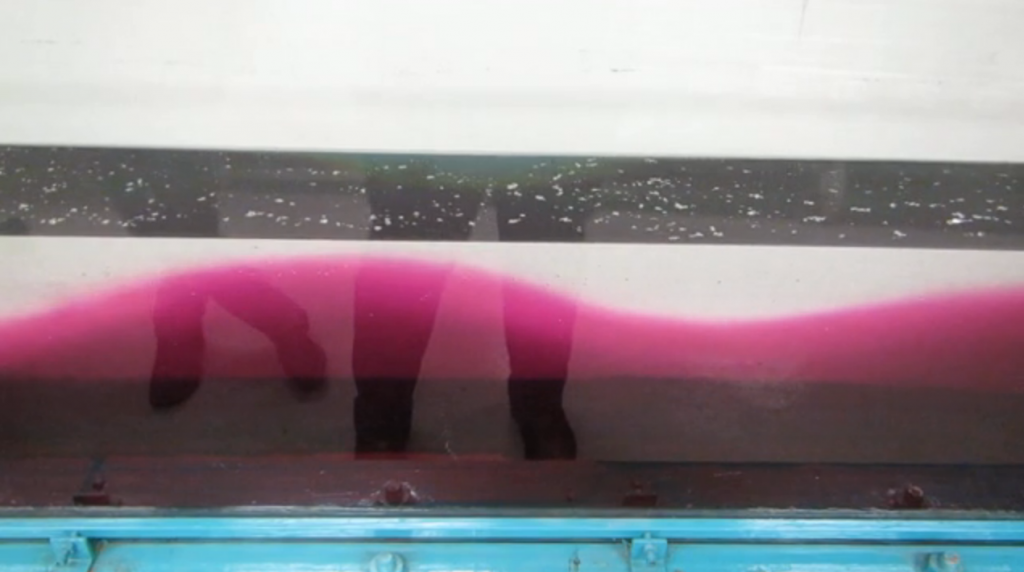
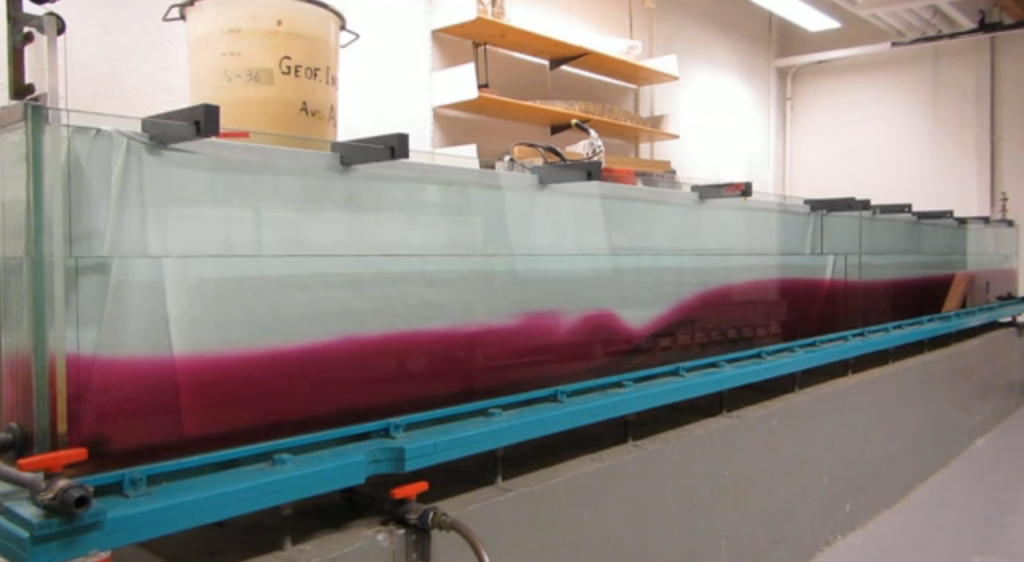
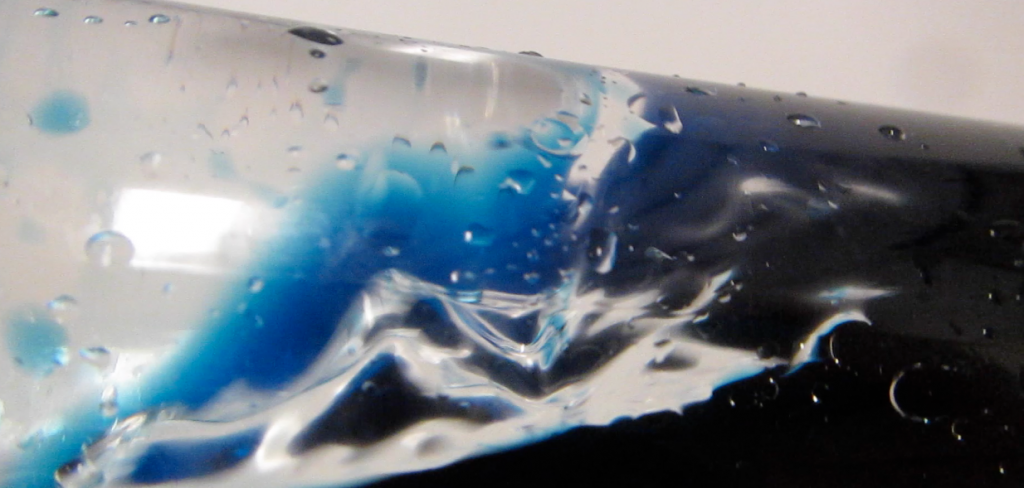
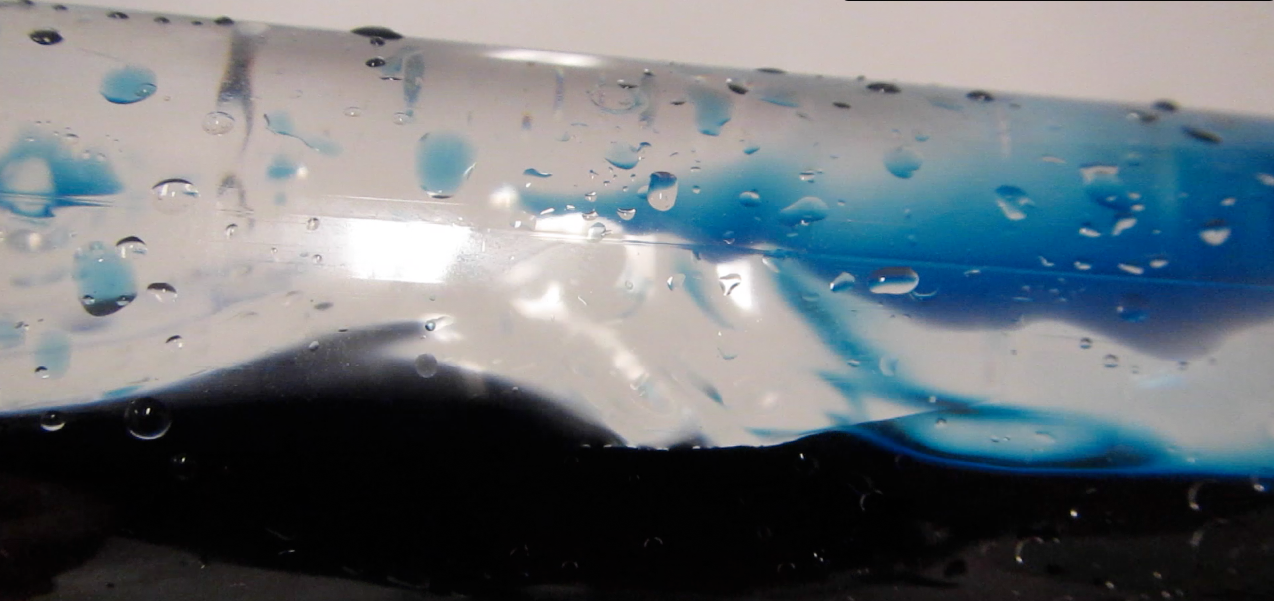
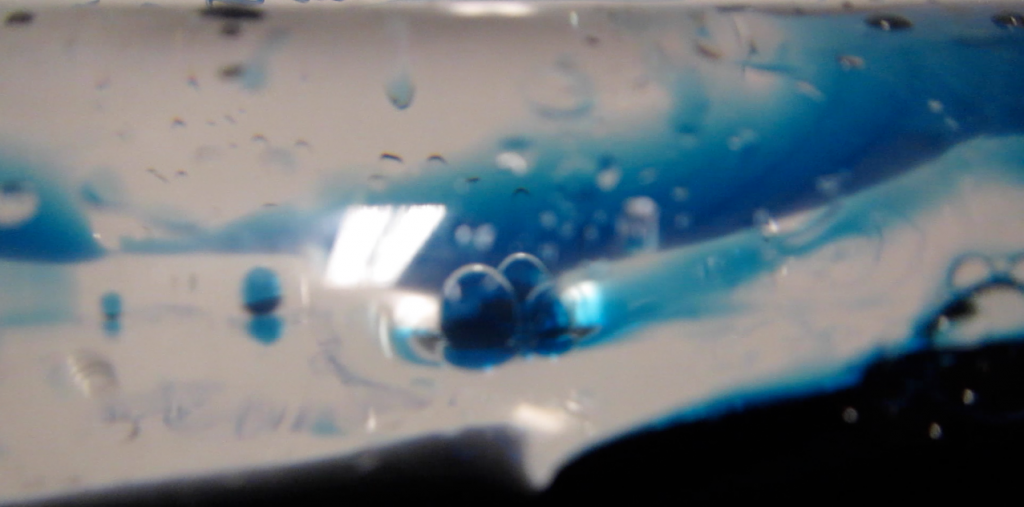
It’s hard to imagine how a ship will generate waves somewhere in the water below, so we are demonstrating this in the tank:

Isn’t it fascinating to think about how far oceanography has come in only a little over a hundred years? And despite all the extremely powerful instrumentation and modelling that we have available now, how cool are even such simple demonstrations in a tank? These are the moments where I know exactly why I went to study oceanography in the first place, and why it’s still the most fascinating subject I can think of…

Forced internal waves in a continuous stratification

Plus all kinds of dyes. (deutscher Text unten)

Using the continuous salinity stratification created yesterday, Rolf and Daniel conducted a really cool experiment: They forced internal waves and watched them develop. I’ve converted their movie into a time-lapse; watch it below.

Mit der kontinuierlichen Salzschichtung, die Daniel und Rolf gestern gebastelt haben, haben sie danach noch weiter experimentiert. Sie haben einen durch einen kleinen Motor angetriebenen Stempel in die Schichtung eingeführt und auf und ab bewegt. Das Wellenfeld, das sich dadurch entwickelt hat, sieht man im Film oben im Zeitraffer (einige kurze Abschnitte zwischendurch zeigen auch Echtzeit). Farbkristalle, die nachträglich hinzugefügt wurden, helfen, die Strömungen zu visualisieren.

Ship-generated internal waves

A tank experiment showing ship-generated internal waves.

When entering a fjord from the open ocean by ship, it can sometimes be noted that the speed of the ship changes even though apparently nothing else changed – the wind didn’t change, the position of the sails didn’t change, the settings on the engine didn’t change – whatever was driving the ship didn’t change. And yet, the ship slowed down. How can that be?

According to the legend (that I like to propagate in my classes), when this phenomenon was first noticed, people attributed it to sea monsters latching onto the ship and slowing it down. Or if not monsters, than at least mollusks and other not-quite mostery monsters. But then Bjerknes came along and, together with Ekman, set up experiments that explain what is taking all the energy away from propulsion. I’ll give you a hint:

Yes – the ship excites internal waves at a density interface. Since the stratification in a fjord is much stronger than in the ocean, driving into a fjord means loosing a lot more energy towards the generation of internal waves.

See the movie here:

Internal waves in the atmosphere

A photo of internal waves in the atmosphere.

Internal waves exist on the interface between fluids of different densities. In the ocean they are mostly observed through their surface imprint. In the tank, we could also observe them by looking in from the side, but this is hardly feasible in the ocean. But luckily vision is easier in the atmosphere than in the ocean.

On our research cruise on the RRS James Clark Ross in August 2012, we were lucky enough to observe atmospheric internal waves, and even breaking ones (see image above). This is quite a rare sight, and a very spectacular one, especially since, due to the low density contrast between the two layers, the waves break extremely slowly.

It is really hard to imagine what it looked like for real. This movie shows the view of Jan Mayen – the volcano, the rest of the island and then the atmospheric waves. Please excuse the wobbly camera – we were after all on a ship and I was too excited to stabilize properly.

Details of lee waves in the tank.

A movie focusing on details of the lee waves in the tank.

In this post, we investigated lee waves in a tank in a general way. Here, I want to show a detail of those lee waves:

In this movie, the concept of hydraulic control becomes visible. On the upstream side of the mountain, the dense water layer forms a reservoir which is slightly higher than the mountain. On top of the mountain and towards its lee side, the layer of denser water is stretched thin and has a smooth surface until about half way down the mountain, where waves start to form. In this thin, smooth layer, flow speeds are higher than the wave speeds, hence disturbances of the interface are flushed downstream and cannot deform the interface. Only about halfway down the mountain, the phase speed becomes equal to the flow speed, hence waves can both form and stay locked in place relative to the mountain.

For more information on internal waves, check out these posts [which are scheduled to go online over the next couple of days]:

Surface imprints of internal waves

How internal waves in the ocean can be spotted on the surface.

Under certain conditions, internal waves in the ocean can be spotted at the ocean’s surface due to changes in surface roughness or to the movement of floating foam or debris. They can be spotted if half their wavelength is longer than the distance between the interface on which the internal wave is traveling and the water surface, so that the orbital movement caused by the internal waves reaches the water surface. In the tank, they can also be seen – for example by adding small floating particles to the water surface.

MVI_3064

Internal wave in a tank. Seen from the side due to different coloring of the two layers, and on the surface in the distribution of floating tracer.

In the movie below, you can see the interface between water layers of different densities and the water surface with particles on it. The particles make it easy to spot how the water surface is being stretched and squeezed as internal waves travel through underneath.

For more information on internal waves, check out these posts [which are scheduled to go online over the next couple of days]:

Internal (lee) waves in a tank.

Lee wave experiment in a large tank with a moving mountain.

In this previous post, we talked about internal waves in a very simple experiment. But Geophysical Institute has a great tank to do lee wave experiments with that I want to present here (although it doesn’t seem to be clear what will happen to the tank when the remodeling of the main building starts in November – I hope we’ll be able to save the tank!). I think it has originally been used for real research, but these days the GEOF130 lab is the only time this tank gets used.

MVI_2787_01

Tank for internal lee wave experiments – a “mountain” is moved through the tank and generates internal waves.

In this tank, a “mountain” can be moved all the length of the tank through more or less stagnant water, thereby simulating a current going over a non-moving mountain (which might be a slightly more realistic setup). At the lee of the mountain, lee waves form on the interface between two water layers of different density.

For more information on internal waves, check out these posts [which are scheduled to go online over the next couple of days]:

Internal waves in a bottle

Internal waves are shown in simple 0.5l bottles.

Waves travel on the interface between fluids of different densities and the phase speed of those waves depends on the density difference between the two fluids.

MVI_4505_02

MVI_4505_03

Internal waves on the interface between water (dyed blue) and white spirit.

The simplest way to demonstrate this in class can be seen below – two 0.5l plastic bottles are used, one half-filled with water, the other one filled with half water, half vegetable oil. Waves can very easily be excited by moving the bottles, and it is clearly visible that the waves at the interface between water and oil are a lot slower than the ones on the interface between water and air.

For showing this experiment to larger audiences when people can’t play with the bottles themselves, it really helps to color either the water or the oil layer for greater contrast. See here for different combinations that we tried in connection to forskningsdagene in Bergen.

Incidentally, those internal wave bottles are a great toy. If you don’t have one available but wish you had a paper weight as awesome as mine on your desk, here is a movie for you: