Tag Archives: oceanography

On drawing on the board by hand in real time

Drawing by hand on the board in real time rather than projecting a finished schematic?

It is funny. During my undergrad, LCD projectors were just starting to arrive at the university. Many of the classes I attended during my first years used overhead projectors and hand-written slides, or sometimes printed slides if someone wanted to show really fancy things like figures from a paper. Occasionally people would draw or write on the slides during class, and every room that I have ever been taught in during that time did have several blackboards that were used quite frequently.

These days, however, things are differently. At my mom’s school, many classrooms don’t even have blackboards (or whiteboards) any more, but instead they have a fancy screen that they can show things on and draw on (with a limited number of colors, I think 3?). Many rooms at universities are similarly not equipped with boards any more, and most lectures that I have either seen or heard people talk about over the last couple of years exclusively use LCD projectors that people hook up to their personal laptops.

On the one hand, that is a great development – it is so much easier to show all kinds of different graphics and also to find and display information on the internet in real time. On the other hand, though, it has become much more difficult to talk students through graphics slowly enough that they can draw with you as you are talking and at the same time understand what they are drawing.

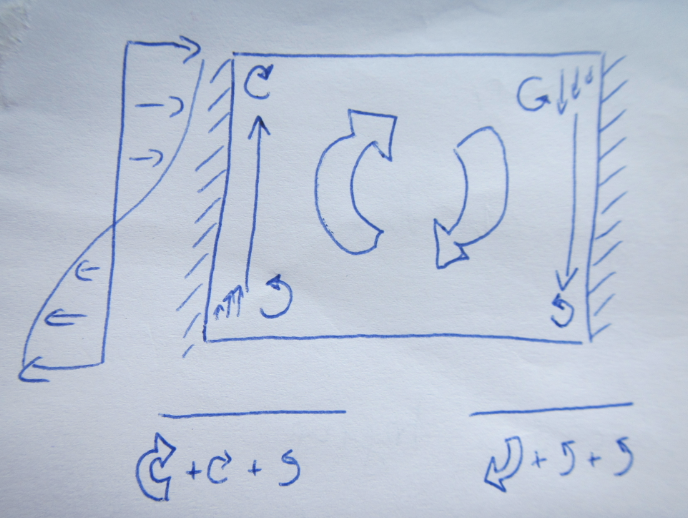
Sketch of the mechanisms causing westward intensification of subtropical gyres – here the “before” stage where the symmetrical gyre would spin up since the wind is inputting more vorticity that is being taken out by other mechanisms.

The other day, I was teaching about westward intensification in subtropical gyres. For that, I wanted to use the schematics above and below, showing how vorticity input from the wind is balanced by change in  vorticity through change in latitude as well as through friction with the boundary. I had that schematic in my powerpoint presentation, even broken down into small pieces that would be added sequentially, but at last minute decided to draw it on the whiteboard instead.

Sketch of the mechanisms causing westward intensification of subtropical gyres – here the “after” stage – the vorticity input by wind is balanced by energy lost through friction with the western boundary in an asymmetrical gyre. Voila -your western boundary current!

And I am convinced that that was a good decision. Firstly, drawing helped me mention every detail of the schematic, since I was talking about what I was drawing while drawing it. When just clicking through slides it happens much more easily that things get forgotten or skipped. Secondly, since I had to draw and talk at the same time, the figure only appeared slowly enough on the board that the students could follow every step and copy the drawing at the same time. And lastly, the students saw that it is actually possible to draw the whole schematic from memory, and not just by having learned it by heart, but by telling the story and drawing what I was talking about.

Does that mean that I will draw every schematic I use in class? Certainly not. But what it does mean is that I found it helpful to remember how useful it is to draw occasionally, especially to demonstrate how I want students to be able to talk about content: By constructing a picture from scratch, slowly building and adding on to it, until the whole theory is completed.

Why do we get an Ekman spiral?

Visualizing an Ekman spiral using a deck of cards.

To state this right upfront: this post will not explain why the surface layer is moving at a 45 degree angle to the wind direction, and if anyone has a great idea for a simple demo for that please let me know! It will also not explain why the layers are turning further and further the deeper down you go. But what I am trying to do today is give an intuitive understanding for why all the theoretical layers in the water column turn in response to the surface layer and hence why an Ekman spiral develops if we accept that the surface layer is turning relative to the wind direction.

Demonstrating the formation of an Ekman spiral using a deck of cards.

You will need a deck of cards. Bonus points if they are “salmon fly” cards like mine (seriously – who could walk past a deck of cards with salmon flies on them? Plus I needed a deck of cards because I was already in Iceland when I realized I wanted to show this demo).

All you do now is put the stack in front of you. Put your hand on the top card, twist gently while applying a little bit of pressure. Voila – your Ekman spiral develops! It is turning the wrong way round, but the main point is that the twist is being transferred downwards from layer to layer and not only the top layer twisting while the other layers stay motionless.

And because people seem to always like movies:

Traveling circus

Stuff that I  brought to Isafjördur to teach the intro to oceanography.

I’ve been a fan of minimalistic travel for a while. And apparently I was ready for a new challenge: Minimalistic travel but with the full equipment for experiments in oceanography! Sadly I didn’t manage to carry on even though I tried…

Stuff that I’m bringing with me to teach “intro to oceanography”.

It might not look like too much, but you’ll be pleased to know that with this equipment, I can show every experiment I’ve shared on this blog so far (with the exception of the ones in the long internal lee wave tank) plus at least a dozen or so that are still in the pipeline to be published on here (I have lost track of what I have shared and I’m too lazy to look it up now, sorry).

IMG_4617

Granted, I did send a list of stuff that I’ll need to Isafjördur, too, and asked them to organize those things for me. But on that list there are only things like paper towels, empty 1.5l bottles or matches – hence things that are very easy to obtain anywhere, but a pain to travel with. I’m bringing all the fancy stuff like high-intensity non-toxic dyes, modeling clay, clear straws (surprisingly difficult to find!), split pins, wooden tongs, heating&cooling pads, an inflatable globe and many more.

So who wants to invite me to come teach at their place? I also “train the trainers” if you want to learn how to do all of this awesome stuff and then teach your students yourself!

Interference of waves.

Movie on wave interference – two wave fields arriving perpendicular to each other, interacting and leaving.

When talking about waves, it is often difficult to explain that wave heights of different components of a wave field can be added to each other to give a resulting wave field, but that each of those components continues to travel with its own direction and speed and comes out of the wave field basically unaltered. Students learn about constructive, destructive and complex interference (see image below), but it is hard to realize that those interactions are only momentary.

Constructive, destructive and complex interference of waves.

When I was on my way up to Isafjördur to teach CMM31, my friend Astrid and I happened to find the perfect example for the phenomenon described above. We were in Gardur in southwest Iceland and took a sunset walk to the lighthouse.

Old lighthouse in Gardur, southwest Iceland.

The lighthouse is located at the end of a pier and we observed a spectacular wave field. Two distinct fields were meeting each other at an almost 90 degree angle, interacted and left on the other side still clearly recognizable.

Two wave crests meeting at approximately 90 degree angle.

The waves met, interacted, and left the area of interaction. Watch the movie below to get an impression!

Standing waves.

A seesaw to visualize how standing waves move in an enclosed basin.

In enclosed basins, standing waves can occur. In the simplest case, they have a node in the middle and the largest amplitudes at the edges of the basin. The movement of the water’s surface then closely resembles that of a seesaw.

IMG_5059

A seesaw. Largest amplitudes at the ends, node in the middle.

Extremely simple but extremely effective visualization!

Progressive waves on a rope

Visualization of progressive waves: wave form and energy move forward while the rope itself stays in place.

When I talked about waves in GEOF130 recently, in order to explain the concept of progressive waves, I showed a drawing from one of the textbooks, where someone was moving a rope such that waves traveled on the rope. The idea was to show that for progressive waves the wave form and energy travel, while the matter itself stays more or less in place, only moving up and down or in circular orbital motions.

The look I got from one of the students for showing that drawing confused me a bit and I am still not sure whether it was a “I have no idea what you are trying to tell me!” or a “Duh! Are we in kindergarden?”, but I think it was probably closer to the former. So from now on I will carry a piece of rope on me to show this in lectures and to have students try themselves.

A wave shape traveling forward on a rope, while the rope itself stays in place.

I filmed a quick video because it was difficult to watch the wave while exciting it myself, but it turns out it is even more difficult to hold a camera more or less steady while exciting waves at the same time, plus the movement is pretty quick even for a camera as awesome as mine. Anyway, if you want to procrastinate learn more about waves, watch this!

Teaching in Isafjördur

Teaching a block course at the University Centre of the Westfjords, Iceland.

For those of you who were surprised that lately they didn’t recognize my students any more and the view from my office window was greatly improved: I am excited to be in Isafjördur in the Westfjords to teach the first two weeks of CMM31 “understanding the ocean” as part of the Master’s in Coastal and Marine Management.

Welcome to Isafjördur!

I visited the University Centre of the Westfjords by chance, really, when two years ago a research cruise ended in Isafjördur and I got in touch to ask whether they wanted to bring their students on a tour of the research ship. From that a connection developed and I taught two lectures on waves and tides at the University Centre of the Westfjords last year – except that I was sitting in my comfy office in Norway then and taught via Skype [more on how that worked in a later post]. While that was certainly an experience, this time I am actually physically present, and I’m very glad about that.

Isafjördur.

When preparing for the course I got an email from Dagny, the program’s academic director, who wrote “You will find that this is not a typical uni environment, hopefully in a good way.” And she was so right! It is not a typical university environment, but in the best way. I am so excited to be here and definitely hope to come back again next year! :-)

P.S.: The tag CMM31 marks posts that are about things I’ve been teaching while in Isafjördur.

Dangers of blogging, or ice cubes melting in fresh water and salt water

When students have read blog posts of mine before doing experiments in class, it takes away a lot of the exploration.

Since I was planning to blog about the CMM31 course, I had told students that I often blogged about my teaching and asked for their consent to share their images and details from our course. So when I was recently trying to do my usual melting of ice cubes in fresh water and salt water experiment (that I dedicated a whole series on, details below this post), the unavoidable happened. I asked students what they thought – which one would melt faster, the ice cube in fresh water or in salt water. And not one, but two out of four student groups said that the ice cube in fresh water would melt faster.

Student groups conducting the experiment.

Since I couldn’t really ignore their answers, I asked what made them think that. And one of the students came out with the complete explanation, while another one said “because I read your blog”! Luckily the first student with the complete answer talked so quickly that none of the other – unprepared – students had a chance to understand what was going on, so we could run the experiment without her having given everything away. But I guess what I should learn from this is that I have taken enough pictures of students doing this particular experiment so that I can stop alerting them to the fact that they can oftentimes prepare for my lectures by reading up on what my favorite experiments are. But on the upside – how awesome is it that some of the students are motivated enough to dig through all my blog posts and to even read them carefully?

For posts on this experiment have a look a post 1 and 2 showing different variation of the experiment, post 3 discussing different didactical approaches and post 4 giving different contexts to use the experiment in.

Why melting sea ice does not contribute to sea level rise.

Simple experiment on why the impact of glaciers and sea ice on sea level, respectively, are not the same.

It could be so simple: An ice cube sinks into water until the mass it replaces is equal to its own mass.

The mug is as full with water as it gets. But even if I stared out of the window at the mountain and the snow until this swimming piece of ice had completely melted – the water level in the mug would not have changed.

Since the mass of said ice cube is not changing when it melts, under the assumption that the difference in volume due to the temperature difference of the melt water and the water in which the ice cube swims is negligible (reasonable assumption in most cases) that means that a swimming ice cube can’t change the water level in a cup and a swimming ice berg can’t change sea level. Things are different for glaciers or other ice that is sitting on land rather than freely swimming.

IMG_5100

I should have thought about how I would transport the plate on which the mug with the ice is sitting back to the kitchen once the ice has melted. In other words: Yes, the mug will spill over.

This is a very easy demonstration and while it is intuitive that in the second case a mug that was completely filled with water when the ice was first added will spill over once the ice melts, the first case seems to be very difficult. Most students are not quite sure what they are expecting to see, and even if they are, they don’t really know why.

My typical drawing to explain this topic. The potato is supposed to be an ice berg floating in water.

I have always been teaching this by drawing the water level and the ice berg on the board, and then by marking the volume of the whole ice berg and the part of it that is under water, and trying to stress how the mass of the ice berg is the same as that of the water replaced by the part of the ice berg that is under water (because the molecules are more densely packed in liquid water and yada yada) — there must surely be a better way to explain this? Any ideas out there?

Experiments the Isafjördur way. Can you spot the two mugs and the ice in the middle of the window sill? Floating ice on the left, a “glacier” resting on forks above the water level on the right.

Measuring temperature.

Students build thermometers.

As described in this post, I like to have students build “instruments” to measure the most oceanographic properties (temperature, salinity and density). I find that they appreciate oceanographic data much more once they have first-hand experience with how difficult it is to design instruments and make sense of the readings. Over the last two days I described the experiments for salinity and density, today it’s temperature.

measuring_temperature

Students building thermometers.

Measuring temperature is probably the most difficult of the three properties. Firstly, there are lots of technical difficulties to be overcome. How can we seal the mouth of the bottle around the straw in a way that it is really water tight? How much water do we have to fill in the bottle? Does it matter if there are air bubbles trapped? What if the water level when we fill the bottle is not visible because of the seal? If the straw is clogged up with modeling clay, will we still be able to use it in the instrument? How long does the straw have to be above the seal in order to avoid water spilling out when the temperatures we try to measure become too hot?

Then, there are many problems connected to the actual measurement. If we lift up the thermometer (and hence squeeze the plastic bottle) – how does that influence our reading? Since we have half a liter of water in the thermometer, are we actually measuring the temperature of the water sample, or are we influencing it while trying to measure? How do we come up with a scale for our temperature measurements had I not supplied (mercury-free) thermometers to calibrate the new thermometer with? So many questions to think about and discuss!