Tag Archives: density

Experiment: Influence of stratification on mixing

A wind stress is applied to the surface of a stratified and a non-stratified tank to cause mixing.

This is a pretty impressive experiment to run if you have a lot of time, or to watch the time-lapse of if you don’t. The idea is that a density stratification will make mixing harder than it would be in the unstratified case, because more energy has to be used to break up the stratification.

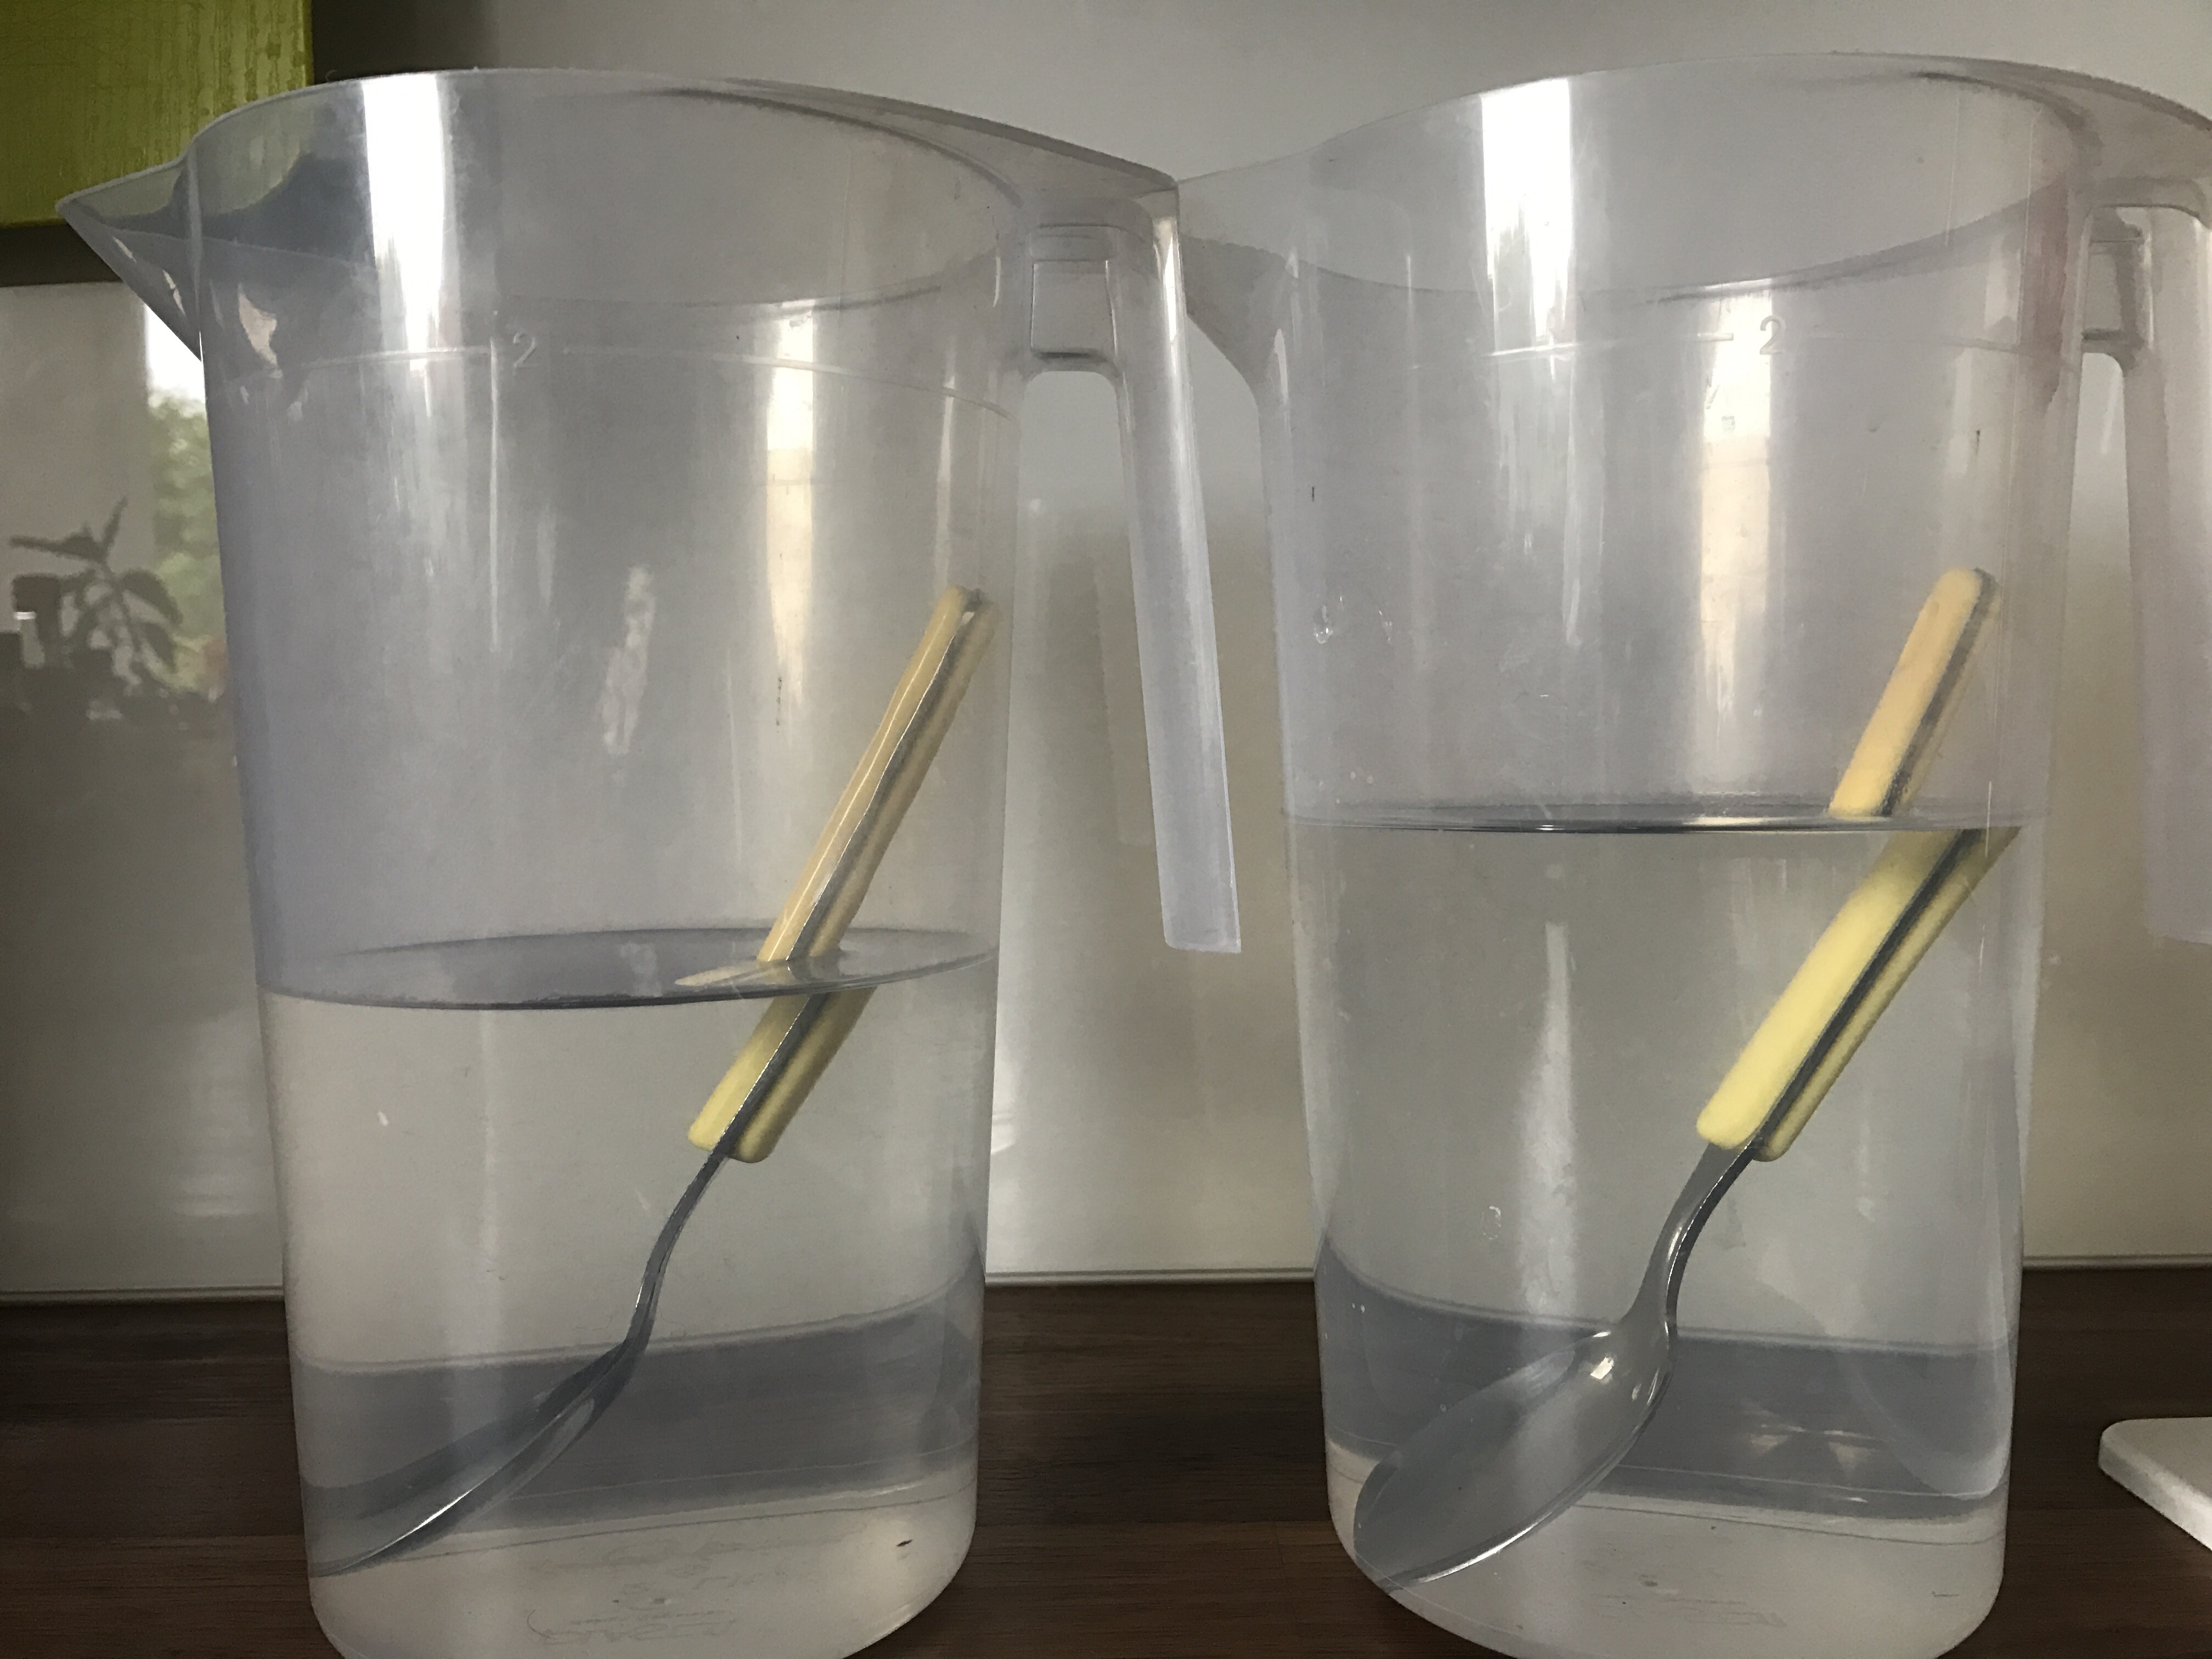
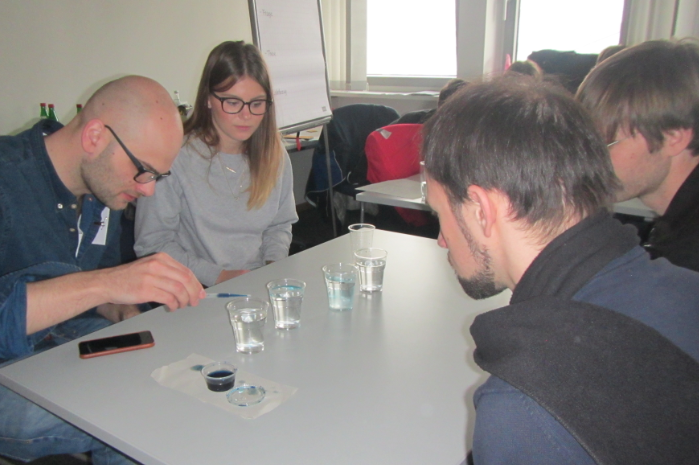
To look at this, we ran two experiments, one after the other.

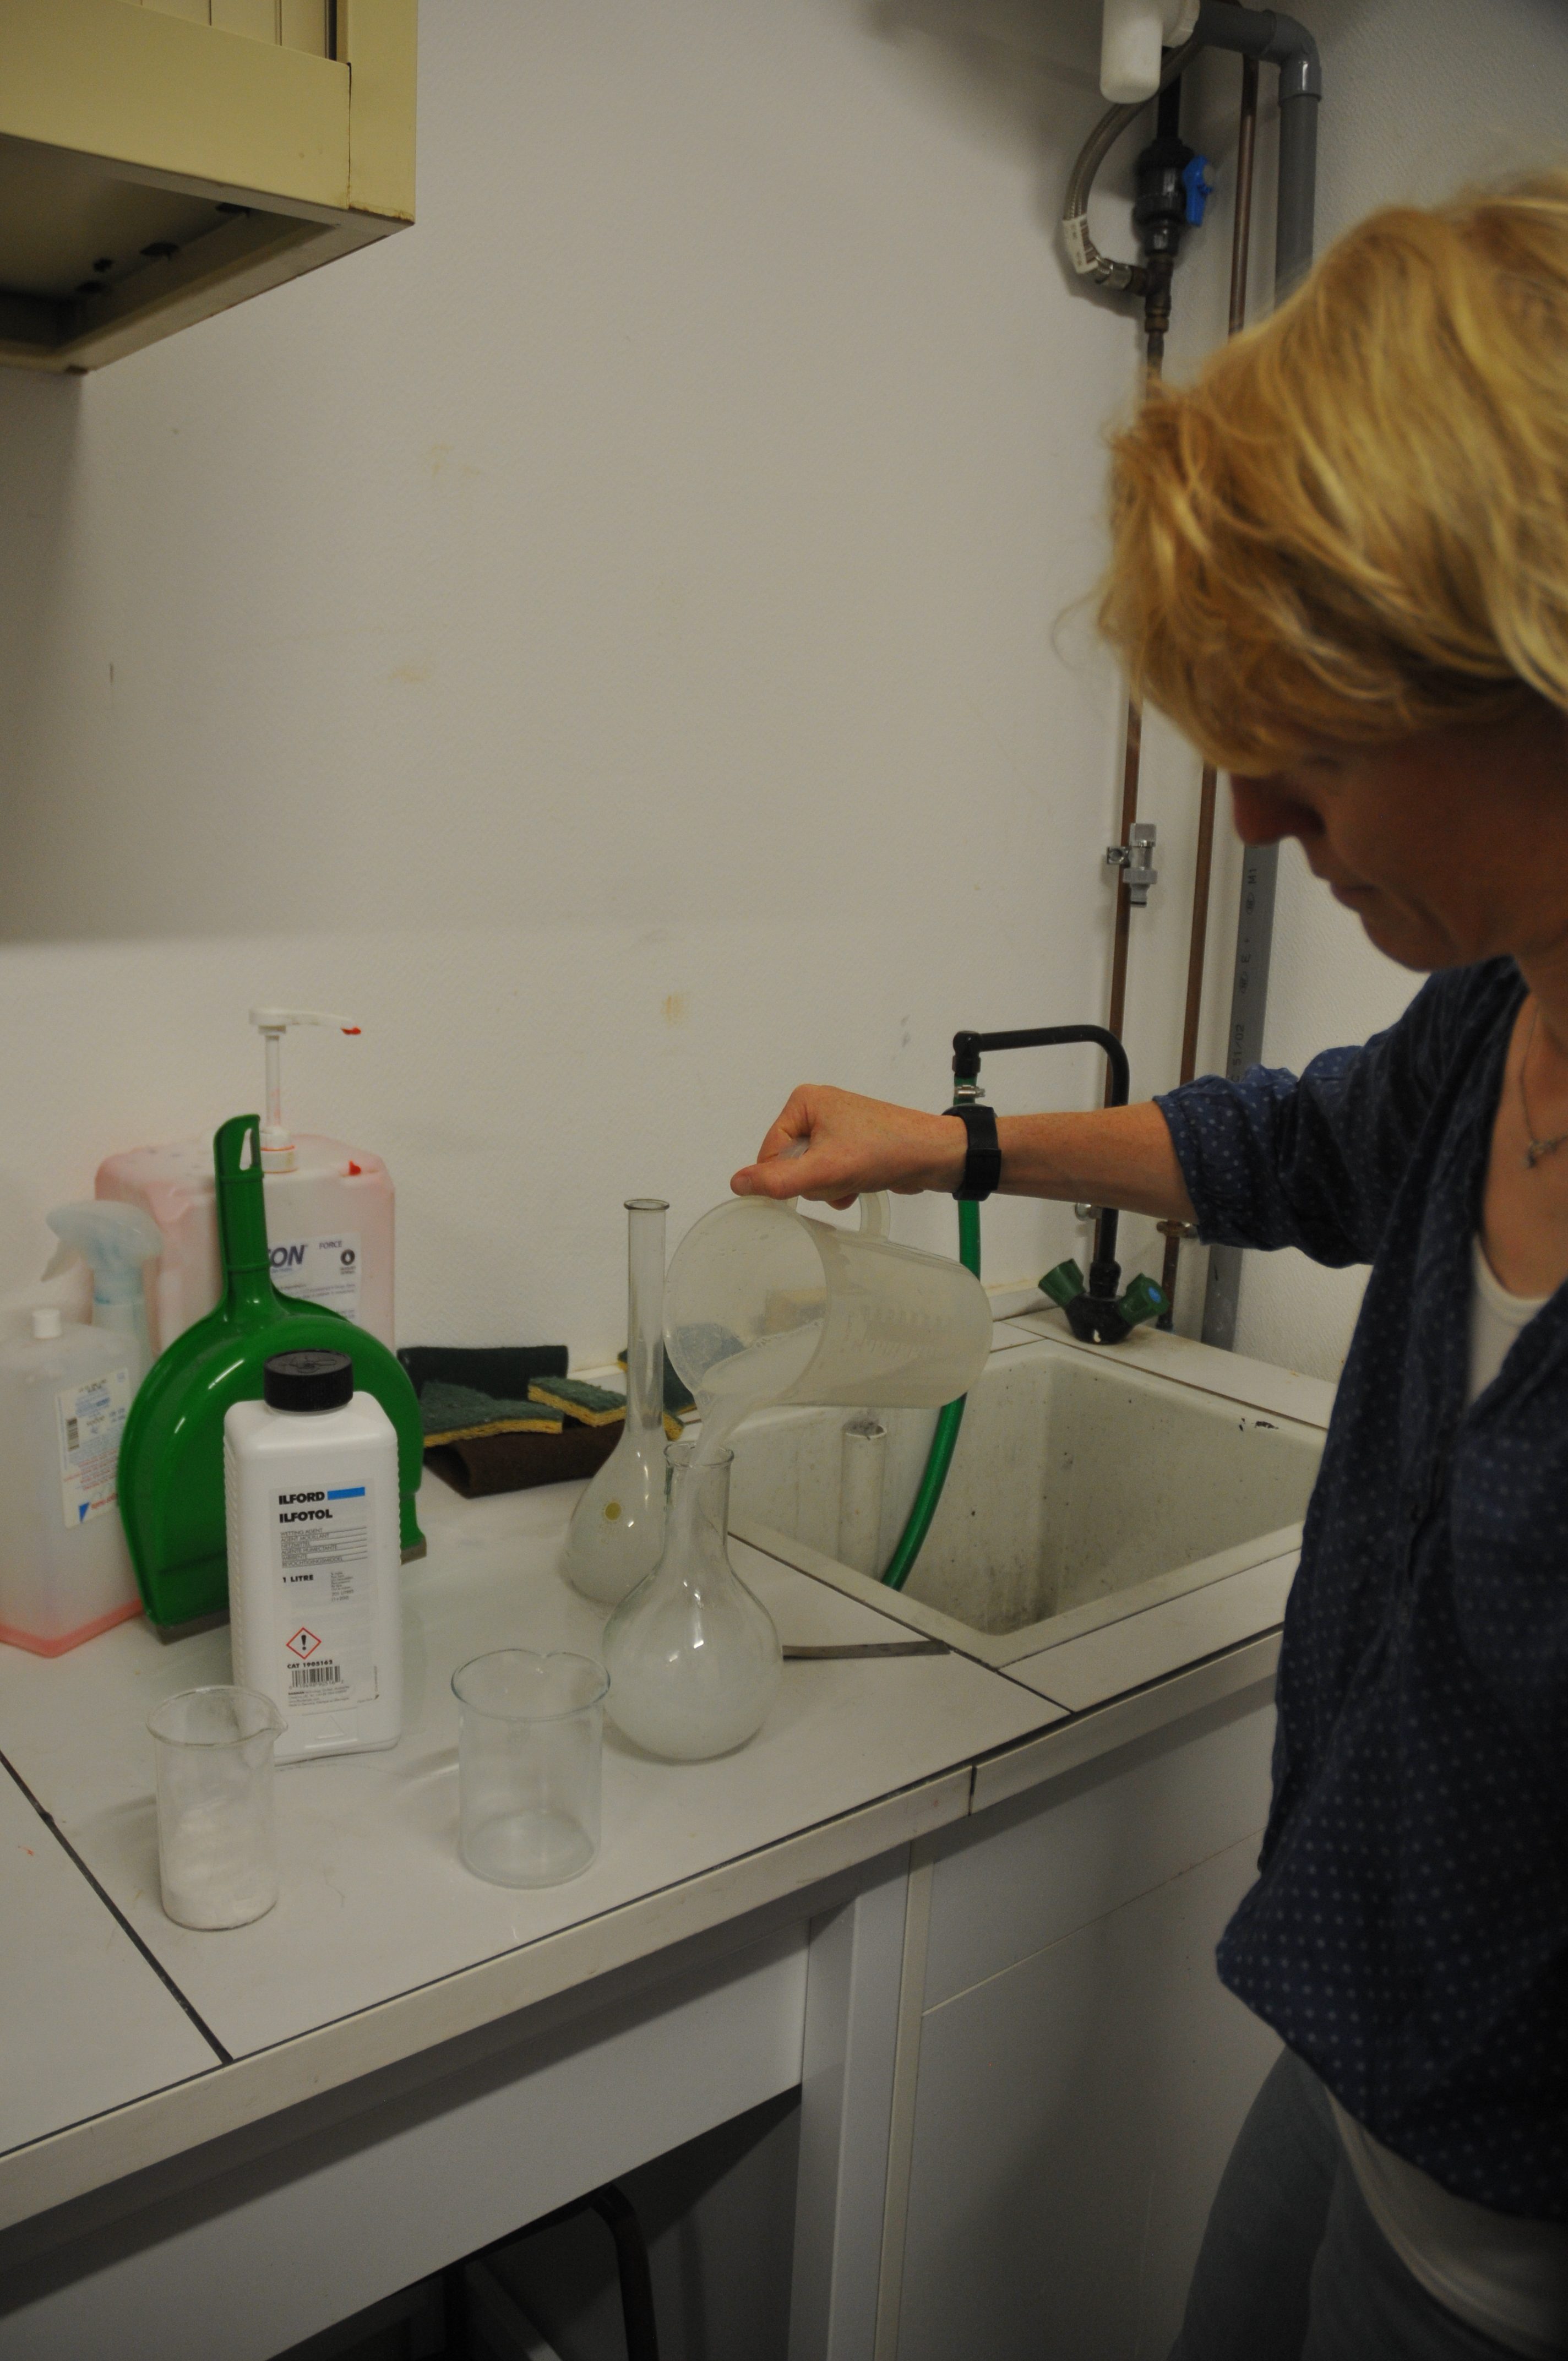
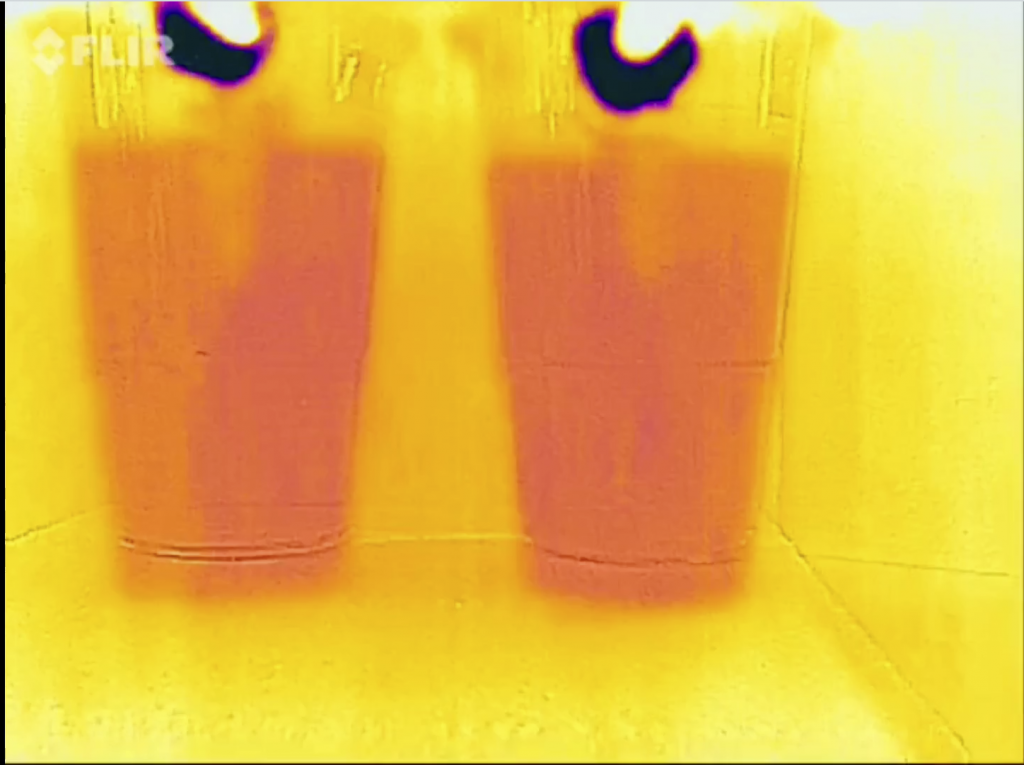
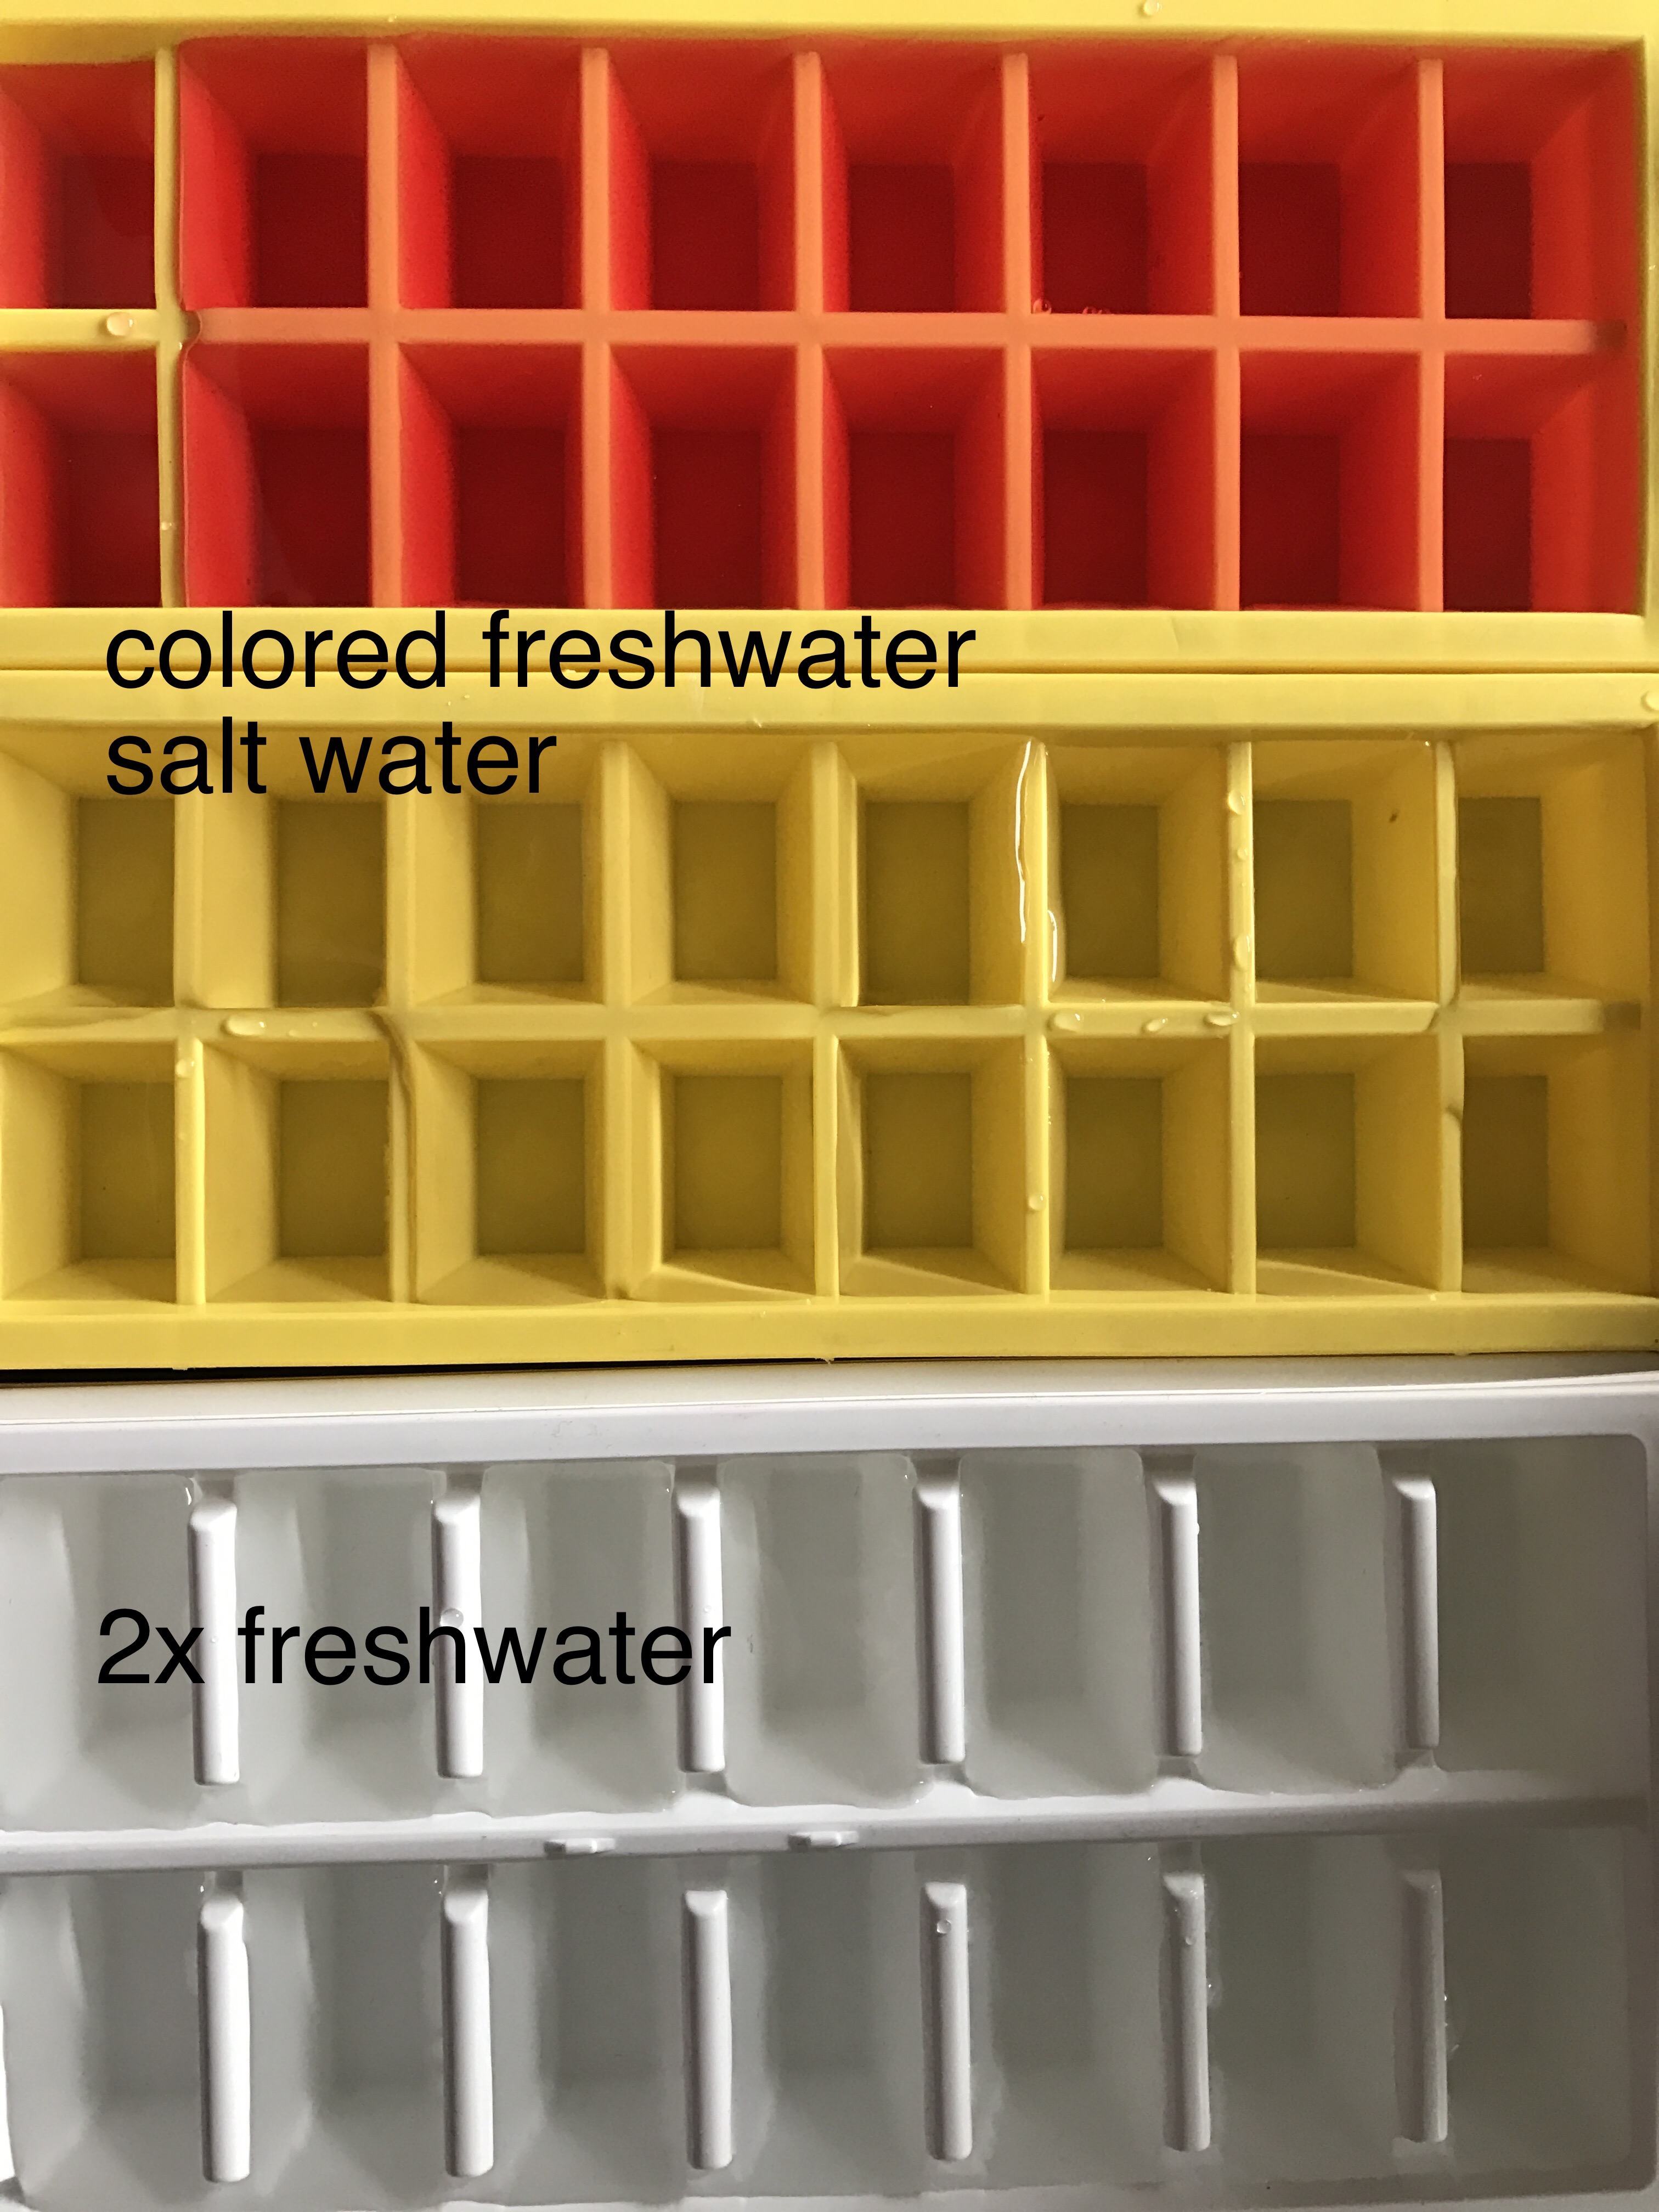
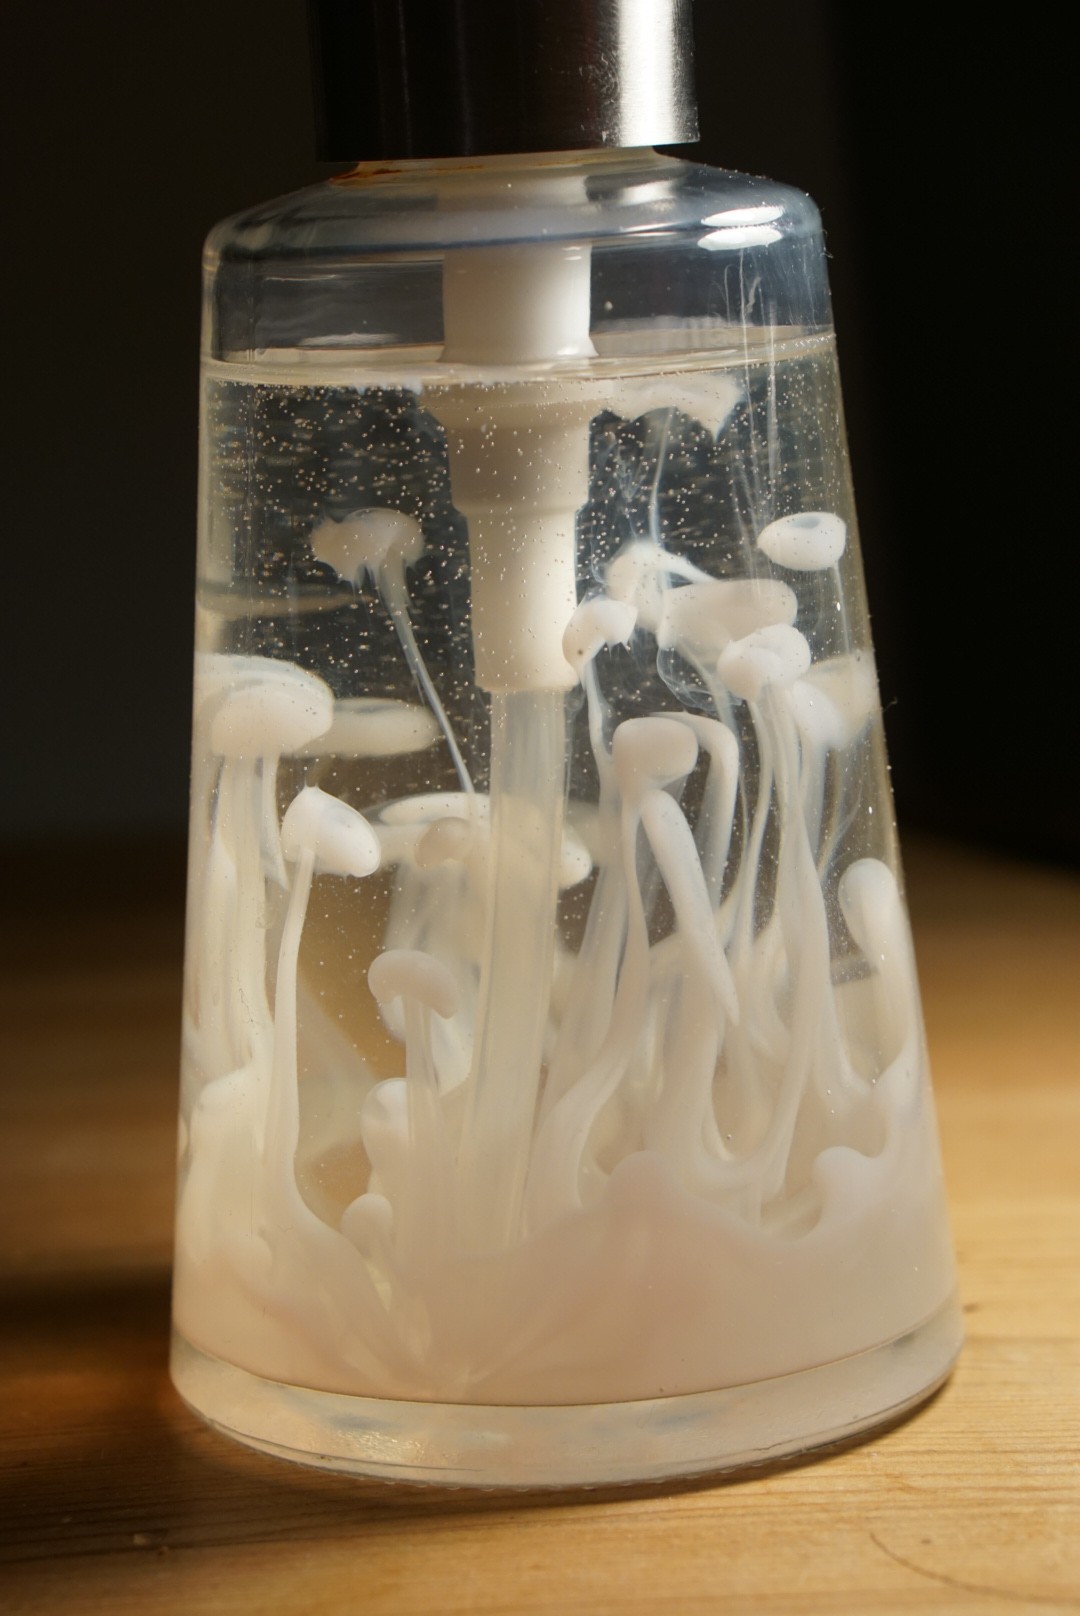
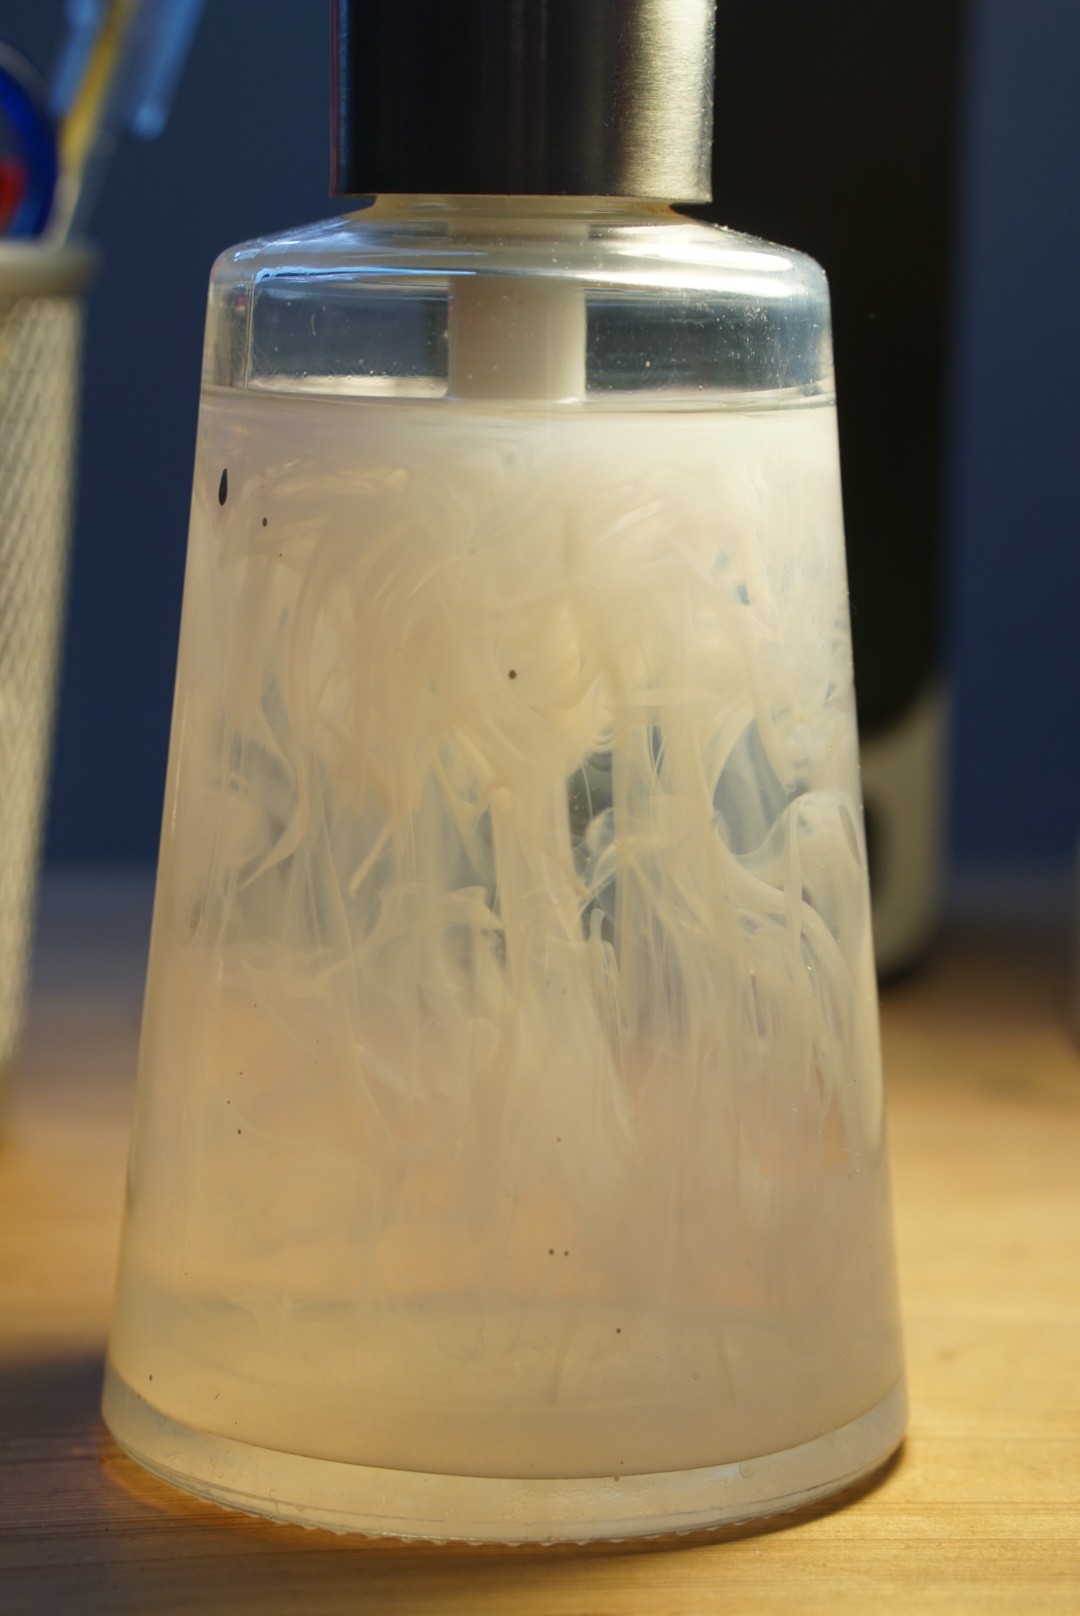
In the first one, we took a tank full of freshwater, added dye droplets and switched on a hair dryer, set to blow pretty much along the surface of the tank, to force mixing through the wind stress. After about a minute, the tank was fully mixed.

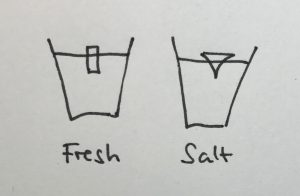
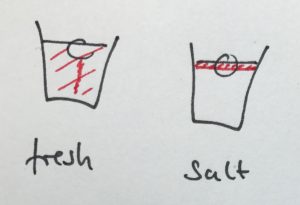
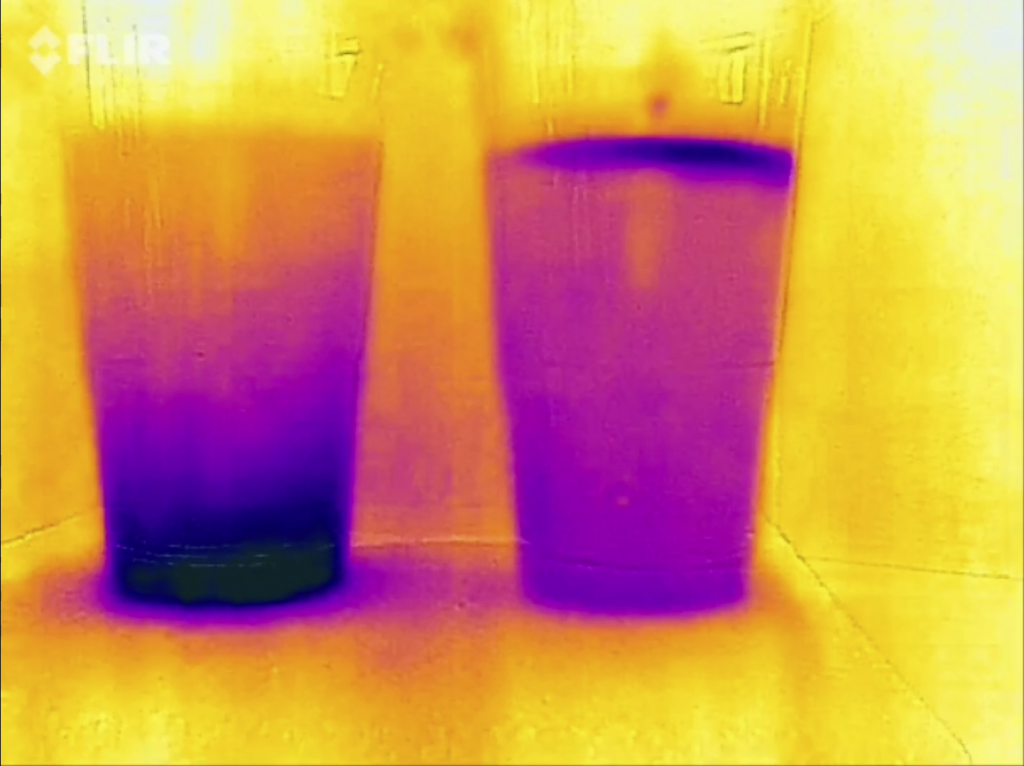
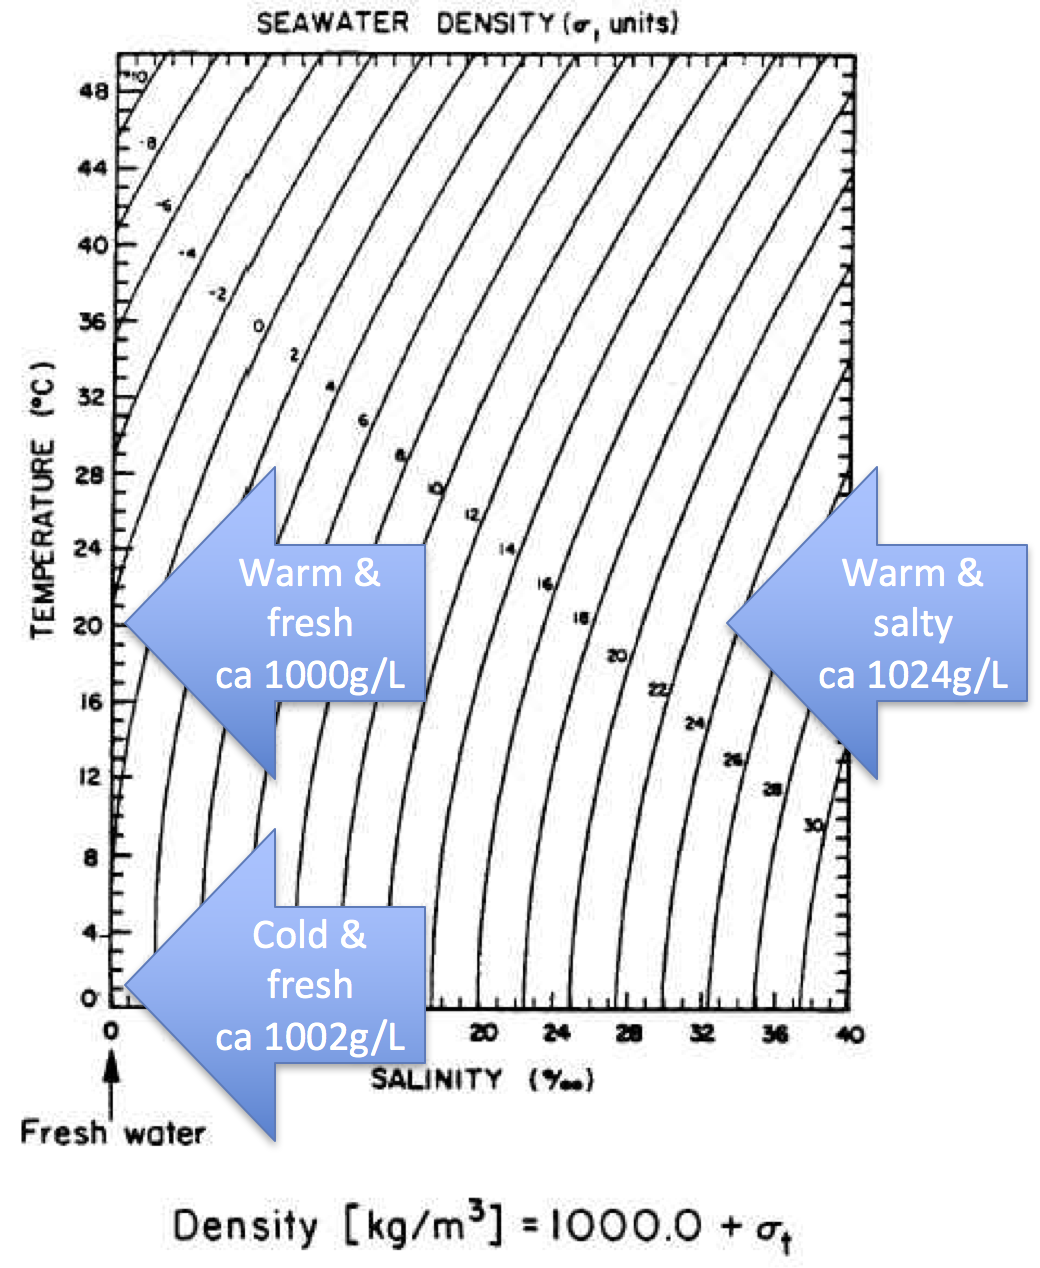
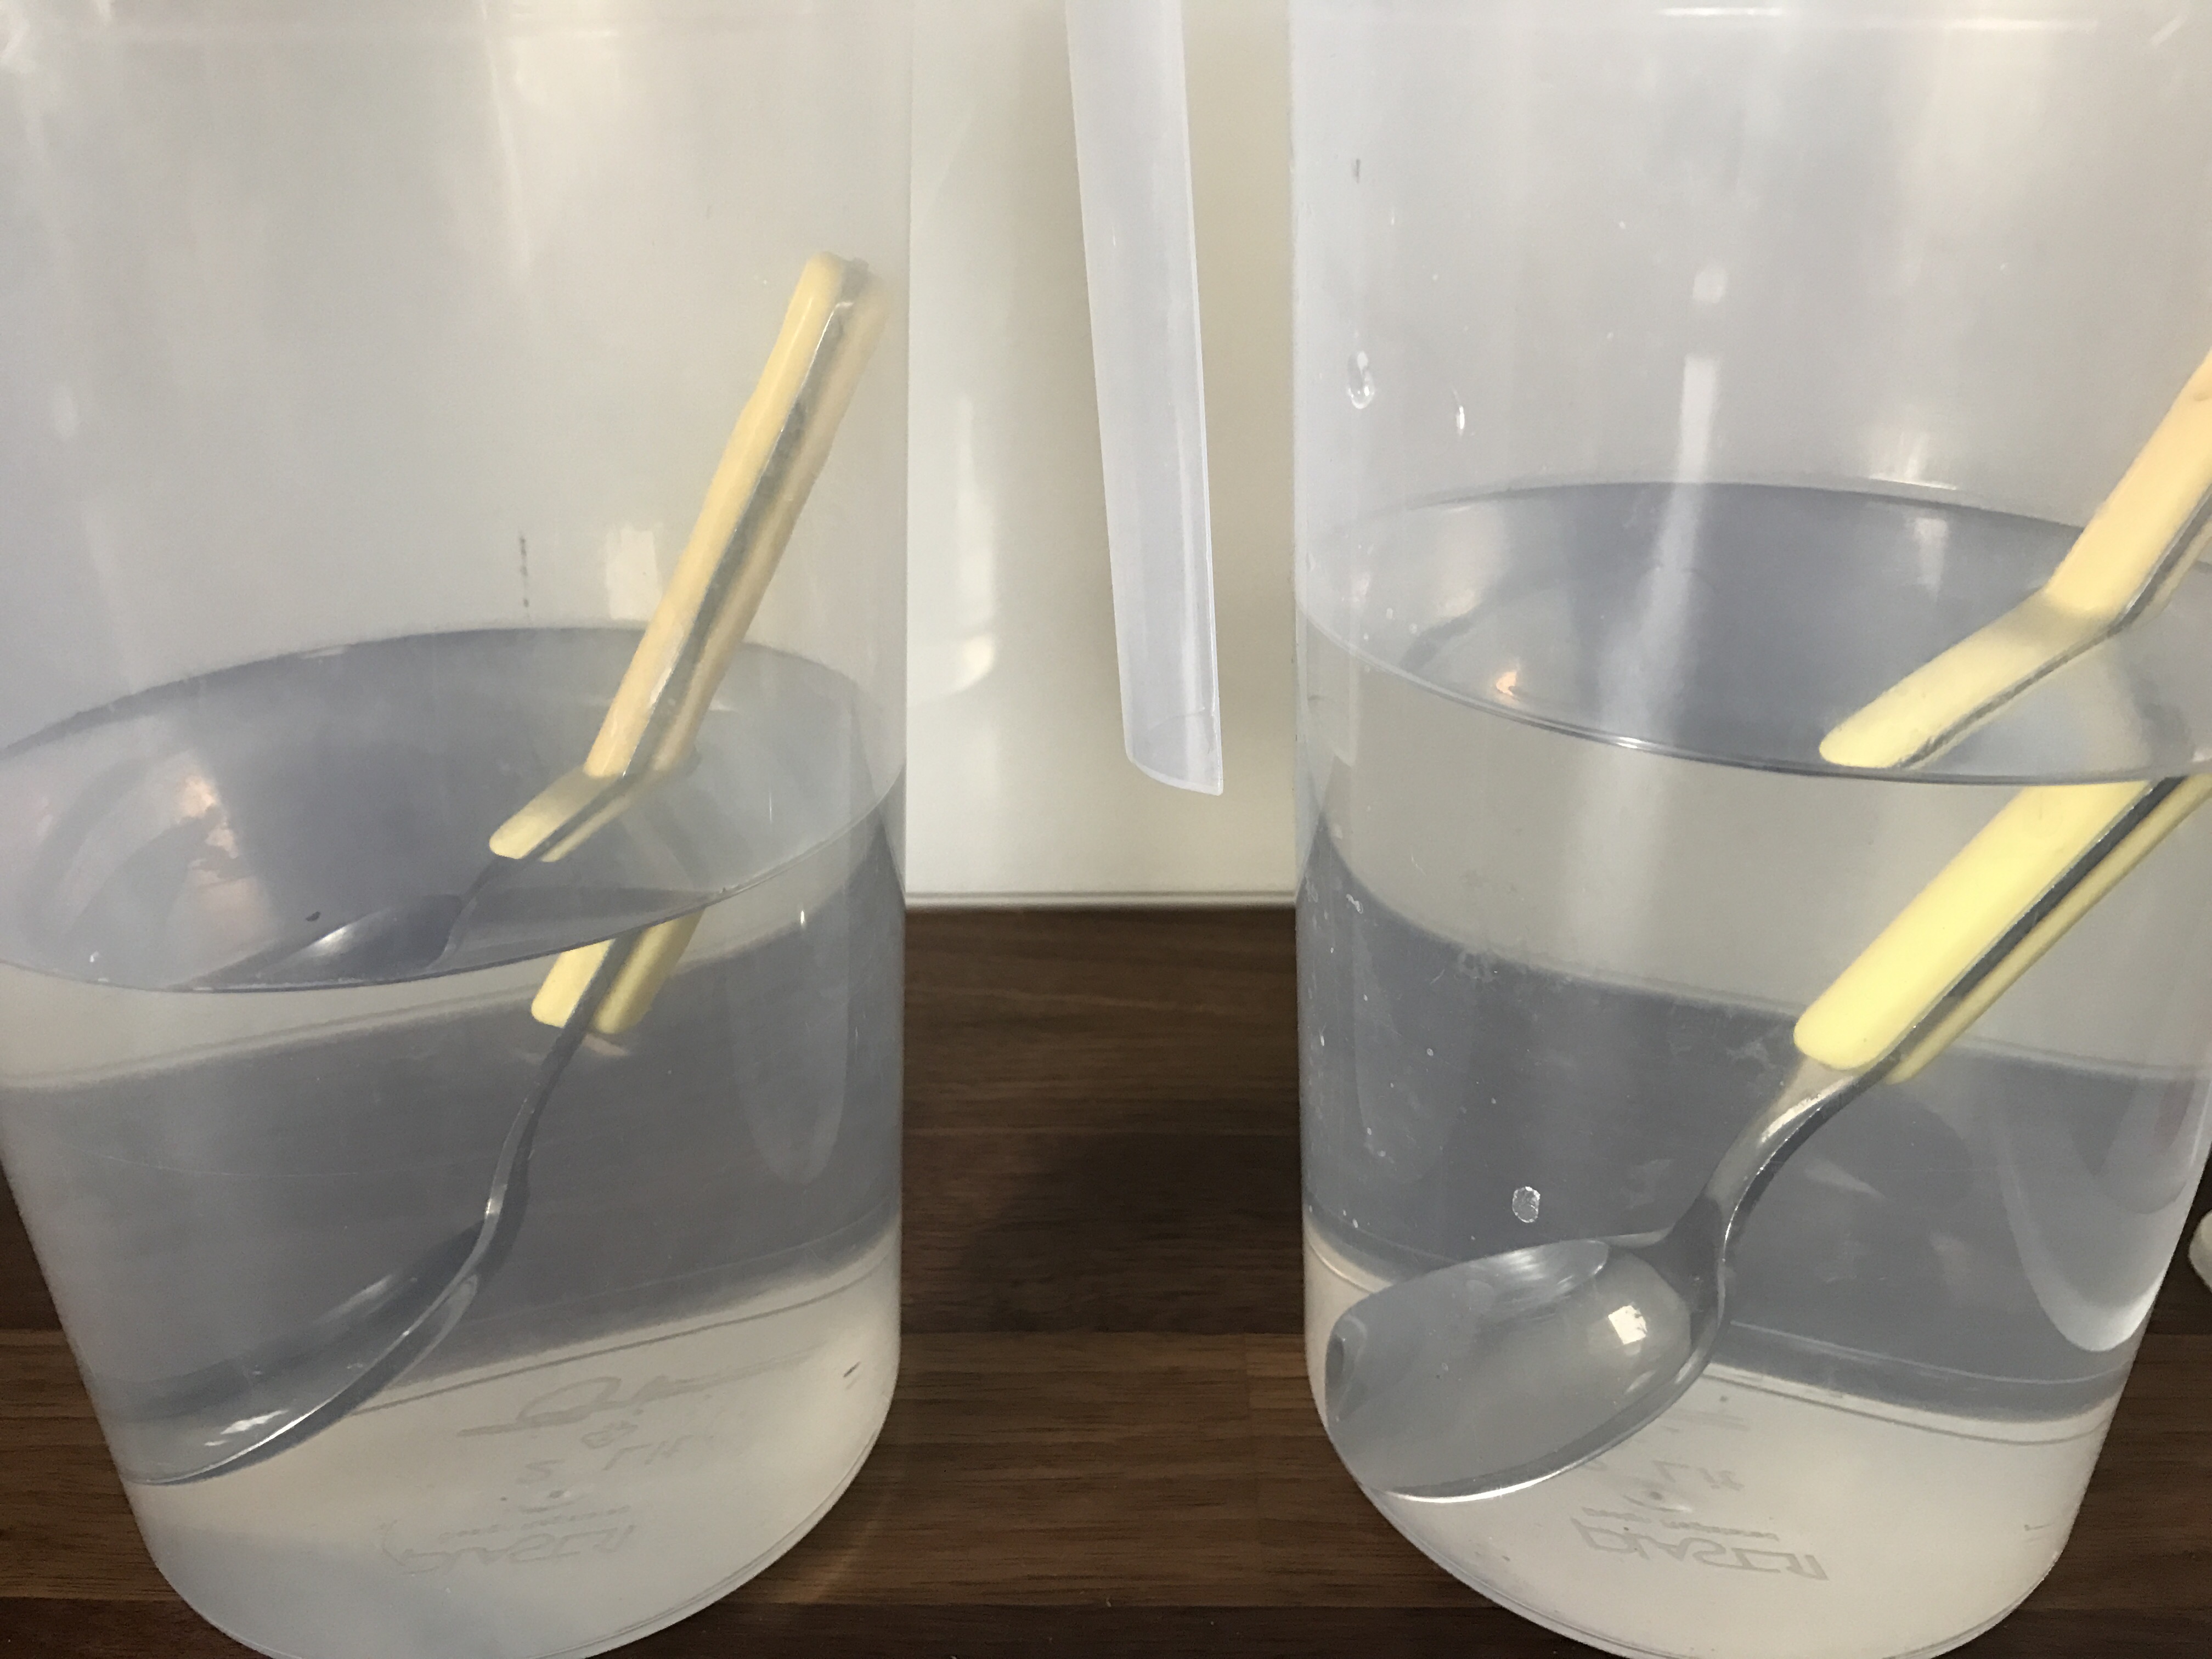
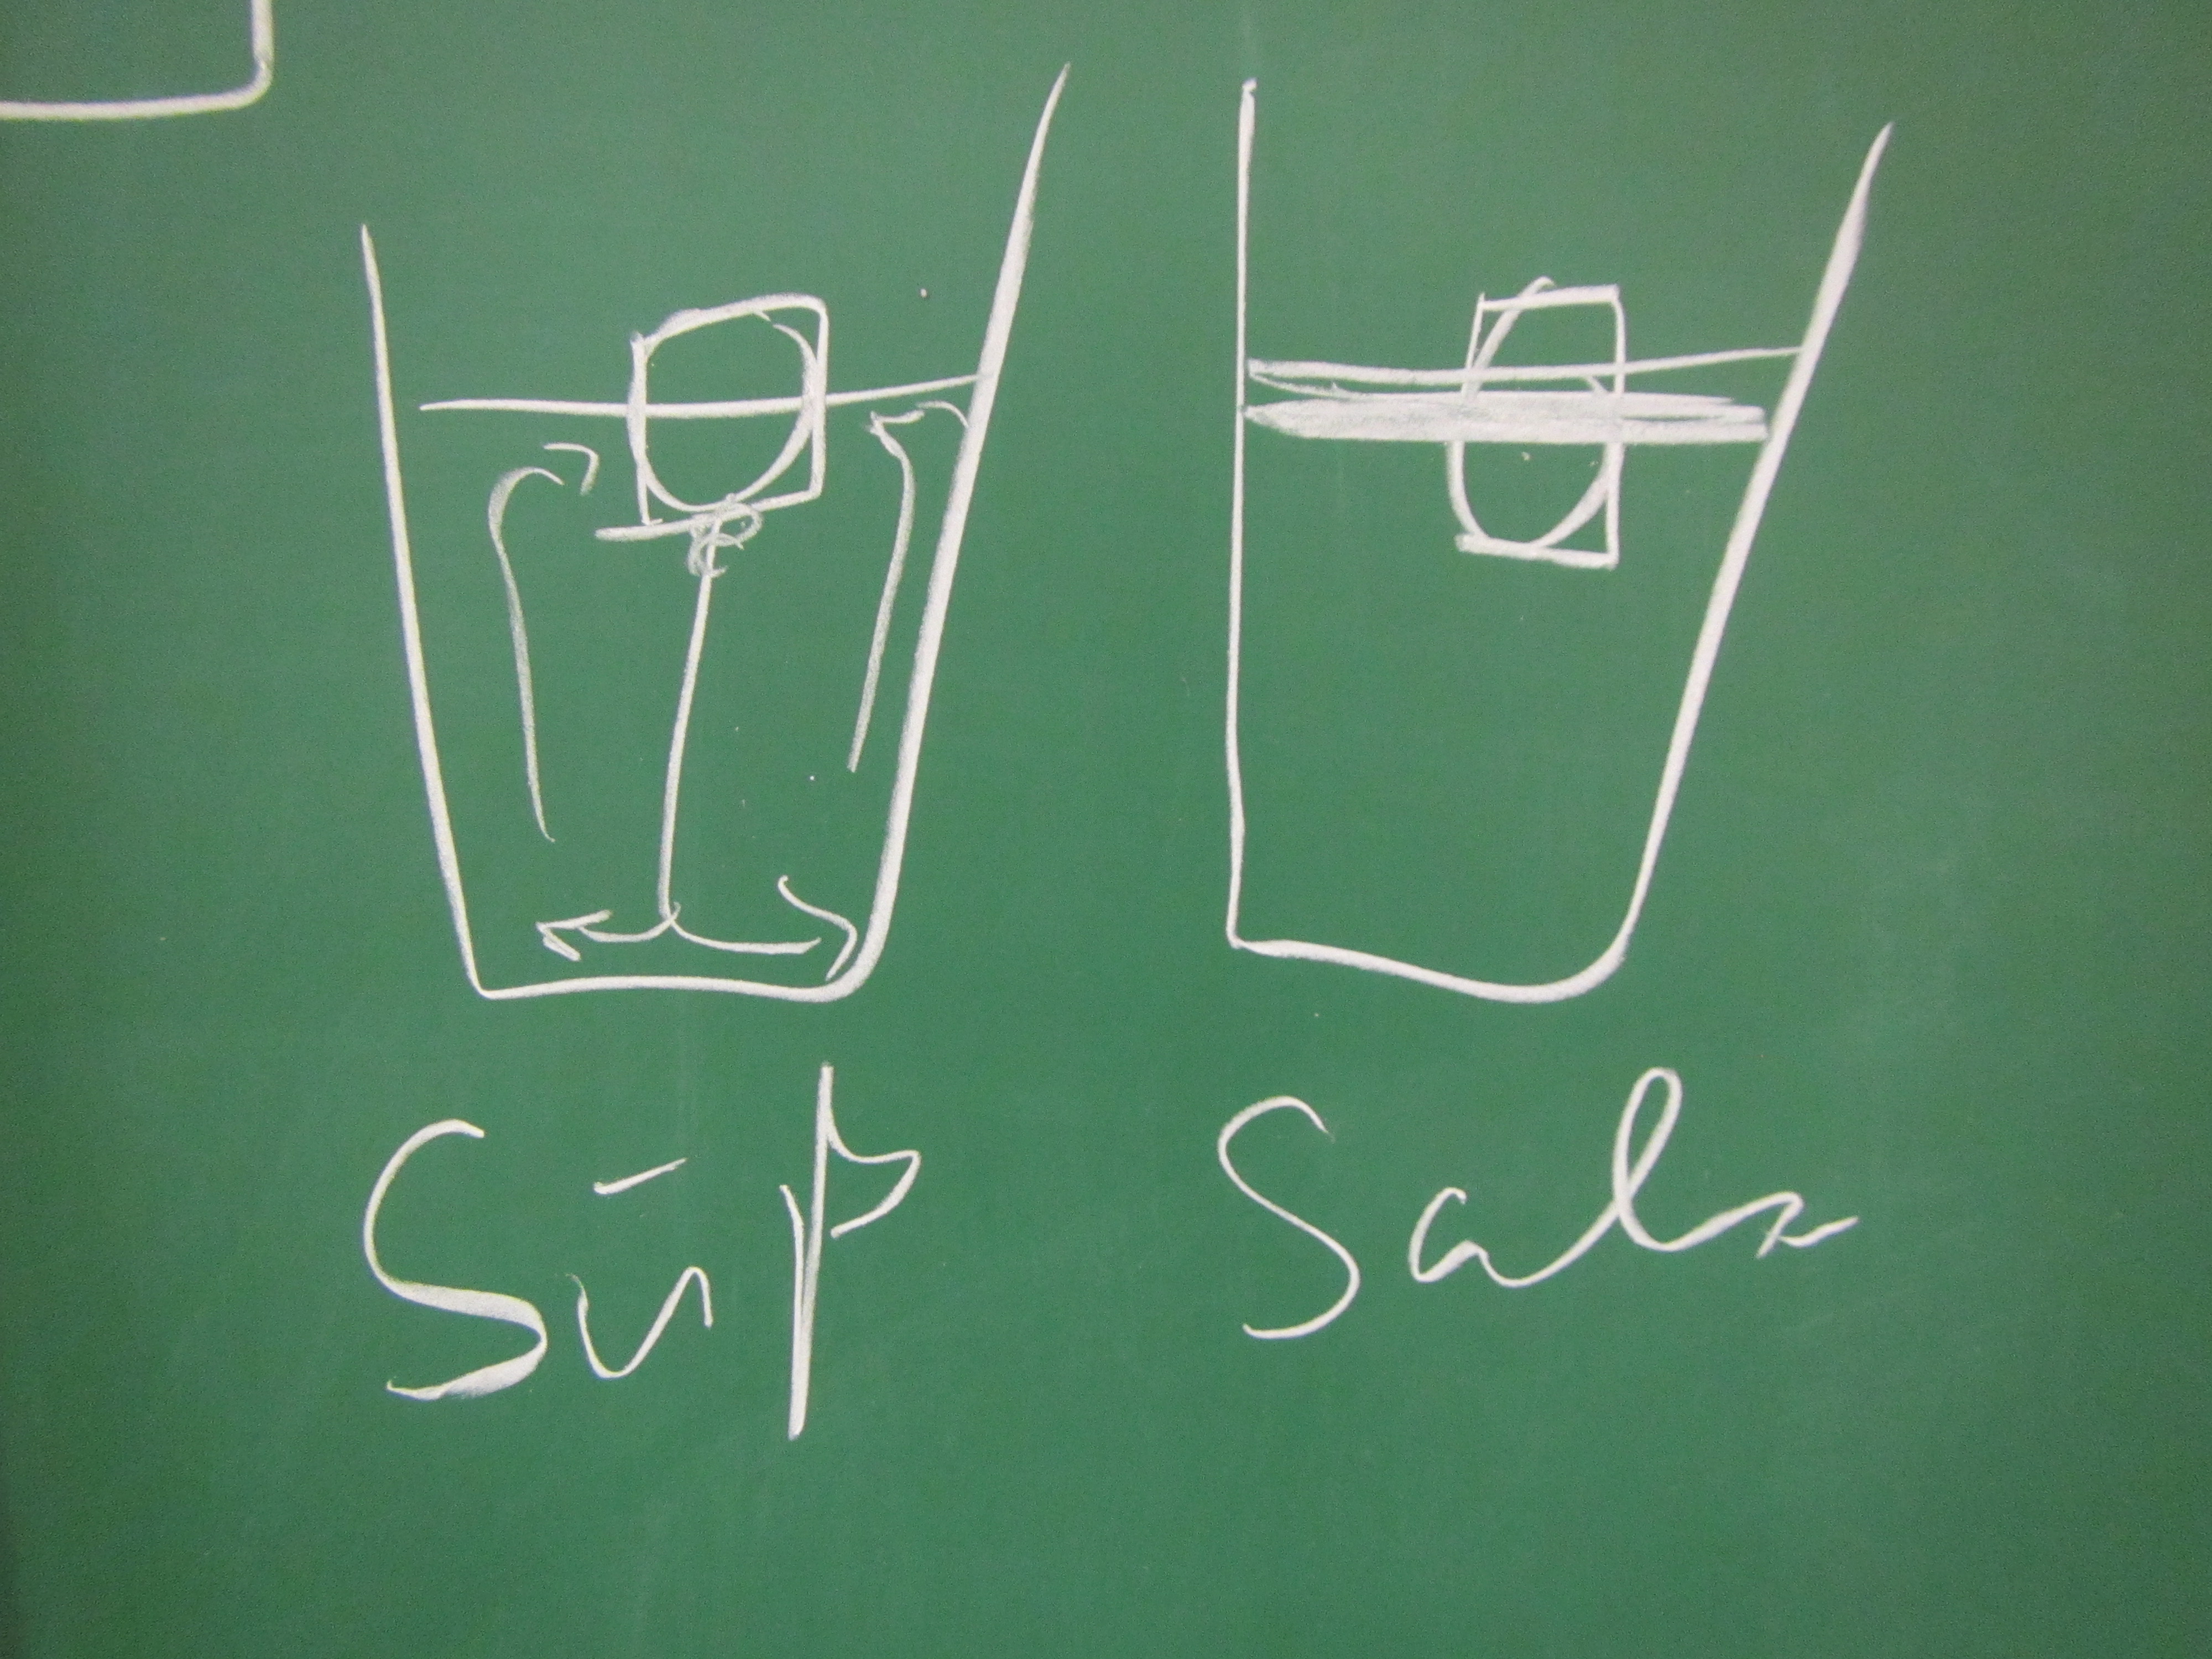
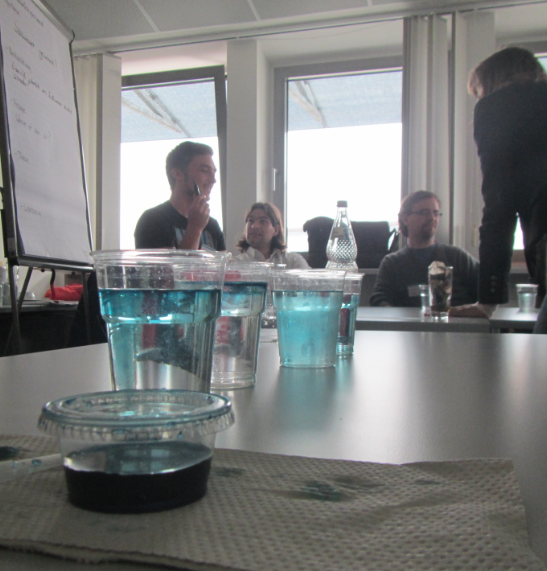
In the second experiment, we created a density stratification: salt water with approximately 35 psu, and freshwater. We then added the dye droplets. The droplets never penetrated into the salty layer but instead layered in at the interface between the two layers. (See how there are internal waves on the interface, which is why the dye seems to penetrate much deeper on the right? If you watch the movie at the bottom of this page, you see the internal wave very clearly) We then added the hair-dryer wind stress.

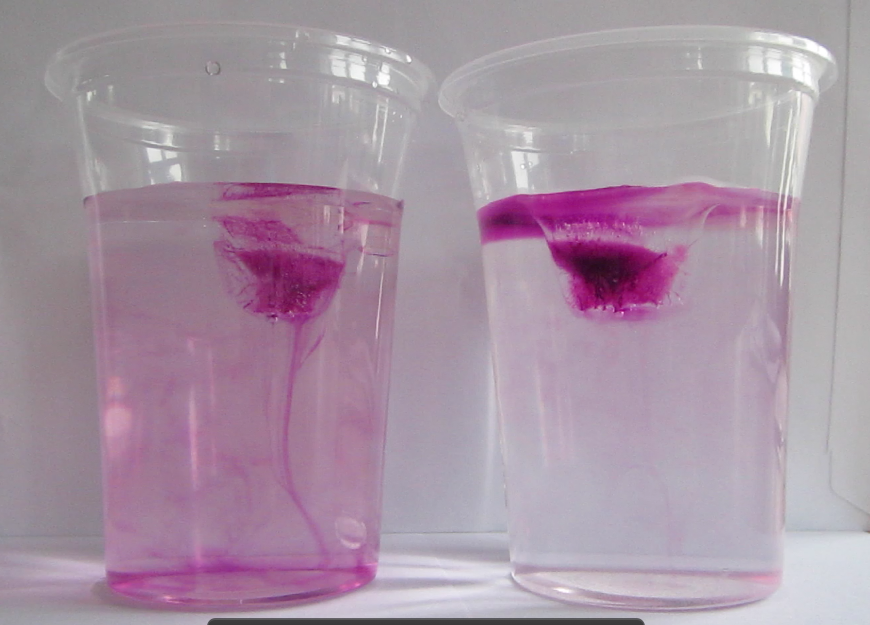
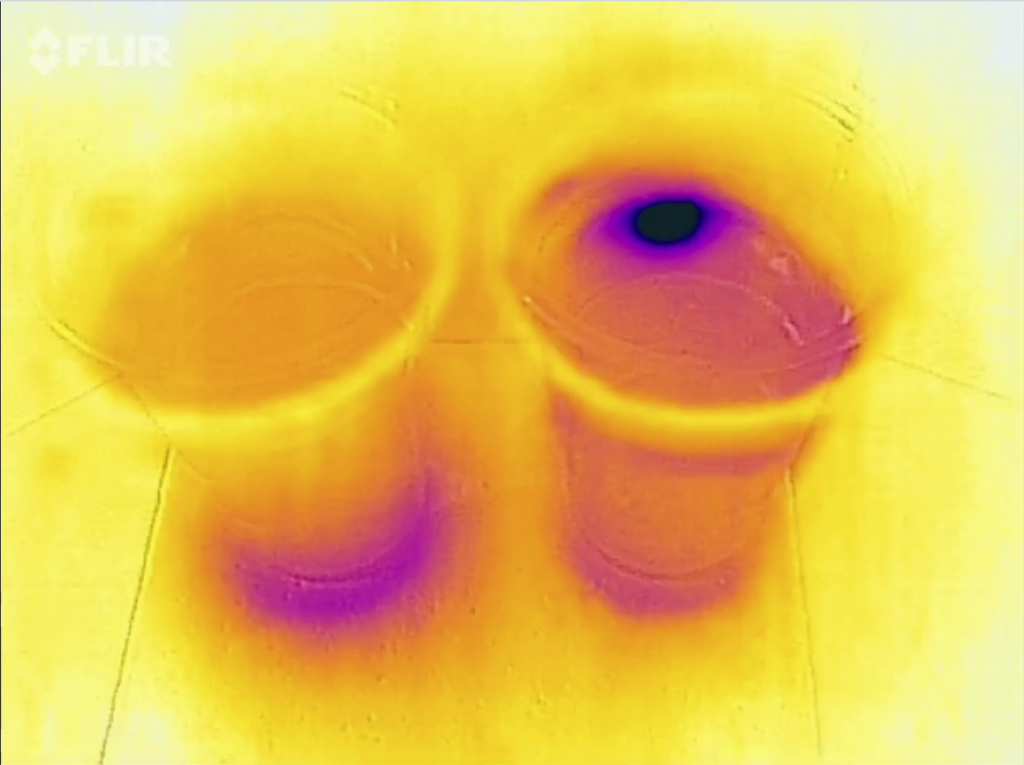
After a minute, the surface layer was well mixed, but there was no mixing penetrating into the bottom layer. (We added blue dye at some point, which makes the picture below a little confusing.) To fully mix the whole depth, the wind forcing ran for 86 minutes (and I am proud to report that my hair dryer survived this ordeal! Don’t leave this experiment on its own, not every hair dryer might make this without catching fire!).

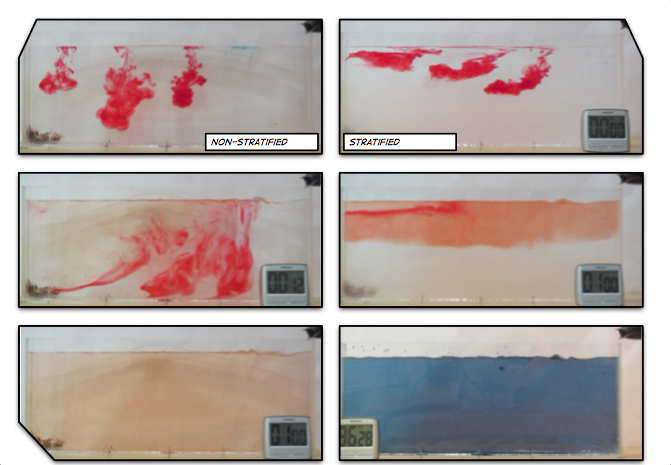
Mixing in a non-stratified tank (left) and in a stratified tank (right). See the stop watch at the bottom of the panels for an impression of the time scales involved!

This is a great demonstration of how mixing is inhibited by stratification. We had expected to see a difference, but we were really surprised that the difference was so large. Of course, the stratification in our tank was pretty harsh, but still.

Watch a short movie below and a movie containing the full time lapse even further down!

P.S.: This text originally appeared on my website as a page. Due to upcoming restructuring of this website, I am reposting it as a blog post. This is the original version last modified on November 27th, 2015.

I might write things differently if I was writing them now, but I still like to keep my blog as archive of my thoughts.

Melting ice cubes experiment — observing the finer details

If you don’t know my favourite experiment for practically all purposes yet (Introduction to experimenting? Check! Thermohaline circulation? Check! Lab safety? Check! Scientific process? Check! And the list goes on and on…), check it out here. (Seriously, of you don’t recognize the experiment from the picture below, you need to read up on it, it’s awesome! :-))

dyed_ice_cubes_02

Susann and I got funding from PerLe (our university’s project to support teaching innovation) to add a couple of cool new features to Susann’s “intro to meteorology” lecture, and doing a hands-on experiment with 50 students in a lecture theatre in their second lecture was only one of the first of many more to come.

We used the experiment to introduce the students to oceanic circulation, and this experiment is, in my experience, very engaging and sparks curiosity, as well as being very nicely suited as a reminder that things are not as easy as they seem to be when you see those nice plots of the great conveyor belt and all the other simplified plots that you typically see in intro-level lectures. Especially understanding that there are many different processes at play simultaneously, and that they have different orders of magnitude and might act in different directions helps counteract the oversimplified views of the climate system that might otherwise be formed.

I usually use dye to make it easier to observe what’s going on in the experiment (either by freezing it directly into the ice cubes as shown in the picture on top of this blog post, or by dripping it onto the melting ice cubes when students have started to observe that — counter to their intuition — the ice cube in the fresh water cup is melting faster than the one in the salt water cup).  We had dye at hand, but I decided on the spur of the moment to not use it, because the students were already focussing on other, more subtle, aspects that the dye would only distract from:

The shape of the ice cubes

In many of the student groups, the most prominent observation was that the shape of the melting ice cubes was very different in the fresh water and salt water case. In the fresh water case, the ice cube melted from the sides inwards: as a cylindrical shape with a radius that was decreasing over time, but in any instance more or less constant for all depths. In the salt water case, however, the ice cube melted upwards: The top did not melt very much at all, but the deeper down you looked the more was melting away. Why?

Condensation on the sides of the cup

Another observation that I prompted was in what regions the cups showed condensation. In the fresh water case, there was a little condensation going on everywhere below the water line, and sometimes there were vertical streaks down from where the ice cube was touching the wall. In the salt water case, there was only a small band of intense condensation close to the water level.

This, not surprisingly, looks very similar to what a thermal imaging camera sees when observing the experiment (as described in this post).

screen-shot-2017-06-11-at-17-12-55

Taken together, those two observations are quite powerful in explaining what is going on, and it seemed to be a fun challenge for the students to figure out why there was condensation on the outside of the cups in the first place (does condensation occur in warmer or colder places?), what it meant that different places ended up being warmer or colder, and how all of that is connected to global ocean circulation. Definitely an experiment I would recommend you do! :-)

About neutrally buoyant particles, popcorn, and more bubbles

When you see all our pretty images of currents and swirling eddies and everything, what you actually see are the neutrally buoyant particles that get lit by the laser in a thin sheet of light. And those particles move around with the water, but in order to show the exact movement of the water and not something they are doing themselves, they need to be of the exact same density as the water, or neutrally buoyant.

But have you ever tried creating something that just stays at the same depth in water and does neither sink to the bottom or float up to the surface? I have, and I can tell you: It is not easy! In fact, I have never managed to do something like that, unless there was a very strong stratification, a very dense lower layer in which stuff would float that fell through a less dense upper layer. And in a non-stratified fluid even the smallest density differences will make particles sink or float up, since they are almost neutral everywhere… One really needs stratification to have them float nicely at the same depth for extended periods of time.

But luckily, here in Grenoble, they know how to do this right! And it’s apparently almost like making popcorn.

You take tiny beads and heat them up so they expand. The beads are made from some plastic like styrofoam or similar, so there are lots of tiny tiny air bubbles inside. The more you heat them up, the more they expand and the lower the density of the beads gets.

But! That doesn’t mean that they all end up having the same density, so you need to sort them by density! This sounds like a very painful process which we luckily didn’t have to witness, since Samuel and Thomas had lots of particles ready before we arrived.

Once the particles are sorted by density, one “only” needs to pick the correct ones for a specific purpose. Since freshwater and salt water have different densities, they also require different densities in their neutrally buoyant particles, if those are to really be neutrally buoyant…

Below you see Elin mixing some of those particles with water from the tank so we can observe how long they actually stay suspended and when they start to settle to either the top or the bottom…

Elin experimenting with the buoyancy of our particles

Elin experimenting with the buoyancy of our particles

Turns out that they are actually very close to the density of the water in the tank, so we can do the next experiment as soon as the disturbances from a previous one have settled down and don’t have to go into the tank in between experiments to stir up particles and then wait for the tank to reach solid body rotation again. This only needs to be done in the mornings, and below you see Samuel sweeping the tank to stir up particles:

Samuel sweeping particles from the topography that sank to the bottom over night

Samuel sweeping particles from the topography that sank to the bottom over night

Also note how you now see lots of reflections on the water surface that you didn’t see before? That’s for two reasons: one is because in that picture there are surface waves in the tank due to all the stirring and they reflect light in more interesting pattern than a flat surface does. And the other reason is that now the tank is actually lit — while we run experiments, the whole room is actually dark except for the lasers, some flashing warning signs and emergency exit signs close to the doors and some small lamps in our “office” up above the rotating tank.

But now to the “more bubbles” part of the title: Do you see the dark stripes in the green laser sheet below? That’s because there are air bubbles on the mirror which is used to reflect the laser into the exact position for the laser sheet. Samuel is sweeping them away, but they keep coming back, nasty little things…

Samuel sweeping particles from the topography that sank to the bottom over night

Samuel sweeping particles from the topography that sank to the bottom over night

I actually just heard about experiments with a different kind of neutrally buoyant particles the other day, using algae instead of plastic. I find this super intriguing and will keep you posted as I find out more about it!

Melting ice cubes & thermal imaging camera

I haven’t talked about my favourite experiment in a long time (before using it last week in the MeerKlima congress and suddenly talking about it all the time again), because I felt like I had said everything there is to say (see a pretty comprehensive review here) BUT! a while back my colleagues started playing with a thermal imaging camera and that gave me so many new ideas! :-)

I showed you this picture yesterday already:

img_9381

Here we see ice cubes melting in fresh water and salt water (and my very fancy experimental setup. But I am pretty proud of my thermal insulation!). Do you know which cup contains which?

Here are some more pics: The ice cubes before being dropped into the cups. Clearly dark purple is cold and yellow/white is warm (see my fingers?)

screen-shot-2017-06-11-at-17-12-29

After a while (5ish minutes), the cold meltwater has filled up the bottom of the freshwater cup while floating on top of the salt water cup:

screen-shot-2017-06-11-at-17-12-55

Looking in from the top, we see that the ice cube in salt water hasn’t melted yet, but that the other one is gone completely and all the cold water has sunk to the bottom of the beaker.

screen-shot-2017-06-11-at-17-13-20

When you check out the movie at the bottom of this post, you will notice that this experiment doesn’t work quite as well as I had hoped: In the saltwater cup, the ice cube floats against the wall of the cup and for quite some time it looks like there is a plume of cold water sinking in the salt water. I’m not quite sure what’s going on there. If it’s showing up like that because the cup is such a good thermal conductor, then why is the “plume” directional and not spreading in all directions? If there really is a plume, then how did it get there? It shouldn’t be! So many questions!

There really can’t be a plume of cold melt water in the salt water cup. For my workshop last week I made the plot below (which, btw, I don’t think anyone understood. Note to myself: Explain better or get rid of it!). So unless the plume is cold salt water, there is no way anything would sink in the salt water cup.

screen-shot-2017-06-11-at-17-23-02

So maybe we are cooling the salt water around the ice cube which then sinks and shows up because it is close to the wall of the cup? We can’t look “into” the cup with a thermal imaging camera, we can only see the surface of the cup (See, Joke? Maybe it is useful after all to learn all that stuff in theoretical oceanography ;-)). That’s also why we don’t see a plume of cold melt water in the freshwater case like we see when we have dyed ice cubes and see the melt water plume, like below:

dyed_ice_cubes_02

Anyway. Here is the video, in which you sometimes see my finger, pushing the ice cube away from the beaker’s wall to finally get to a state that looks like what I wanted to show you above:

Workshop prep and a riddle

Looking at the picture below, can you guess which experiment I am going to do at the MeerKlima.de workshop? Yep, my favourite experiment — melting ice cubes! :-)

And I am obviously prepared for several extensions of the classic experiment should the students be so inclined…

Now I only need to get the ice cubes from Kiel to Hamburg — and as ice cubes, not a colourful, salty, wet mess :-)

Having gotten that backstory as a hint, any idea what’s going on with the spoons below?

Yep. Freshwater on the left, salt water on the right. Different refraction indices due to different densities. Neat :-)

On the impact of blogging — or how far does my message mix?

What is the impact of this blog? And who am I writing it for?

Those are not questions I regularly ask myself. The main reason I started blogging was to organise all the interesting stuff I was collecting for my introduction to oceanography lecture at the University of Bergen in one place, so I would be able to find it when I needed it again. And I wanted to share it with friends who were interested in teaching oceanography or teaching themselves.

Another of the reasons why I blog is that I notice a lot of exciting features in everyday life that relate to oceanography and/or physics, that other people would just walk past and not notice, and that I would like to share the wonder of all those things with others. And noticing all this stuff is so much FUN! The blog “gives me permission” to play, to regularly do weekend trips to weirs or ship lifts or other weird landmarks that I would probably not seek out as often otherwise.

But the other day I was browsing the literature on science blogging in order to come up with recommendations for the design of what is to become the Kiel Science Outreach Campus’ (KiSOC) blog. I came across a paper that resonated with me on so many levels: “Science blogs as boundary layers: Creating and understanding new writer and reader interactions through science blogging” by M-C Shanahan (2011). First, I really liked to see the term “boundary layer” in the title, since it brings to mind exciting fluid mechanics. Then second, I read that the boundary phenomena I was thinking of were really where the term “boundary layer” came from even in this context. And then I realised that I have had “boundary layer” experiences with this blog, too!

So what are those boundary layers about? Well, in fluid mechanics, they are the regions within fluids that interact with “something else” — the boundary of a flow, e.g. a pipe, or a second fluid of different properties.  They are a measure for the region over which temperature or salinity or momentum or any other property is influenced by the boundary. But the same construct can be used for social groups, i.e. in my case oceanographers and non-oceanographers. (You should, btw, totally check out the original article! Her example is even more awesome than mine)

But here is my own boundary layer experience: My sister sent me an email with the subject “double-diffusive mixing” and a picture she had taken! My sister is not an oceanographer, and I wasn’t even aware that she associated the term “double-diffusive mixing” with anything in particular other than me writing my Diplom thesis about it and probably talking about a lot. But that she would recognise it? Blew my mind!

Turns out what she saw is actually convection, but it doesn’t look that dissimilar from salt fingers, and how awesome is it that she notices this stuff and thinks of oceanography?

DSC03217

Day 1. The remaining pink soap starts making its way up through the refill of clear soap.

Obviously I asked for follow-up pictures:

DSC03232

Day 2. A lot of the pink soap has reached the top, passing through the clear refill.

DSC03267

Day 3. All of the “old” pink soap is now on its way up through the clear refill.

And I had another boundary layer experience recently: A sailor on the Norwegian research vessel Håkon Mosby with many many years experience at sea had seen my book and told me that he now looks at waves in a new way. How awesome is that? That’s the biggest compliment my book could get, to teach something new about visual observations of the ocean to someone who looks at the ocean every single day!

Anyway. Reading this article made me think about how happy both those boundary layer experiences made me, and that maybe I should actually start aiming at creating more of those. Maybe not with this blog, that I kinda want to keep as my personal brain dump, but there are so many different ways to interact more with people who would potentially be super interested in oceanography if only they knew about it… I guess there is a reason why I am working the job I am :-)


Shanahan, M. (2011). Science blogs as boundary layers: Creating and understanding new writer and reader interactions through science blogging Journalism, 12 (7), 903-919 DOI: 10.1177/1464884911412844

Observe a fresh water layer (with your eyes, not a CTD!)

Sometimes you actually see fresh water layers (see with your eyes, not a CTD or some other instrument) floating on top of denser waters, not only in your kitchen and with the help of dye, but for real. In this case, you see the layers because the shadow of a pole appears twice — once on the surface itself, and once on the interface between the layers.

IMG_4859

See below: Shadow on the surface between the red lines, on the interface between green lines, and the reflection on the surface between blue lines.

IMG_4859

I took these pictures on a trip to Husum with my sister and her family.

Why moist air is lighter than dry air.

Why is moist air lighter than dry air? This seems pretty counter-intuitive at first, but then really isn’t.

I promised to do a post on why moist air is lighter than dry air a long time ago, and wrote it about a year and a half ago (!), but never published it. So here we go now!

First, we need to assume that air is an ideal gas. In that case, the number of molecules in a given volume depends only on the pressure and temperature of the gas. This is given in the ideal gas law:

PV=NkT

with P the pressure, V the volume, N Avogadro’s number = 6.0221 x 10²³ /mol, k the Bolzman constant 1.38066 x 10⁻²³ J/K and T the absolute temperature.

Is the assumption that air is an ideal gas a good one? Despite my sister’s insistence, I am not going to write a post on how I dyed all molecules in a volume of air and counted them (very funny, ha ha). So experimentally confirming N or k isn’t going to happen. But we can qualitatively show that if the number of gas molecules increases and the temperature stays the same, pressure and/or volume have to increase. We can also show that if we change the volume, this will affect pressure and temperature. All of those experiments might happen in a future post, they are all pretty standard and not very exciting.

Assuming that the ideal gas law holds for air, this means that since the number of molecules per volume is constant, the density depends on the mass of the molecules inside the volume.

Air contains a lot of N2 and O2. N’s atomic unit mass is 14, O’s is 16. N2 and O2 hence are heavy molecules with N2 weighing 28 and O2 32 atomic units. Water vapor are water molecules, and the atomic weight of H2O is 16+1+1 = 18. Each water vapor molecule is hence a lot lighter than any N2 or O2 molecule, and since the total number of molecules per volume at a given temperature and pressure is constant, the more H2O molecules replace N2 or O2 molecules, the moister – and lighter – the air gets.

Taking the hydrostatic paradox to the next (water) level

How well do people understand hydrostatics? I am preparing a workshop for tomorrow night and I am getting very bored by the questions that I have been using to introduce clickers for quite a lot of workshops now. So I decided to use the hydrostatic paradox this time around.

The first question is the standard one: If you have a U-tube and water level is given on one side, then what is the water level like on the other side? We all know the typical student answer (that typically 25% of the students are convinced of!): On the wider side the water level has to be lower since a larger volume of water is heavier than the smaller volume on the other side.

Clearly, this is not the case:

IMG_3362

However, what happens if you use that fat separator jug the way it was intended to be used and fill it with two layers of different density (which is really what it is intended for: to separate fat from gravy! Your classical 2-layer system)?

Turns out that now the two water levels in the main body of the jug and in the spout are not the same any more: Since we filled the dense water in through the spout, the spout is filled with dense water, as is the bottom part of the jug. Only the upper part of the jug now contains fresh water.

IMG_3364

The difference in height is only maybe a millimetre, but it is there, and it is clearly visible:

IMG_3364

Water level 1 (red line) is the “main” water level, water level 2 (green line) is the water level in the spout and clearly different from 1, and water level 3 is the density interface.

We’ll see how well they’ll do tomorrow when I only give them levels 1 and 3, and ask them to put level 2 in. Obviously we are taking the hydrostatic paradox to the next (water) level here! :-)

Ice cubes melting in fresh water and salt water. By Mirjam S. Glessmer

Using the “melting ice cube” experiment to let future instructors experience inquiry-based learning.

Using the “melting ice cube” experiment to let future instructors experience inquiry-based learning.

I recently (well, last year, but you know…) got the chance to fill in for a colleague and teach part of a workshop that prepares teaching staff for using inquiry-based learning in their own teaching. My part was to bring in an experiment and have the future instructors experience inquiry-based learning first hand.

So obviously I brought the ice cubes melting in fresh water and salt water experiment! (Check out that post to read my write-up of many different ways this experiment can be used, and what people can learn doing it). On that occasion the most interesting thing for me was that when we talked about why one could use this — or a similar — experiment in teaching, people mainly focussed on the group aspect of doing this experiment: How people had to work together in a team, agree to use the same language and notation (writing “density of water at temperature zero degree Celsius” in some short syntax is not easy when you are not an oceanographer!).

IMG_3179

And this experiment never fails to deliver:

  • you can be 100% sure that at least in one group, someone will say “oh wait, which was the salt water again?” which hands you on a plate the opportunity to say “see — this is a great experiment to use when talking about why we need to write good documentation already while we are doing the experiment!”
  • you can also be 100% sure that in that group, someone will taste the water to make sure they know which cup contains the salt water. Which lets you say your “see — perfect experiment to talk about lab safety stuff! Never ever put things in your mouth in a lab!”
  • you can also be sure, that people come up with new experiments they want to try. At EMSEA14, people asked what would happen if the ice cubes were at the bottom of the beaker. Today, people asked what the dye would do if there was no ice in the cups, just salt water and fresh water. Perfect opportunity to say “try! Then you’ll know! And btw — isn’t this experiment perfect to inspire the spirit of research (or however you would say that in English – “Forschergeist” is what I mean!). This is what you see in the pictures in this blog post.

IMG_3184

So yeah. Still one of my favorite experiments, and I LOVE watching people discover the fascination of a little water, ice, salt and food dye :-)

Experiment_06

Photo taken by Ulrike Bulmann

Experiment_08

Photo taken by Ulrike Bulmann

Btw, when I gave a workshop on active learning last week and mentioned this experiment, people got really really hooked, too, so I’ll leave you with a drawing that I liked:

IMG_4306